Fig. 1
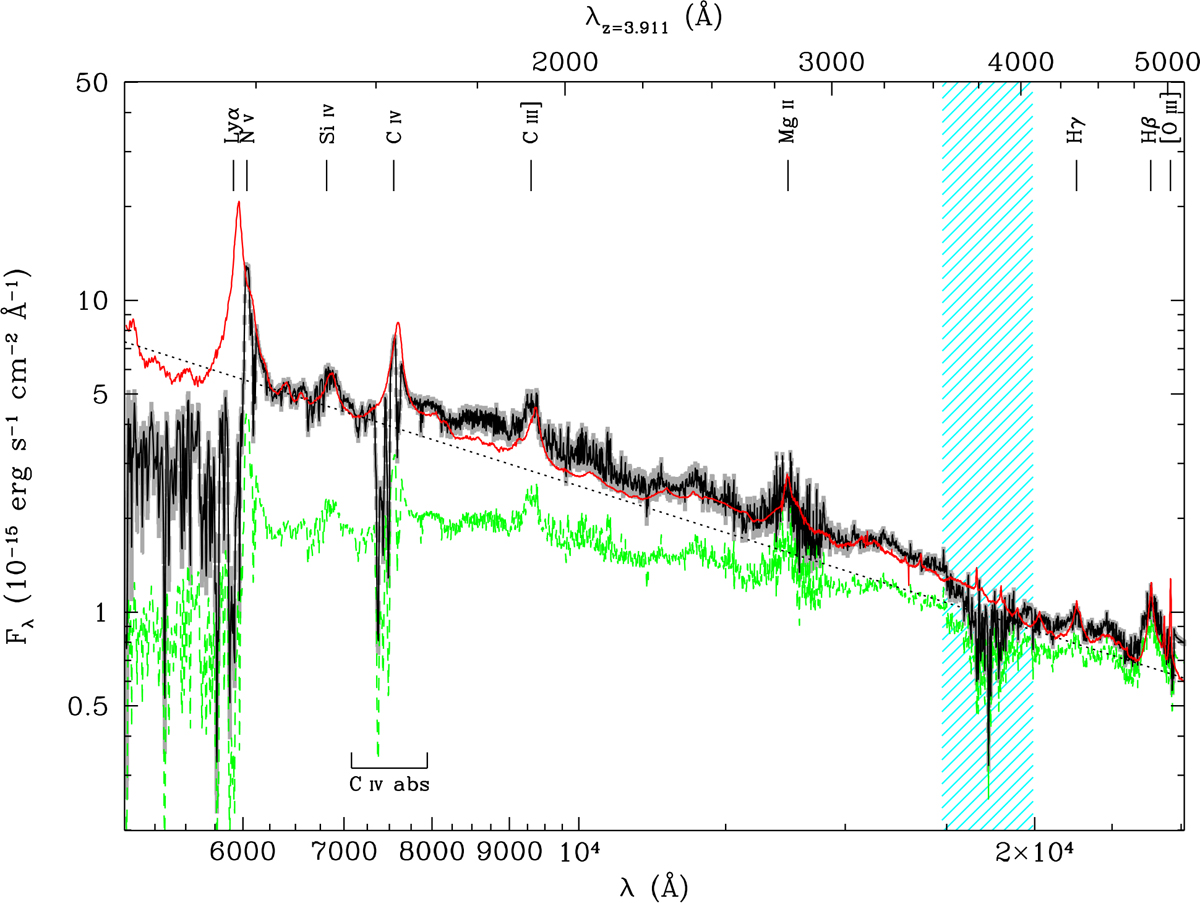
Calibrated spectrum of APM 08279+5255 before (green dashed line) and after dereddening (black solid line), with corresponding 1σ uncertainty (gray band) – see Sect. 2. Superimposed to the data, the composite quasar template obtained by matching the Vanden Berk et al. (2001) and Glikman et al. (2006) templates around λ ~ 3000 Å in the restframe (red line) is shown. The continuum level is marked as a black dotted line with slope − 1.54. A residual telluric absorption is still present between λ ~ 17 500 Å and 20 000 Å (cyan shaded area), hence this spectral interval is excluded from the present analysis.
Current usage metrics show cumulative count of Article Views (full-text article views including HTML views, PDF and ePub downloads, according to the available data) and Abstracts Views on Vision4Press platform.
Data correspond to usage on the plateform after 2015. The current usage metrics is available 48-96 hours after online publication and is updated daily on week days.
Initial download of the metrics may take a while.