| Issue |
A&A
Volume 617, September 2018
|
|
|---|---|---|
| Article Number | C2 | |
| Number of page(s) | 2 | |
| Section | Cosmology (including clusters of galaxies) | |
| DOI | https://doi.org/10.1051/0004-6361/201731445e | |
| Published online | 25 September 2018 | |
The cosmological analysis of X-ray cluster surveys
IV. Testing ASpiX with template-based cosmological simulations (Corrigendum)
1
IRFU, CEA, Université Paris-Saclay, 91191 Gif-sur-Yvette, France
e-mail: This email address is being protected from spambots. You need JavaScript enabled to view it.
2
Université Paris Diderot, AIM, Sorbonne Paris Cité, CEA, CNRS, 91191 Gif-sur-Yvette, France
3
Departments of Physics and Astronomy and Michigan Center for Theoretical Physics, University of Michigan, Ann Arbor, MI, USA
4
Max Planck Institut für Extraterrestrische Physik, Giessenbachstrasse 1, 85748 Garching bei München, Germany
5
CNRS, IRAP, 9 Av. colonel Roche, 31028 Toulouse cedex 4, France
6
Université de Toulouse, UPS-OMP, IRAP, Toulouse, France
7
Argelander Institut für Astronomie, Universität Bonn, 53121 Bonn, Germany
Key words: X-rays: galaxies: clusters / cosmological parameters / methods: statistical / errata, addenda
In the Valotti et al. (2018) paper, Figs. 2, 3, and 10 were published at low resolution, resulting in images that are not easy to read. We provide higher-quality figures here in the downloadable pdf.
 |
Fig. 2. X-ray observable diagram computed for a 700 deg2 cluster survey, observed with 10 ks XMM exposures. Panels 1-6: 2D projections of the distribution of the four cluster parameters involved in the present study: CR in [0.5–2] keV, HR1 ([1–2]/[0.5–1] keV), HR2 ([2–5]/[0.5–2]) keV, angular cluster size rc. The diagrams are integrated over the 0 < z < 2 range, but this fifth dimension can be uncompressed if redshifts are available, which significantly increases the cosmological constraining power of the ASpiX method. Error measurements are not implemented in this example. |
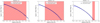 |
Fig. 3. Cumulative dark matter halo number density as a function of mass at different epochs. Blue dots show Aardvark simulations. The pink areas show the mass range encompassed by the C1 selection. The mass scale of 1013.2 M⊙ represents the halo mass resolution limit of the simulations. |
 |
Fig. 10. Effects of measurement errors on the C1 CLEAN sample. The plots show from left to right the 2D diagrams CR-HR, CR-rc, and HR-rc. The first row stands for the nominal CR, HR, and rc values stored in the Aardvark catalogues. The second row shows the result of the implementation of the error model displayed in Fig. 9. |
© ESO 2018
Current usage metrics show cumulative count of Article Views (full-text article views including HTML views, PDF and ePub downloads, according to the available data) and Abstracts Views on Vision4Press platform.
Data correspond to usage on the plateform after 2015. The current usage metrics is available 48-96 hours after online publication and is updated daily on week days.
Initial download of the metrics may take a while.