Free Access
Fig. C.3
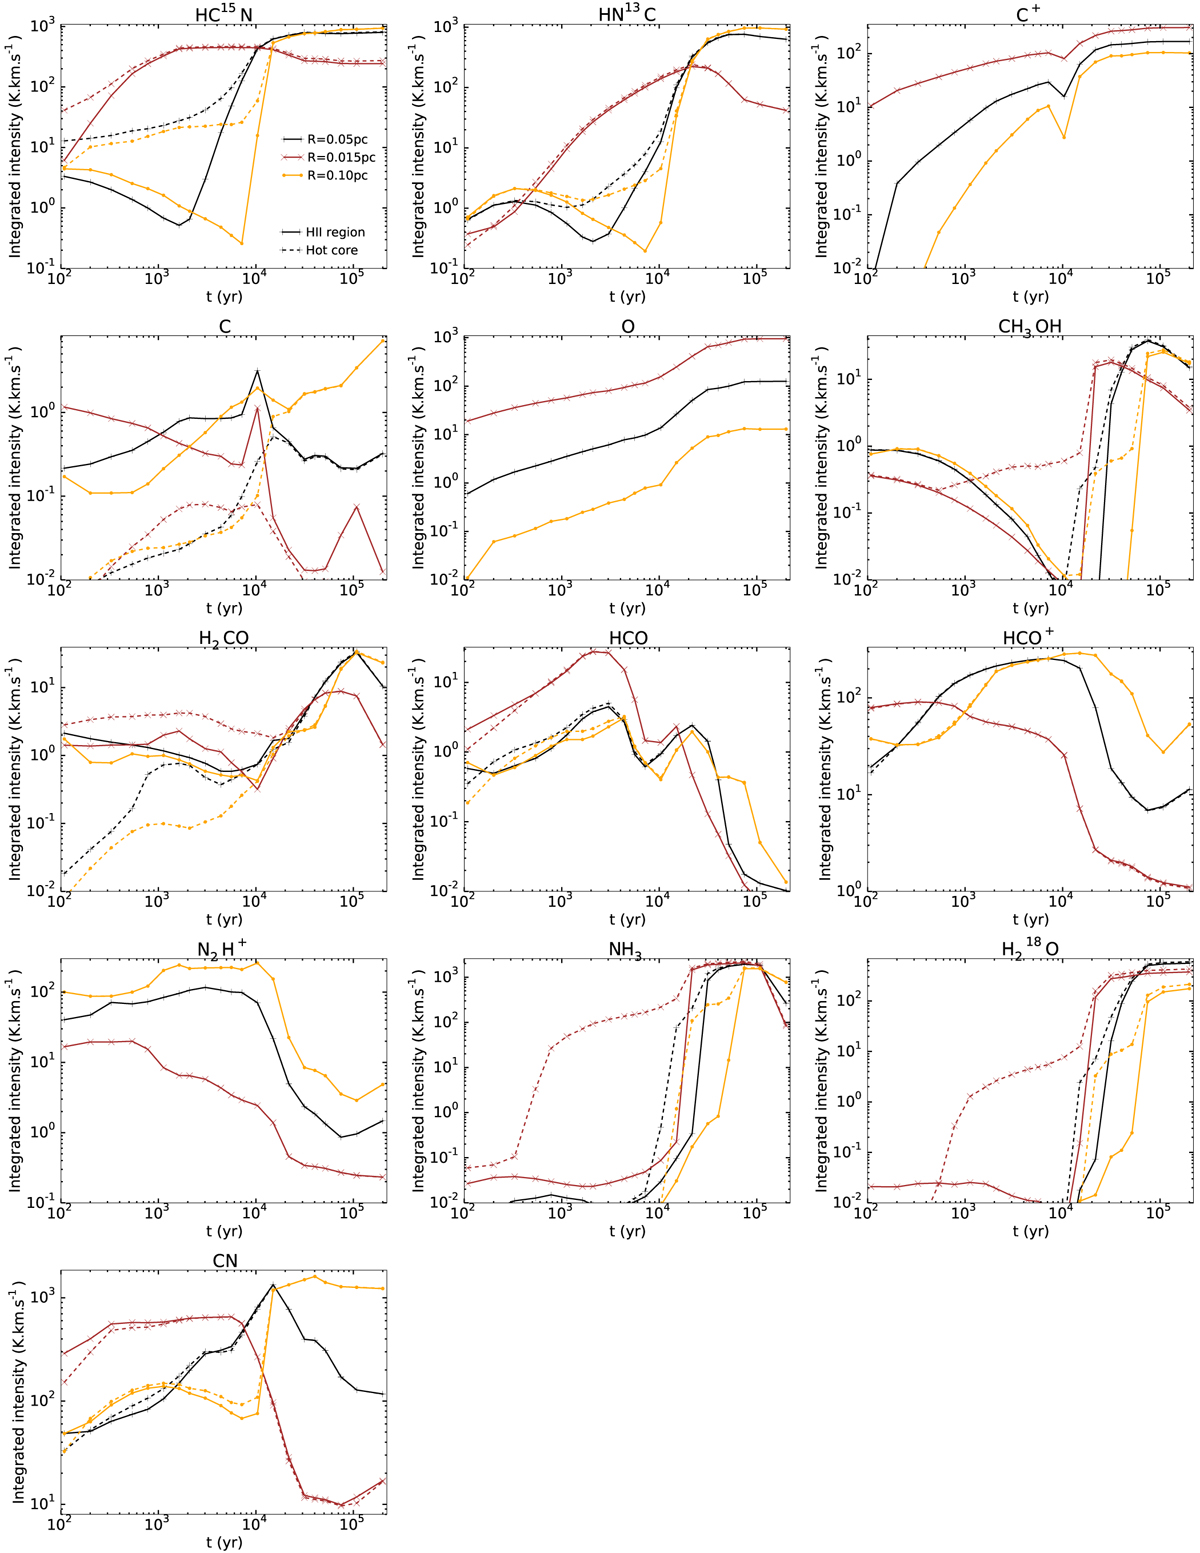
Change of the size of the ionized cavity r0.015, r0.05 and r0.10: Time evolution of the integrated intensities of the selected species listed in Table 5. Model mHII is represented with solid line and model mHHMC with dashedline. Model r0.015 is represented in brown, model r0.05 in black, and model r0.10 in yellow.
Current usage metrics show cumulative count of Article Views (full-text article views including HTML views, PDF and ePub downloads, according to the available data) and Abstracts Views on Vision4Press platform.
Data correspond to usage on the plateform after 2015. The current usage metrics is available 48-96 hours after online publication and is updated daily on week days.
Initial download of the metrics may take a while.