Fig. 17
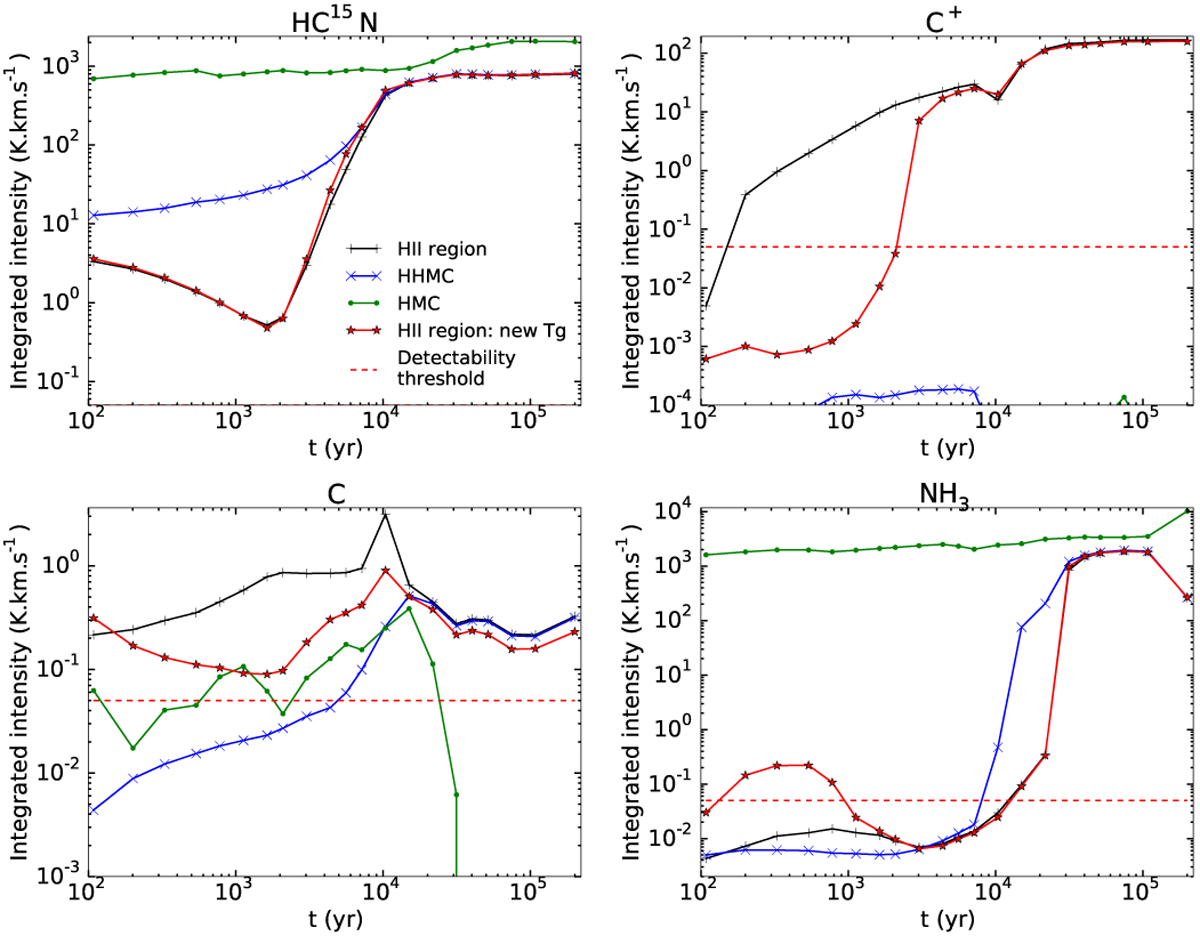
Time evolution of the integrated intensities of HC15N, C+, C and NH3 (see the corresponding transition in Table 5). The reference model mHII is represented in black, model mHHMC in blue and model mHMC in green and the new HII region model in red. The red dashed line represents the detectability threshold of 5×10⁻² K km s−1 obtained with an assumed rms noise of 3 mK.
Current usage metrics show cumulative count of Article Views (full-text article views including HTML views, PDF and ePub downloads, according to the available data) and Abstracts Views on Vision4Press platform.
Data correspond to usage on the plateform after 2015. The current usage metrics is available 48-96 hours after online publication and is updated daily on week days.
Initial download of the metrics may take a while.