Free Access
Fig. 15
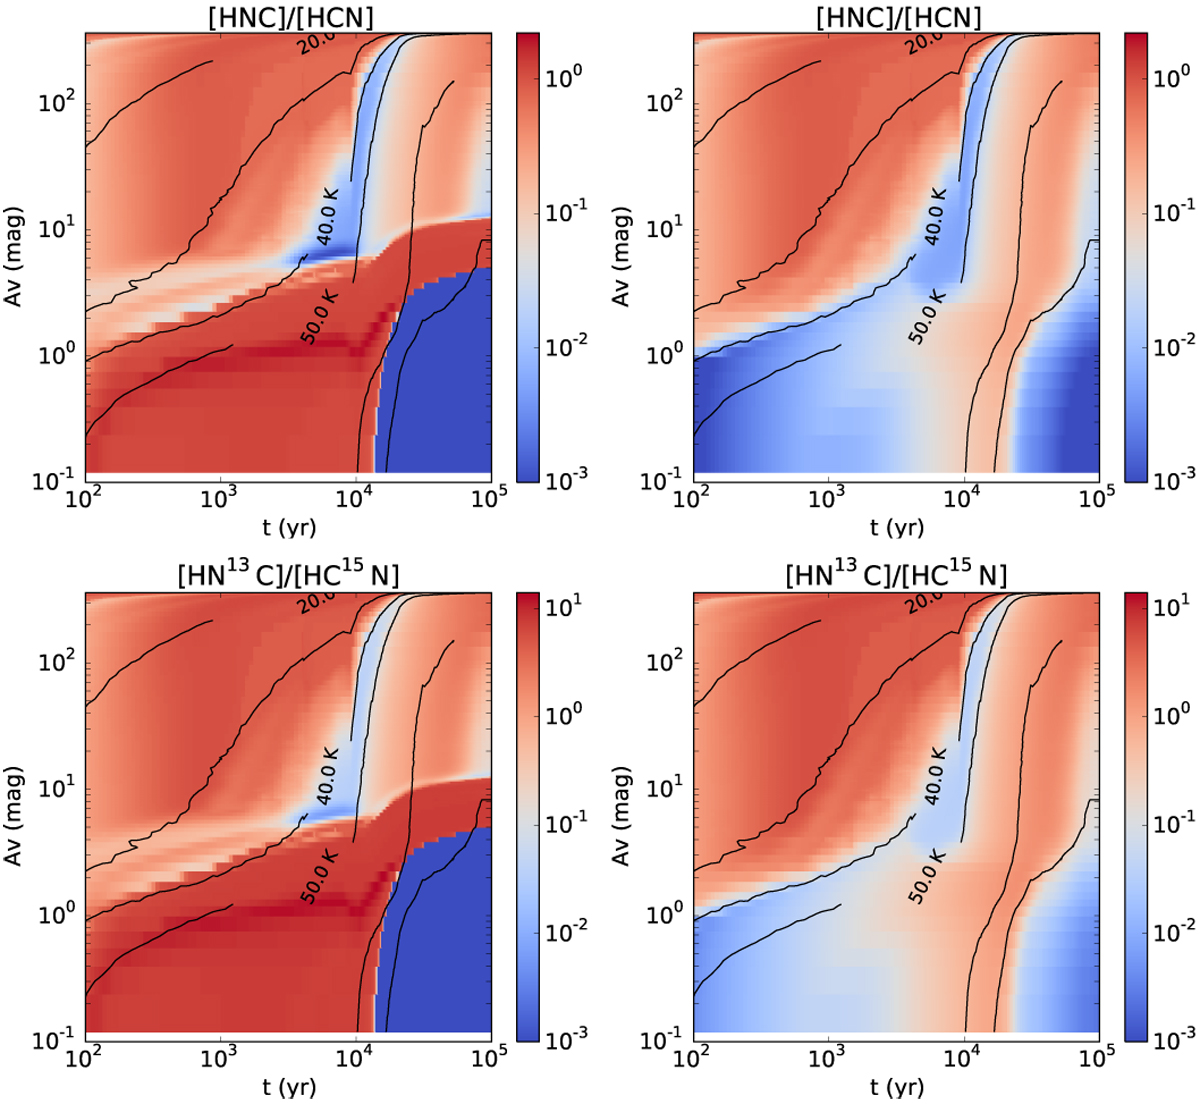
Spatio-temporal evolution, focused between 100 and 105 yr, of the abundance ratio [HNC]/[HCN] for the reference model mHII (left) and the corresponding mHHMC model (right). Contours are plotted for Td (20, 30, 40, 50, 100 and 150 K). The bottom panels show the same results for [HN13 C]/[HC15N].
Current usage metrics show cumulative count of Article Views (full-text article views including HTML views, PDF and ePub downloads, according to the available data) and Abstracts Views on Vision4Press platform.
Data correspond to usage on the plateform after 2015. The current usage metrics is available 48-96 hours after online publication and is updated daily on week days.
Initial download of the metrics may take a while.