Fig. 14
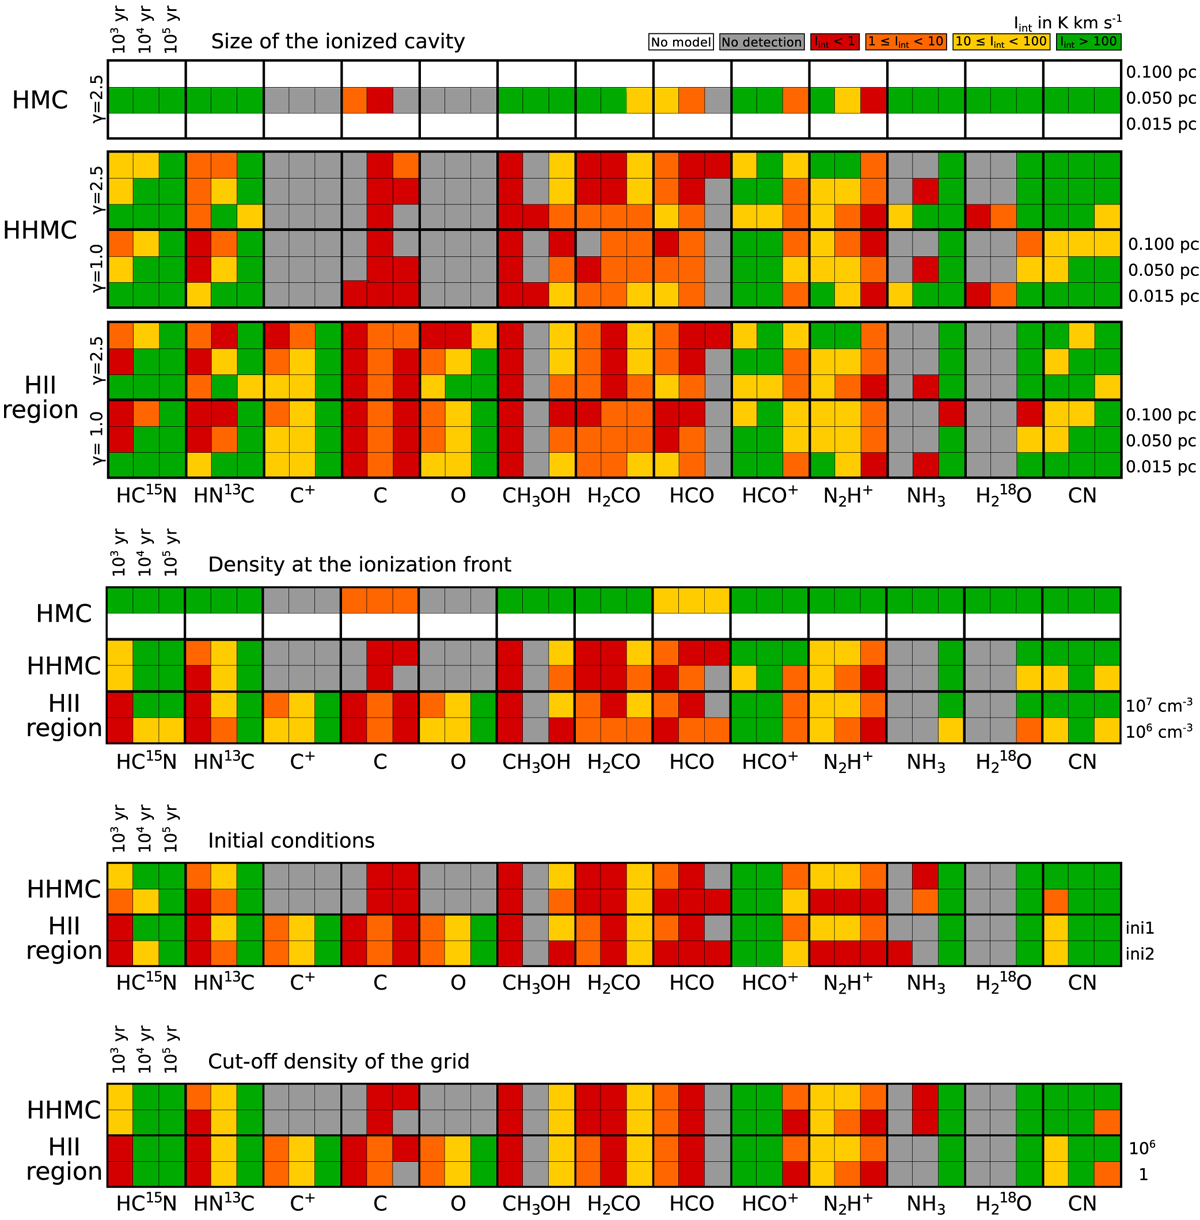
Schematic summarizing the results of the time evolution of the integrated intensities for the different models: size of the ionized cavity and density profile (top panel), density at the ionization front (second panel), initial abidances (third panel) and cut-off density (bottom panel). Lines with the integrated intensity Iint > 100 are represented in green, 10 < Iint < 100 in yellow, 1 < Iint < 10 in orange and Iint < 1 K km s−1 in red. Undetected lines, with integrated intensities lower than the detectability threshold of 5 × 10⁻² K km s−1, are represented in gray.
Current usage metrics show cumulative count of Article Views (full-text article views including HTML views, PDF and ePub downloads, according to the available data) and Abstracts Views on Vision4Press platform.
Data correspond to usage on the plateform after 2015. The current usage metrics is available 48-96 hours after online publication and is updated daily on week days.
Initial download of the metrics may take a while.