Free Access
Fig. 10
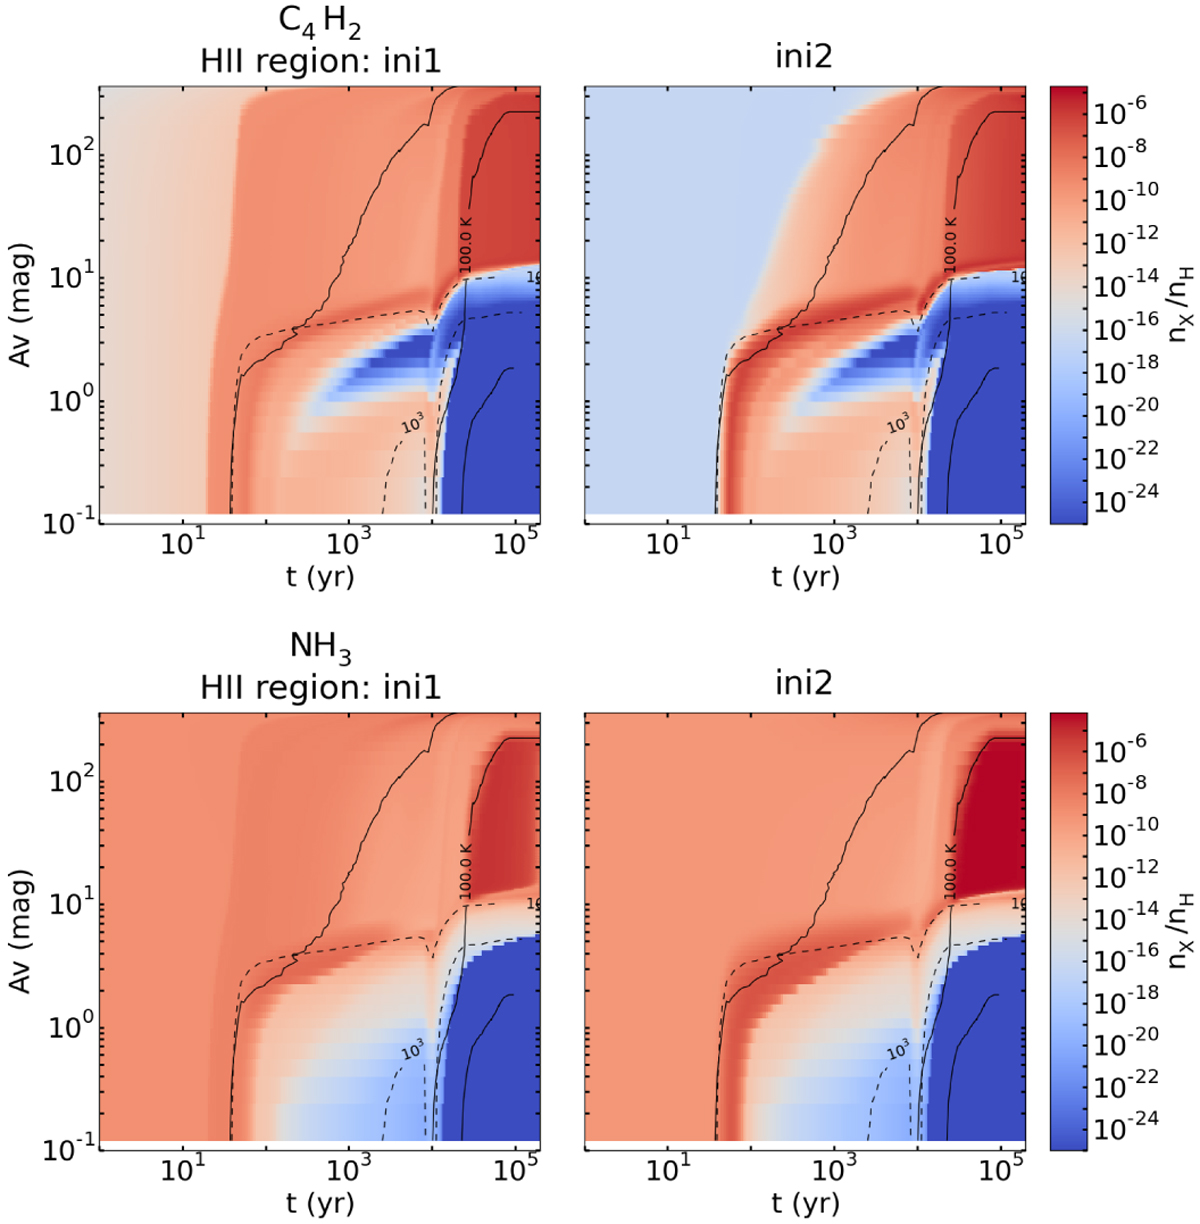
Spatio-temporal evolution of the abundance of C4H2 and NH3 for the reference model mHII:ini1 (left panel) and model mHII:ini2 (right panel). Contours are plotted: solid line for Td (20, 30, 100 and 150 K) and dashed lines for G (10−1 and 103 Draine unit).
Current usage metrics show cumulative count of Article Views (full-text article views including HTML views, PDF and ePub downloads, according to the available data) and Abstracts Views on Vision4Press platform.
Data correspond to usage on the plateform after 2015. The current usage metrics is available 48-96 hours after online publication and is updated daily on week days.
Initial download of the metrics may take a while.