| Issue |
A&A
Volume 616, August 2018
|
|
|---|---|---|
| Article Number | L6 | |
| Number of page(s) | 5 | |
| Section | Letters to the Editor | |
| DOI | https://doi.org/10.1051/0004-6361/201833629 | |
| Published online | 15 August 2018 | |
Letter to the Editor
Possible ~1 hour quasi-periodic oscillation in narrow-line Seyfert 1 galaxy MCG–06–30–15
1
Key Laboratory for Research in Galaxies and Cosmology, Shanghai Astronomical Observatory, Chinese Academy of Sciences, 80 Nandan Road, Shanghai 200030, PR China
e-mail: This email address is being protected from spambots. You need JavaScript enabled to view it.
2
Aryabhatta Research Institute of Observational Sciences (ARIES), Manora Peak, Nainital 263 001, India
3
Center for Field Theory and Particle Physics and Department of Physics, Fudan University, 220 Handan Road, Shanghai 200433, PR China
4
Department of Physics, The College of New Jersey, PO Box 7718, Ewing, NJ 08628-0718, USA
5
Theoretical Astrophysics, Eberhard-Karls-Universität Tübingen, 72076 Tübingen, Germany
6
Kavli Institute for Astronomy and Astrophysics, Peking University, Yi He Yuan Lu 5, Hai Dian District, Beijing 100871, PR China
7
Department of Astronomy, Peking University, Yi He Yuan Lu 5, Hai Dian District, Beijing 100871, PR China
Received:
13
June
2018
Accepted:
19
July
2018
Abstract
We found a possible ~1 h quasi-periodic oscillation (QPO) in a ~55 ks X-ray observation of the narrow-line Seyfert 1 galaxy MCG–06–30–15 made with the XMM-Newton EPIC/pn detector in the energy range 0.3–10 keV. We identify a total modulation of ~16% in the light curve and find a ≃3670 s quasi-period using Lomb-Scargle periodogram (LSP) and weighted wavelet Z-transform (WWZ) techniques. Our analyses of eight light curves of MCG–06–30–15, indicated the possible presence of an oscillation during one of them. The LSP indicates a statistically significant (≃3σ) QPO detection. A WWZ analysis shows that the signal at this possible roughly 3670 s period is present, and rather persistent, throughout the observation; however, a signal around 8735 s is more persistent. We briefly discuss models that can produce X-ray QPOs with such periods in narrow line Seyfert 1 galaxies, as both other claimed QPO detections in this class of AGN had very similar periods.
Key words: galaxies: active / galaxies: Seyfert
© ESO 2018
1. Introduction
Detections of quasi-periodic oscillations (QPOs) are very rare in active galactic nuclei (AGN), but are fairly common in both black hole (BH) and neutron star binaries in the Milky way and nearby galaxies (Remillard & McClintock 2006). Over the last decade there have been several claims of QPO detections on diverse timescales ranging from a few tens of minutes to hours to days and even years, using γ-ray, X-ray, optical and radio monitoring data of various classes of AGN (Gierliński et al. 2008; Espaillat et al. 2008; Gupta et al. 2009; Lachowicz et al. 2009; Lin et al. 2013; King et al. 2013; Fan et al. 2014; Sandrinelli et al. 2014, 2016a, b; Graham et al. 2015; Ackermann et al. 2015; Pan et al. 2016; Bhatta et al. 2016; Bhatta 2017; Li et al. 2017; Xiong et al. 2017; Zhang et al. 2017b, c, 2018; Hong et al. 2018; and references therein). Since any such QPOs are almost certainly transient, verification is difficult and claims are strengthened if more than one technique provides consistent results.
The first significant QPO reported for a narrow-line Seyfert 1 (NLSy1) galaxy was in a light curve of RE J1034+396 (Gierliński et al. 2008); this had a roughly 1 h timescale (3730 s) in the X-ray band and was found in XMM-Newton data. The second QPO detection in a NLSy1 galaxy was more recently made by Pan et al. (2016) in 1H 0707−495; it again had a period of ~1 h (3800 s) and was seen in a XMM-Newton observation. We report a third probable QPO detection in a NLSy1 for MCG–06–30–15 (z = 0.00775), once again using XMM-Newton data. MCG–06–30–15 is well known, particularly for its broad iron Kα line; this line that provides strong evidence for the presence of a supermassive black hole (SMBH; e.g., Tanaka et al. 1995), which is probably spinning rapidly (e.g., Iwasawa et al. 1996). Because its Hβ line width (FWHM: full width at half maxima) of 1933±82 km s−1 is <2000 km s−1 (Hu et al. 2016), this SMBH is classified as a NLSy1. Interestingly, the possible QPO we report on in this work also shows a period of ~1 h. Convincing detection and careful characterizations of additional QPOs in these and other NLSy1 galaxies may shed new light on the physical processes occurring in these sources and can yield information on their SMBH masses and spins (e.g., Abramowicz & Kluźniak 2001; Zhou et al. 2015; Pan et al. 2016).
The search for QPOs in light curves of AGN is very important: their presence can provide strong support for the common nature of the accretion process onto BHs ranging from a few solar masses up to the SMBHs present in quasars (e.g., Abramowicz & Kluźniak 2001; Remillard & McClintock 2006; Zhou et al. 2015). Plausible models that might explain QPOs in AGN in different wavebands and on diverse timescales have been put forward (e.g., Gierliński et al. 2008; Gupta et al. 2009; Lachowicz et al. 2009; Pan et al. 2016; Bhatta 2017; and references therein). However, only once we have at least a handful of good cases of QPOs in different subclasses of AGN and on diverse timescales will it be possible for us to gain a thorough understanding of this phenomenon.
In Sect. 2 of this Letter we briefly describe the X-ray data and how we reduced it. In Sect. 3 we present a description of the QPO search techniques we employed and the results of those analyses. A discussion and our conclusions are given in Sect. 4.
2. Data and reduction
We examined the eight archival XMM-Newton EPIC/pn observations of the NLSy1 galaxy MCG–06–30–15 that had high quality data and extended for at least 30 ks. In total, these exposures amounted to 747 ks. The observation of the greatest interest was taken on 2000 July 11–12 (Orbit 108, Observation ID 0111570201) and lasted 55 ks. Wilms et al. (2001) analyzed the spectrum of this particular observation combined with others taken on the same days. These authors concluded that the reflection continuum was extremely broad, supporting the claim that the SMBH is rotating rapidly.
For data reduction, we used the XMM-Newton Science Analysis Software (SAS), version 15.0.0. We limited our analysis to EPIC/pn data because it is free from both soft-proton flaring events and pile-up effects. The light curve in the energy range 0.3–10.0 keV was extracted using a 40 arcsec radius selection region and corrected for background flux by selecting a 45 arcsec radius region as far as possible from the source on the same CCD chip. Finally, the ~55 ks data were evenly sampled in time bins of 100 s. The mean count rate and rms variability were found to be 21.2 ct s−1 and 19.52 ± 0.12%, respectively.
3. Light curve analysis and results
The XMM-Newton EPIC/pn image of NLSy1 MCG–06–30–15 and a circle showing the 45 arcsec radius background region are shown in Fig. 1. The ~55 ks continuous light curve of NLSy1 MCG–06–30–15 in 0.3–10 keV is plotted in Fig. 2. By visual examination it appears that the X-ray emission during that period may include a quasi-periodic component. To examine and quantify this possibility we analyzed the data using recently employing the extensively used Lomb-Scargle periodogram (LSP), and weighted wavelet Z-transform (WWZ) analysis techniques. In the following subsections we briefly describe these techniques and the putative QPO periods they yield.
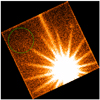 |
Fig. 1. XMM-Newton EPIC/pn image of the NLSy1 MCG–06–30–15 and the selected background region, denoted by a circle. |
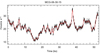 |
Fig. 2. Light curve of NLS1 MCG–06–30–15 in 0.3–10 keV observed with XMM-Newton EPIC/pn, with a running average over 5 points given by the continuous red curve. |
3.1. Lomb-Scargle periodogram
The LSP is a powerful technique used to analyze the periodicities in irregular time series (Lomb 1976; Scargle 1982), which employs χ2 statistics to fit sine waves throughout the data train. It reduces the effects of irregular sampling and indicates any periodicities or quasi-periods that may be present in the data and also provides their statistical significance. The significance of a certain signal is determined by the probability, p, of the null hypothesis, which can be calculated using the LSP (Hong et al. 2018; Zhang et al. 2017a, b, c). The LSP at a particular frequency ωi, given N observations, is defined as
 (1)
(1)
In this work i = 1 … M, where τ is calculated as
 (2)
(2)
and M is the number of independent frequencies. The significance of features of a periodogram can be assessed by testing the null hypothesis of no period being present, parameterized by its p-value known as false alarm probability (FAP). The p-value for the probability that the measured peak is smaller than y is given by
 (3)
(3)
where N is the number of data points. The smaller the p-value, the higher the significance of any peak.
In the top panel of Fig. 3, a periodogram power spectral density for MCG–6–30–15 is plotted against frequency using the LSP analysis and the horizontal lines represent p = 0.01 significance levels. The line with p = corresponds to a (1−α) × 100% confidence level. A peak of period 3600 ± 229 s is found to have greater than a 99% global significance, signaling a possible QPO. Another peak of 7300 ± 425 s signals the possible harmonic of the periodic oscillation detected by this method.
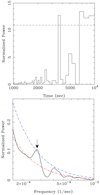 |
Fig. 3. Top panel: LSP of the light curve in Fig. 1. The dashed line represents p = 0.01. Bottom panel: results of REDFIT method. The black line represents the bias corrected spectra, the red line indicates the theoretical (AR1) red noise spectrum, and the blue line shows the 90% χ2 significance level. |
In general, the light curves of AGNs are mainly comprised of red noise that arises from stochastic processes in the accretion disk or jet and is frequency dependent (Fan et al. 2014; Xiong et al. 2017; Hong et al. 2018). In order to assess the red noise, we employed the REDFIT program which calculates the red noise present in the data by fitting it to the first order auto-regressive (AR1) process (Schulz & Mudelsee 2002). The bottom panel of Fig. 3 plots the REDFIT result, i.e., the spectra, theoretical red noise spectrum, and the 90% significance level. The peak at (2.7 ± 0.1) × 10−4 indicates the possible periodicity of 3670 s, which is also shown by LSP method.
3.2. Wavelet analysis
Sometimes (quasi-) periodic oscillations in a signal do not persist throughout the full dataset. This is possible if there are QPOs that evolve with time in their amplitudes and/or frequencies. The wavelet technique measures the non-stationarity of the time series by decomposing it into frequency/time space simultaneously (Torrence & Compo 1998). The WWZ is commonly used for quantifying periodicities in the time series and uses the z-statistics of Foster (1996). We employed WWZ software to calculate the WWZ power as a function of frequency and time (e.g., King et al. 2013; Bhatta et al. 2016; Bhatta 2017; Zhang et al. 2017b, c, 2018; and references therein). The color scaled density plot of WWZ is presented in Fig. 4. The figure features concentrations of WWZ power around periods of 3665, 5125, and 8736 s with errors of ~180 s for the first two and ~350 s for the last, indicating possible QPOs in the signal. The QPO with period around 3665 seconds gradually develops with moderate strength and is most clearly persistent though the second half of the observation. The same is true for a possible QPO around 5125 s but it is stronger at the beginning of the observation than the previous QPO. Another possible QPO, which has a period centered at 8736 s, on the other hand, is strongest and more persistent throughout the observation. The right-hand panel of Fig. 4 plots the time averaged WWZ against period and shows peaks at those three values.
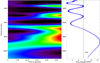 |
Fig. 4. Weighted wavelet Z-transform of the light curve presented in Fig. 1. Left panel: distribution of color-scaled WWZ power (with red most intense) in the time-period plane. Right panel: time-averaged WWZ power (blue curve) as a function of period. The dotted black curve represents 97% global significance. |
4. Discussion and conclusions
The quasi-periods obtained from the LSP and WWZ analyses, which search for the presence of sinusoidal components, agree to within the resolutions of these techniques. Together, they indicate that during this particular observation the NLSy1 MCG–06–30–15 exhibited a QPO at a frequency of ≃2.73 × 10⁻⁴ Hz, or at a central period of ≃3670 s. The LSP approach is the most common frequency-based technique and can provide good estimates of the strength of a signal if the underlying power spectrum can be sensibly modeled, but it does not take into account any possible evolution of a periodic or quasi-periodic signal with time. The time-frequency approach using wavelets has the advantage of quantifying the persistence of such signals in the data.
Because we found no indication of a QPO in the other seven extensive light curves for this source that we examined, one may consider that the formal statistical confidence in any long-lived QPO is reduced to ~90%. However, we believe that it is more appropriate to interpret this result as being consistent with the general finding that detectable QPOs from AGN are not longlived, but rather are transient in nature (Gierliński et al. 2008; Pan et al. 2016), and thus this object may have a QPO duty cycle of ~12%. We note that our signal appears to be present throughout the full observation of MCG–06–30–15; this is in contrast to the QPOs detected in the other two NLSy1s, RE J1034+396 (Gierliński et al. 2008; Czerny et al. 2010) and 1H 0707−495 (Pan et al. 2016), in which the QPOs were only significant in portions of the data trains.
Recently the SMBH in MCG–06–30–15 has had its mass estimated in two independent direct ways using the reverberation mapping technique for the Hβ line. Hu et al. (2016) found a preferred value of  but Bentz et al. (2016) obtained 1.6 ± 0.4 × 10⁶M⊙ using different reverberation campaigns and somewhat different analysis techniques. The time lags these two groups measure at multiple epochs are reasonably consistent, at 6.38 d and 5.33 d, respectively, as are their values of the Hβ FWHM, but Hu et al. (2016) used the FWHM and Bentz et al. 2016 used the dispersion, σ. These choices, along with different choices for the value of the scaling factor that accounts for the kinematics and geometry of the broad-line region gas, produce the differences in their best mass values. These values, nevertheless, are still consistent within the errors. These papers estimated Eddington ratios of ~0.12 (Hu et al. 2016) and ~0.04 (Bentz et al. 2016), which are substantial, but lower than that for most NLSy1s (Hu et al. 2016). Most of the peculiar properties of NLSy1s can be understood if they are Seyferts with relatively low SMBH masses that are accreting at relatively high rates.
High-frequency QPOs (HFQPOs) for BH X-ray binaries are in the range 40–450 Hz and because their frequencies are constant despite large changes in luminosity it has been thought that they are related to the innermost portions of the accretion disks and hence may provide measures of the masses and spins of their BHs (e.g., Abramowicz & Kluźniak 2001; Abramowicz et al. 2004; Remillard & McClintock 2006). A plot of HFQPO frequencies against BH mass produces the expected tight inverse relationship for stellar mass BHs and this has recently been extended from Galactic BH QPOs through possible intermediate mass BHs up to SMBHs (Zhou et al. 2015; Pan et al. 2016, and references therein). The frequency of this probable QPO in MCG–06–30–15 is nearly identical to those found in RE J1034+396 and 1H 0707−495 at ≃2.7 × 10⁻⁴ Hz. The best mass estimates of this QPO, at  or 1.6 ± 0.4 × 10⁶M⊙, are also very close to the others, which are
  for RE J1034+396 (Zhou et al. 2010) and (5.2 ± 0.5 dex) × 106M⊙ for 1H 0707−495 (Pan et al. 2016). Hence, our new measurement appears to help confirm the inverse linear dependence of QPO frequency and BH mass and would lie right next to the other AGN points on Fig. 4 of Pan et al. (2016).
This tight bunching of frequencies (and SMBH masses) for AGN QPOs may seem surprising but selection effects probably strongly favor QPO frequencies and SMBH masses relation. The higher the SMBH mass the longer the expected possible QPO period and the longer any observation would need to be to have a chance of detecting a QPO. Of course only Type 1 AGN afford us the opportunity of seeing the region close to the BH from which QPOs emerge. Those BHs are likely to be several times more massive in normal Sy1s than in the NLSy1s in which QPOs have been seen. Most QSOs have much more massive SMBHs, and while they are also much more luminous, they are also much further away. Therefore count rates are no greater and the required continuous observation times needed to perform good QPO searches on much longer timescales are essentially impossible to obtain.
The presence of 3:2 ratios for the frequencies of many HFQPOs in X-ray binaries indicates that the physical mechanism producing these HFQPOs involves a resonance phenomenon of some sort (e.g., Abramowicz & Kluźniak 2001) and the scaled similarity between those stellar mass systems and these NLSy1 AGNs supports the idea that resonances are important for AGNs as well. Although no pairs of QPOs at that 3:2 ratio (or any other, for that matter) have yet been detected for any AGN and the discovery of such would be extraordinarily important, the resonance hypothesis certainly is reasonable. An estimated Eddington ratio of 0.12 is significantly higher than that of the great majority of AGN. This large Eddington ratio and the likelihood that this is another HFQPO supports the claim by Pan et al. (2016) that HFQPOs are associated with BHs accreting at very high rates as is the case for BH X-ray binaries. If a high accretion rate is indeed a prerequisite for engendering a HFQPO and the few detected in AGNs are indeed of the same type as in X-ray binaries, then many otherwise viable models (e.g., review by Belloni & Stella 2014) are disfavored (Pan et al. 2016). A wavelet analysis of the apparent variations of the QPO frequency for the NLS1 RE J1034+396 by Czerny et al. (2010) indicated that an increase in QPO frequency was accompanied by an increase in X-ray flux. The wavelet approach to the current observation of MCG–06–30–15 does not provide additional evidence for such a trend, as the QPO frequency around 3670 s appears to be very stable. According to Pan et al. (2016), only models invoking p-modes trapped in the innermost part of an accretion disk (e.g., Li et al. 2003; Horák & Lai 2013, and references therein) or those involving magnetized disks subject to accretion-ejection instabilities (Tagger & Pellat 1999) naturally tie HFQPOs to high accretion rate situations.
Acknowledgments
We thank the anonymous referee for constructive comments and suggestions. ACG thanks Prof. D. Banerjee for providing a computer code for wavelet analysis. ACG is partially supported by the CAS President’s International Fellowship Initiative (PIFI), Grant No. 2016VMB073. AT acknowledges support from the China Scholarship Council (CSC), Grant No. 2016GXZR89. PJW is grateful for hospitality at SHAO while this paper was written. MFG is supported by the National Science Foundation of China (Grant Nos. 11473054 and U1531245) and by the Science and Technology Commission of Shanghai Municipality (Grant No. 14ZR1447100). CB was supported by the National Natural Science Foundation of China (Grant No. U1531117), Fudan University (Grant No. IDH1512060), and the Alexander von Humboldt Foundation. LCH was supported by the National Key R&D Program of China (2016YFA0400702) and the National Science Foundation of China (11473002, 11721303). This research is based on observations obtained with XMM-Newton, an ESA science mission with instruments and contributions directly funded by ESA Member States and NASA. WWZ software is available at URL: https://www.aavso.org/software-directory
References
- Abramowicz, M. A., & Kluźniak, W. 2001, A&A, 374, L19 [NASA ADS] [CrossRef] [EDP Sciences] [Google Scholar]
- Abramowicz, M. A., Kluźniak, W., McClintock, J. E., & Remillard, R. A. 2004, ApJ, 609, L63 [NASA ADS] [CrossRef] [Google Scholar]
- Ackermann, M., Ajello, M., Albert, A., et al. 2015, ApJ, 813, L41 [NASA ADS] [CrossRef] [Google Scholar]
- Belloni, T. M., & Stella, L. 2014, Space Sci. Rev., 183, 43 [NASA ADS] [CrossRef] [Google Scholar]
- Bentz, M. C., Cackett, E. M., Crenshaw, D. M., et al. 2016, ApJ, 830, 136 [NASA ADS] [CrossRef] [Google Scholar]
- Bhatta, G. 2017, ApJ, 847, 7 [NASA ADS] [CrossRef] [Google Scholar]
- Bhatta, G., Zola, S., Stawarz, Ł., et al. 2016, ApJ, 832, 47 [NASA ADS] [CrossRef] [Google Scholar]
- Czerny, B., Lachowicz, P., Doviak, M., & Karas, V. 2010, A&A, 524, A26 [NASA ADS] [CrossRef] [EDP Sciences] [Google Scholar]
- Espaillat, C., Bregman, J., Hughes, P., & Lloyd-Davies, E. 2008, ApJ, 679, 182 [NASA ADS] [CrossRef] [Google Scholar]
- Fan, J. H., Kurtanidze, O., Liu, Y., et al. 2014, ApJS, 213, 26 [NASA ADS] [CrossRef] [Google Scholar]
- Foster, G. 1996, AJ, 112, 1709 [NASA ADS] [CrossRef] [Google Scholar]
- Gierliński, M., Middleton, M., Ward, M., & Done, C. 2008, Nature, 455, 369 [NASA ADS] [CrossRef] [PubMed] [Google Scholar]
- Graham, M. J., Djorgovski, S. G., Stern, D., et al. 2015, Nature, 518, 74 [NASA ADS] [CrossRef] [Google Scholar]
- Gupta, A. C., Srivastava, A. K., & Wiita, P. J. 2009, ApJ, 690, 216 [NASA ADS] [CrossRef] [Google Scholar]
- Hong, S., Xiong, D., & Bai, J. 2018, AJ, 155, 31 [NASA ADS] [CrossRef] [Google Scholar]
- Horák, J., & Lai, D. 2013, MNRAS, 434, 2761 [NASA ADS] [CrossRef] [Google Scholar]
- Hu, C., Wang, J.-M., Ho, L. C., et al. 2016, ApJ, 832, 197 [NASA ADS] [CrossRef] [Google Scholar]
- Iwasawa, K., Fabian, A. C., Reynolds, C. S., et al. 1996, MNRAS, 282, 1038 [NASA ADS] [CrossRef] [Google Scholar]
- King, O. G., Hovatta, T., Max-Moerbeck, W., et al. 2013, MNRAS, 436, L114 [NASA ADS] [CrossRef] [Google Scholar]
- Lachowicz, P., Gupta, A. C., Gaur, H., & Wiita, P. J. 2009, A&A, 506, L17 [NASA ADS] [CrossRef] [EDP Sciences] [Google Scholar]
- Li, L.-X., Goodman, J., & Narayan, R. 2003, ApJ, 593, 980 [NASA ADS] [CrossRef] [Google Scholar]
- Li, X.-P., Luo, Y.-H., Yang, H.-Y., et al. 2017, ApJ, 847, 8 [NASA ADS] [CrossRef] [Google Scholar]
- Lin, D., Irwin, J. A., Godet, O., Webb, N. A., & Barret, D. 2013, ApJ, 776, L10 [NASA ADS] [CrossRef] [Google Scholar]
- Lomb, N. R. 1976, Ap&SS, 39, 447 [NASA ADS] [CrossRef] [Google Scholar]
- Pan, H.-W., Yuan, W., Yao, S., et al. 2016, ApJ, 819, L19 [NASA ADS] [CrossRef] [Google Scholar]
- Remillard, R. A., & McClintock, J. E. 2006, ARA&A, 44, 49 [NASA ADS] [CrossRef] [Google Scholar]
- Sandrinelli, A., Covino, S., & Treves, A. 2014, ApJ, 793, L1 [NASA ADS] [CrossRef] [Google Scholar]
- Sandrinelli, A., Covino, S., Dotti, M., & Treves, A. 2016a, AJ, 151, 54 [NASA ADS] [CrossRef] [Google Scholar]
- Sandrinelli, A., Covino, S., & Treves, A. 2016b, ApJ, 820, 20 [NASA ADS] [CrossRef] [Google Scholar]
- Scargle, J. D. 1982, ApJ, 263, 835 [NASA ADS] [CrossRef] [Google Scholar]
- Schulz, M., & Mudelsee, M. 2002, Comput. Geosci., 28, 421 [NASA ADS] [CrossRef] [Google Scholar]
- Tagger, M., & Pellat, R. 1999, A&A, 349, 1003 [NASA ADS] [Google Scholar]
- Tanaka, Y., Nandra, K., Fabian, A. C., et al. 1995, Nature, 375, 659 [NASA ADS] [CrossRef] [Google Scholar]
- Torrence, C., & Compo, G. P. 1998, Bull. Am. Meteorol. Soc., 79, 61 [Google Scholar]
- Wilms, J., Reynolds, C. S., Begelman, M. C., et al. 2001, MNRAS, 328, L27 [NASA ADS] [CrossRef] [Google Scholar]
- Xiong, D., Bai, J., Zhang, H., et al. 2017, ApJS, 229, 21 [NASA ADS] [CrossRef] [Google Scholar]
- Zhang, J., Zhang, H.-M., Zhu, Y.-K., et al. 2017a, ApJ, 849, 42 [NASA ADS] [CrossRef] [Google Scholar]
- Zhang, P.-F., Yan, D.-H., Liao, N.-H., & Wang, J.-C. 2017b, ApJ, 835, 260 [NASA ADS] [CrossRef] [Google Scholar]
- Zhang, P.-F., Yan, D.-H., Liao, N.-H., et al. 2017c, ApJ, 842, 10 [NASA ADS] [CrossRef] [Google Scholar]
- Zhang, P.-F., Zhang, P., Liao, N.-H., et al. 2018, ApJ, 853, 193 [NASA ADS] [CrossRef] [Google Scholar]
- Zhou, X.-L., Zhang, S.-N., Wang, D.-X., & Zhu, L. 2010, ApJ, 710, 16 [NASA ADS] [CrossRef] [Google Scholar]
- Zhou, X.-L., Yuan, W., Pan, H.-W., & Liu, Z. 2015, ApJ, 798, L5 [NASA ADS] [CrossRef] [Google Scholar]
All Figures
|
Fig. 1. XMM-Newton EPIC/pn image of the NLSy1 MCG–06–30–15 and the selected background region, denoted by a circle. |
| In the text | |
|
Fig. 2. Light curve of NLS1 MCG–06–30–15 in 0.3–10 keV observed with XMM-Newton EPIC/pn, with a running average over 5 points given by the continuous red curve. |
| In the text | |
|
Fig. 3. Top panel: LSP of the light curve in Fig. 1. The dashed line represents p = 0.01. Bottom panel: results of REDFIT method. The black line represents the bias corrected spectra, the red line indicates the theoretical (AR1) red noise spectrum, and the blue line shows the 90% χ2 significance level. |
| In the text | |
|
Fig. 4. Weighted wavelet Z-transform of the light curve presented in Fig. 1. Left panel: distribution of color-scaled WWZ power (with red most intense) in the time-period plane. Right panel: time-averaged WWZ power (blue curve) as a function of period. The dotted black curve represents 97% global significance. |
| In the text | |
Current usage metrics show cumulative count of Article Views (full-text article views including HTML views, PDF and ePub downloads, according to the available data) and Abstracts Views on Vision4Press platform.
Data correspond to usage on the plateform after 2015. The current usage metrics is available 48-96 hours after online publication and is updated daily on week days.
Initial download of the metrics may take a while.