Free Access
Fig. 3.
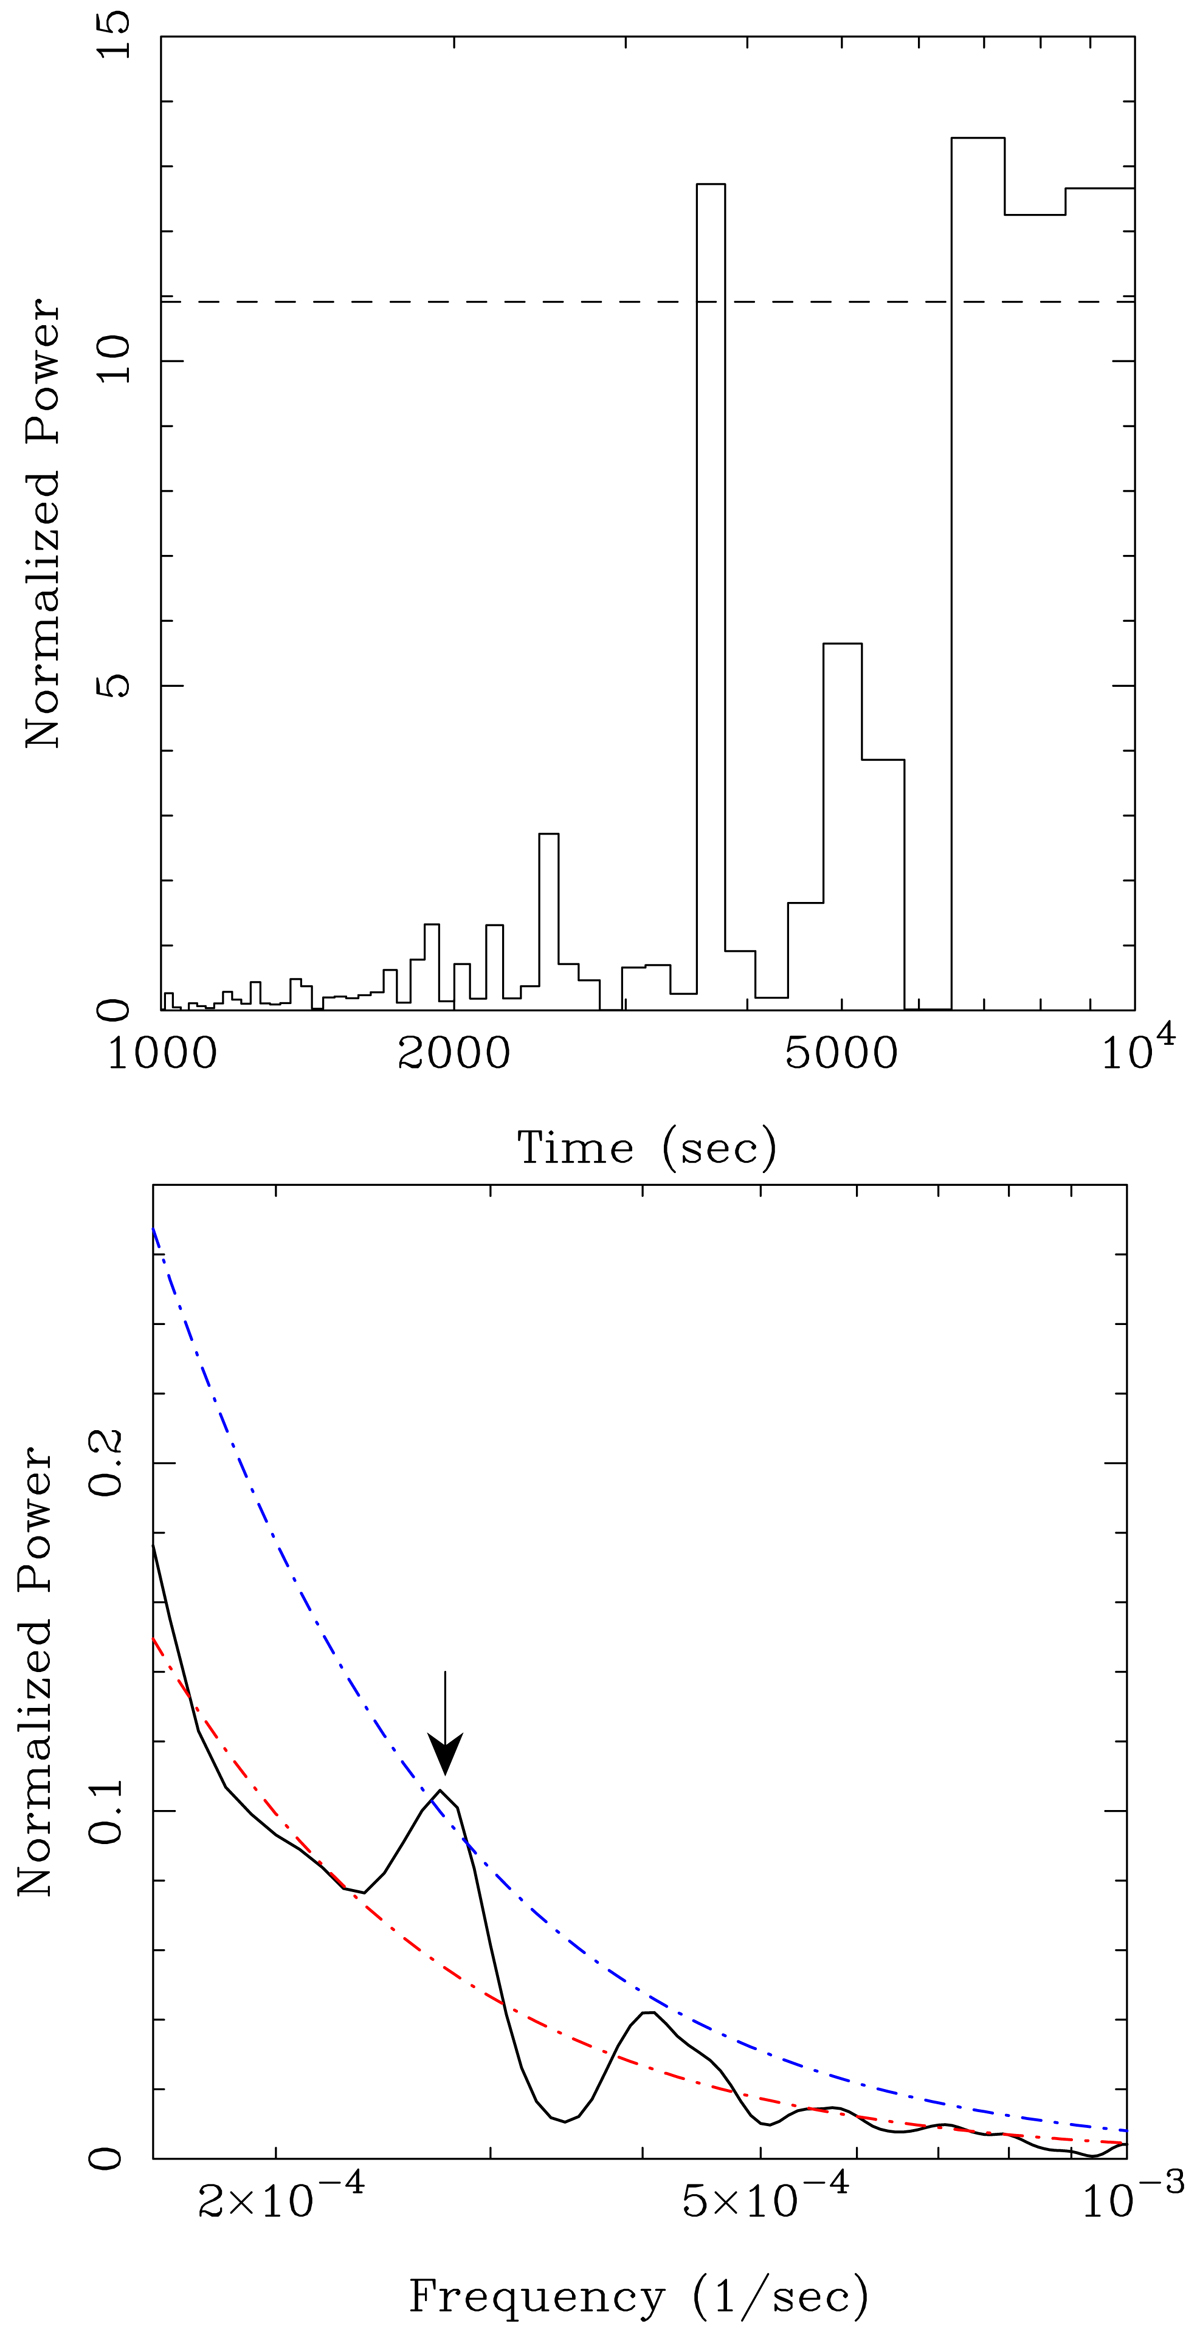
Top panel: LSP of the light curve in Fig. 1. The dashed line represents p = 0.01. Bottom panel: results of REDFIT method. The black line represents the bias corrected spectra, the red line indicates the theoretical (AR1) red noise spectrum, and the blue line shows the 90% χ2 significance level.
Current usage metrics show cumulative count of Article Views (full-text article views including HTML views, PDF and ePub downloads, according to the available data) and Abstracts Views on Vision4Press platform.
Data correspond to usage on the plateform after 2015. The current usage metrics is available 48-96 hours after online publication and is updated daily on week days.
Initial download of the metrics may take a while.