Free Access
Fig. 4.
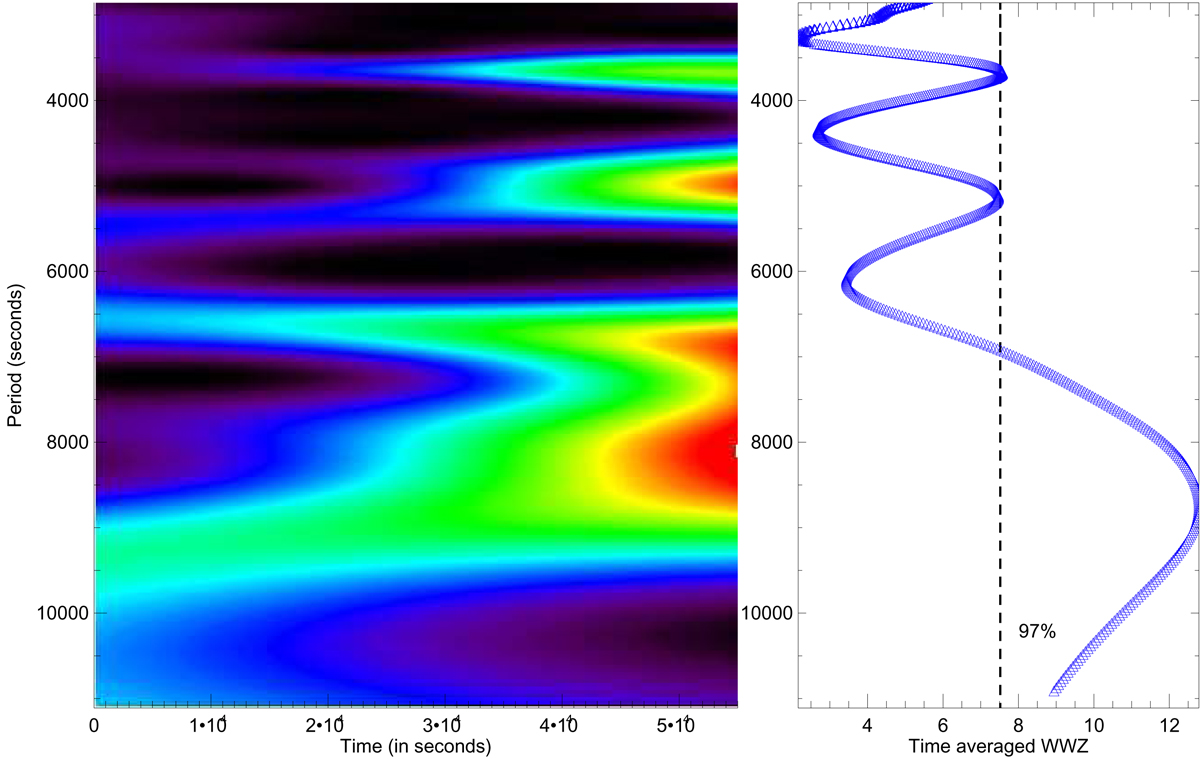
Weighted wavelet Z-transform of the light curve presented in Fig. 1. Left panel: distribution of color-scaled WWZ power (with red most intense) in the time-period plane. Right panel: time-averaged WWZ power (blue curve) as a function of period. The dotted black curve represents 97% global significance.
Current usage metrics show cumulative count of Article Views (full-text article views including HTML views, PDF and ePub downloads, according to the available data) and Abstracts Views on Vision4Press platform.
Data correspond to usage on the plateform after 2015. The current usage metrics is available 48-96 hours after online publication and is updated daily on week days.
Initial download of the metrics may take a while.