| Issue |
A&A
Volume 616, August 2018
|
|
|---|---|---|
| Article Number | A73 | |
| Number of page(s) | 9 | |
| Section | Stellar atmospheres | |
| DOI | https://doi.org/10.1051/0004-6361/201833200 | |
| Published online | 20 August 2018 | |
The hot white dwarf in the peculiar binary nucleus of the planetary nebula EGB 6★
1
Institute for Astronomy and Astrophysics, Kepler Center for Astro and Particle Physics, Eberhard Karls University,
Sand 1,
72076
Tübingen,
Germany
e-mail: This email address is being protected from spambots. You need JavaScript enabled to view it.
2
NASA Goddard Space Flight Center,
Greenbelt,
MD
20771,
USA
Received:
10
April
2018
Accepted:
14
May
2018
Abstract
EGB 6 is an extended, faint old planetary nebula (PN) with an enigmatic nucleus. The central star (PG 0950+139) is a hot DAOZ-type white dwarf (WD). An unresolved, compact emission knot was discovered to be located 0.′′166 away from the WD and it was shown to be centered around a dust-enshrouded low-luminosity star. It was argued that the dust disk and evaporated gas (photoionized by the hot WD) around the companion are remnants of a disk formed by wind material captured from the WD progenitor when it was an asymptotic giant branch (AGB) star. In this paper, we assess the hot WD to determine its atmospheric and stellar parameters. We performed a model-atmosphere analysis of ultraviolet (UV) and optical spectra. We found Teff = 105 000 ± 5000 K, log g = 7.4 ± 0.4, and a solar helium abundance (He = 0.25 ± 0.1, mass fraction). We measured the abundances of ten more species (C, N, O, F, Si, P, S, Ar, Fe, Ni) and found essentially solar abundance values, indicating that radiation-driven wind mass-loss, with a theoretical rate of log(Ṁ/M⊙/yr) = −11.0−0.8+1.1, prevents the gravitational separation of elements in the photosphere. The WD has a mass of M/M⊙ = 0.58−0.04+0.12 and its post-AGB age (log(tevol/yr = 360−0.09+1.26)) is compatible with the PN kinematical age of log(tPN/yr = 4.2). In addition, we examined the UV spectrum of the hot nucleus of a similar object with a compact emission region, Tol 26 (PN G298.0+34.8), and found that it is a slightly cooler DAOZ WD (Teff ≈ 85 000 K), but this WD shows signatures of gravitational settling of heavy elements.
Key words: planetary nebulae: general / stars: abundances / stars: atmospheres / stars: AGB and post-AGB / white dwarfs
Based on observations made with the NASA-CNES-CSA Far Ultraviolet Spectroscopic Explorer and the NASA/ESA Hubble Space Telescope, obtained at the Space Telescope Science Institute, which is operated by the Association of Universities for Research in Astronomy, Inc., under NASA contract NAS5-26666.
© ESO 2018
1 Introduction
EGB 6 (PN G221.5+46.3) is a faint old planetary nebula (PN) with a mysterious nucleus. The PN was discovered by Ellis et al. (1984) and has an angular extension of 11′ × 13′. At a nominal distance of ≈ 725 pc, the linear diameter of the PN is ≈1 pc. The central star (PG 0950+139) is a very hot white dwarf (WD) that was independently discovered by Ellis et al. (1984) and the Palomar Green (PG) survey (Green et al. 1986). Bright nebula emission lines superposed on the WD spectra were shown not to stem from the old, low-surface brightness PN, but from a relatively dense (ne = 2.2 × 106 cm−3; Dopita & Liebert 1989), unresolved compact emission knot (CEK) that was thought to be centered on the WD. An infrared excess was discovered by Zuckerman et al. (1991) and attributed to the presence of an M-type stellar companion. It came as a big surprise when imaging and grism spectroscopy obtained with the Hubble Space Telescope (HST) revealed that the CEK is a point-like source at the location of the companion, 0.′′166 away from the WD (Liebert et al. 2013), corresponding to a projected linear separation of ≈118 AU. The origin of the material making up the CEK is unknown. It was suggested that it is the remnant of a disk containing material captured by the companion star from the WD progenitor’s wind during its asymptotic giant branch (AGB) stage, and that this disk is surrounded by gas (the CEK) photoionized by the hot WD. The nature of the companion is in fact unknown because it is enshrouded by dust (Bond et al. 2016). It must be a low-luminosity object, a dM star or even another WD. For a detailed summary of our current knowledge about this system, we refer to the exhaustive paper by Bond et al. (2016) and references therein.
In the present paper, we investigate in detail the hot central star of EGB 6. It was classified as a hot DA white dwarf by Fleming et al. (1986). Later on, by the detection of ionized helium, Liebert et al. (1989) established the star as a DAO white dwarf, and after the detection of metal lines in the ultraviolet (Gianninas et al. 2010) the star was assigned to the DAOZ class.
The analysis of the optical spectrum of the WD is hampered by strong emission lines from the CEK. Using pure-hydrogen local thermodynamic equilibrium (LTE) model atmospheres, Liebert et al. (1989) derived Teff = 70 000 ± 7000 K and log g = 7.5 ± 0.25 from a fit to the Hγ line only. From new observations, and with pure hydrogen non-LTE models for Balmer line fits, Liebert et al. (2005) found Teff = 108 390 ± 16 687 K and log g = 7.39 ± 0.38.
Using non-LTE model atmospheres, Gianninas et al. (2010) derived Teff = 93 230 ± 20 425 K and log g = 7.36 ± 0.79, emphasizingincreased uncertainties in the measured parameters due to the exclusion of the Balmer line cores from the fitting procedure. For the first time, they measured the helium abundance (He/H = 0.1 , by mass) which, at face value, is lower than the solar abundance (He/H = 0.34), but highly uncertain. In their hydrogen plus helium models, in order to compute a more realistic atmospheric structure, they included the elements C, N, and O in solar amounts, as prescribed by the analysis of Werner (1996), who outlined the solution to the Balmer line problem. This measure was motivated by the fact that they identified metal lines in Far Ultraviolet Spectroscopic Explorer (FUSE) spectra; however, abundance determinations were not performed.
Here, we present a new spectral analysis of the WD. Our primary aim was to determine the metal abundances from the ultraviolet (UV) spectra taken with FUSE and to improve the measurement of Teff, log g, and He abundance employing, in addition, previously unused optical spectra. It was expected that the results would contribute one piece to resolve the puzzle of this extraordinary PN nucleus1.
It has been claimed that EGB 6 is the prototype of a small class of PNe with central compact emission regions (Frew & Parker 2010). Related to them could be Tol 26 (PN G298.0+34.8; Hawley 1981), whose central star was hitherto unexplored. From the nebula analysis, Teff > 50 000 K was concluded. Here we present the investigation of an archival UV spectrum obtained with the Cosmic Origins Spectrograph (COS) aboard HST, to check for the possible similarity between the hot central stars of EGB 6 and Tol 26.
2 Observations
For our analysis of EGB 6, we use UV spectra which were observed with the International Ultraviolet Explorer (IUE), HST, and FUSE. Optical spectra were obtained by the SloanDigital Sky Survey (SDSS) and the Supernovae Type Ia Progenitor Survey (SPY; Napiwotzki et al. 2003). For Tol 26, we used the HST/COS spectrum.
2.1 Ultraviolet spectra
EGB 6 was observed by FUSE twice in 2000 and we retrieved the spectra from the MAST archive. The first observation (A0340101) had imprecise target coordinates, so the star was on the edge of the slit in two channels and completely missed the other two. The second observation (A0341101) was good in all channels, so we scaled the usable data from the first observation to match the second. The reduction procedure was the same as that described in Werner et al. (2016). The resulting spectrum is shown in Fig. 1. The resolving power is about 20 000. We smoothed the spectrum by a 0.05 Å wide boxcar and, accordingly, our synthetic spectra were convolved with a Gaussian with FWHM = 0.07Å.
The hydrogen Lyman lines are blended with the respective He II line series. From the latter, three isolated lines are visible, with decreasing strength, at 1085, 992, and 959 Å (transitions between levels with principal quantum numbers n = 2 → 5, 6, 7). The FUSE spectrum was published by Gianninas et al. (2010) and photospheric lines of seven metals were identified (C, N, O, Si, P, S, Fe); however, it was not subject to a quantitative analysis. We identified many more lines of these elements plus three more species (F, Ar, and Ni; see Sect. 3.2).
The FUSE observations exhibit many absorption lines of the ISM. To unambiguously identify stellar lines, we employed the program OWENS (Lemoine et al. 2002; Hébrard et al. 2002; Hébrard & Moos 2003). It has the capacity to consider several, individual ISM clouds with their own radial and turbulent velocity, temperature, chemical composition, and respective column densities. We identified and modeled lines of H I, D I, H2 (J = 0–4), HD (J = 0), C II-III, C II*, N I–III, O I, Si II, P II, S III, Ar I, and Fe II.
The star was observed in 1993 with the Faint Object Spectrograph (FOS) aboard HST. Two spectra were taken with gratings G160L (1150–2500 Å, resolution ≈7 Å) and G270H (2220–3300 Å, resolution ≈2 Å). Because of the low resolution of the G160L spectrum, even the strongest spectral lines predicted by our models (He II λ1640, C IV λ1550, N V λ1240, O V λ1371) are not detected beyond doubt. In the G270H spectrum, three members of the He II Fowler series can be seen (n = 3 → 5, 6, 7).
Three observations during 1987–1989 were performed with IUE (SWP camera, resolution 5 Å). The co-added spectrum was taken from the database created by Holberg et al. (2003). Its flux level matches the HST/FOS data. At best, He II λ1640 and C IV λ1550 are barely detectable.
The UV spectra up to λ = 1770Å are shown in Fig. 2. We fit the continuum shape with our final photospheric model assuming interstellar reddening E(B − V) = 0.025 ± 0.005, in good agreement with the value derived by Bond et al. (2016; E(B − V) = 0.02) and confirming the conclusion that the hot central star suffers no reddening within the system because the total reddening in the direction of EGB 6 is about E(B − V) = 0.027 (Schlafly & Finkbeiner 2011). From the Lyman lines, we derive an interstellar neutral hydrogen column density of log (nH∕cm2) = 20.3 ± 0.4. This mainly follows from fitting the Lyα profile because only for this line is the equivalent width dominated by the interstellar medium (ISM) and not by the photospheric contribution.
A HST/COS spectrum of the central star of Tol 26 was recorded in 2014 with grating G140L. It has a useful wavelength range of ≈1160–2000 Å and a spectral resolution of ≈0.6 Å. It is discussed in detail in Sect. 3.4. The spectrum was smoothed with a 0.1 Å wide boxcar and the models were folded with 0.6 Å Gaussians.
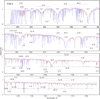 |
Fig. 1 FUSE spectrum of the white dwarf in EGB 6 (gray) compared to a photospheric model spectrum (red; Teff = 105 000 K, log g = 7.4) withthe adopted parameters (see Table 1). The same model attenuated by interstellar lines is plotted in blue. Prominent photospheric lines are identified. |
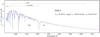 |
Fig. 2 FUSEspectrum (gray) and HST/FOS spectrum (red) of the white dwarf in EGB 6 compared to a photospheric model spectrum (blue; Teff = 105 000 K, log g = 7.4) with the adopted parameters (see Table 1). A reddening of E(B− V) = 0.025 was appliedto the model to fit the observed continuum shape. The model is attenuated by interstellar Lyman line absorption (column density nH = 2 × 1020 cm−2). The black dashed line is the unattenuated model. For clarity, the FUSE spectrum and the models in the respective wavelength range were smoothed with a Gaussian with 1 Å FWHM. The model in the HST/FOS range was convolved with a 7 Å Gaussian. |
2.2 Optical spectra
The archival SDSS spectrum of the EGB 6 nucleus covers the wavelength range 3600–10 300 Å with a resolution of ≈2.5 Å. The spectrum is a co-addition of four single observations. We rectified it for our fitting with normalized synthetic line profiles (Fig. 3). The only photospheric lines that can be identified are from H and He II. The cores of the Balmer lines and He II λ4686 (and perhaps also He II λ5412) are contaminated with emission lines from the CEK around the companion (Liebert et al. 2013), hampering the determination of atmosphericparameters.
To mitigate this problem, we used SPY spectra, which have a higher resolution (≈0.1 Å), allowing us to trace the photospheric line profiles closer toward the line core, because the nebular emission lines are rather narrow. However, the signal-to-noise ratio (S/N) of these spectra is relatively poor. In total, three SPY spectra (each consisting of three segments covering the ranges 3400–4520 Å, 4620–5600 Å, and 5680–6640 Å) were used and rectified. We abandoned co-addition because of the very different S/N of the single spectra in different wavelength regions. In the SPY spectra, too, no metal lines are detectable.
The He II λ3203 line, coveredby the HST/FOS G270H spectrum, is obviously not affected by nebula emission. The evaluated optical and near-UV H and He II lines are shown in Fig. 3.
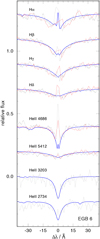 |
Fig. 3 Observed Balmer and He II lines of the white dwarf in EGB 6 (red: SDSS spectrum, gray: SPY spectrum; two lowest lines: HST spectrum) compared to a model spectrum (blue graph; Teff = 105 000 K, log g = 7.4) withthe adopted parameters (see Table 1). Nebular emission lines in the photospheric Balmer line cores are truncated for clarity. |
3 Spectral analysis
We used the Tübingen Model-Atmosphere Package (TMAP2) to compute non-LTE, plane-parallel, line-blanketed atmosphere models in radiative and hydrostatic equilibrium (Werner & Dreizler 1999; Werner et al. 2003, 2012). The models include H, He, C, N, O, Si, P, S, Fe, and Ni. The employed model atoms are described in detail by Werner et al. (2018). In addition, we performed line formation iterations (i.e., keeping the atmospheric structure fixed) for argon and fluorine using the model atoms presented in Werner et al. (2015).
We first turn to the WD in EGB 6 (Sects. 3.1–3.3) and then to the nucleus in Tol 26 (Sect. 3.4).
3.1 Effective temperature, surface gravity, He abundance
We started our spectrum fitting procedure for EGB 6 from a model with temperature, gravity, and helium abundance close to the values derived by Gianninas et al. (2010): Teff = 93 000 K, log g = 7.4, H = 0.9, and He = 0.09 (mass fractions), and assuming solar abundances for the metals. Keeping fixed log g and the H/He ratio, we then adjusted iteratively Teff and the metal abundances to achieve a good fit to the metal lines in the FUSE spectrum. From the relative strengths of lines from different ionization stages of nitrogen, oxygen, and iron (see Sect. 3.2), we realized that the effective temperature must be higher, namely 105 000 K, within a narrow margin of about 5000 K. Then the possible range of the surface gravity was checked with the optical H and He lines, confirming the initial value within log g = 7.4 ± 0.4. The UV lines of H and He are compatible with this result but they are less sensitive to log g. Then the He abundance was refined by using the optical and UV spectra and we found a better fit with a higher He/H ratio, namely a solar value (H = 0.74 and He = 0.25). A model computed with log g = 8.0 shows H and He lines that are significantly too broad.
To investigate the effects of the uncertainty in log g on the other atmospheric parameters, we repeated the fitting procedure with log g = 7.0 models. The lower gravity leads to lower particle densities and, according to the Saha equation, metal ionization balances are shifted to higher stages. To compensate for this, Teff must be reduced to retain good line fits, namely down to 100 000 K. Metal abundances are hardly affected by this change in Teff and log g, but the helium abundance must be reduced in the model. Otherwise, the He II lines become too strong, in particular those at 959, 4686, and 5412 Å, and a detectable λ4542 line is predicted that is not seen in the observations. We arrive at He = 0.18 (and thus H = 0.81). From these experiments we conclude Teff = 105 000 ± 5000 K, log g = 7.4 ± 0.4, and He = 0.25 ± 0.1. The error in the individual metal abundances is estimated not to exceed ± 0.5 dex.
In Fig. 3, we compare the observed optical and near-UV H and He lines with our final model. Although nebular emission lines mask the Balmer line centers, we note a Balmer line problem (Napiwotzki 1993), that is, the depth of innermost parts of the observed photospheric profiles of Hα and Hβ is not quite matched by the models. Gianninas et al. (2010) were unable to detect this problem because of the lower resolution of their spectra. In order to fit these lines, a lower temperature would be required; however, this would give too-deep Hγ and Hδ line cores and, as mentioned above, would be in conflict with the metal line strengths. The central emission in He II λ4686 is of nebularorigin because its height is not reached by the emission reversal of the photospheric line profile.
Comparing our results with the most recent ones by Gianninas et al. (2010; see Sect. 1), the main progress we achieved is the rather tight constraint of the effective temperature (± 5% compared to ± 22%) by using ionization balances of metals. In addition, the error in the surface gravity could be reduced from about ± 0.8 to ± 0.4 dex. The same holds for the He/H abundance ratio. As a consequence, stellar parameters can be determined with higher precision (Sect. 3.3).
3.2 Metal abundances
We detected lines from ten metals in the FUSE spectrum (Figs. 1 and 4). These lines are well known from previous analyses. Line lists, from which detailed laboratory wavelengths and transitions can be obtained, were presented by Werner et al. (2015, their Tables 2–5; 2017, their Tables 2 and 3). The derived abundances are listed in Table 1 and displayed in Fig. 5.
From carbon, two C IV doublets are seen in the FUSE spectrum, namely the 3p–4d and 3d–4f transitions at 1108 and 1169 Å, respectively. In our final model with C = 0.003, the line cores are not deep enough to match the observation. A detailed inspection shows that the computed line profiles show central emission cores. This is unrealistic, but despite some numerical testing concerning the temperature structure of the model, the reason remains unknown. Increasing the carbon abundance mitigates the problem in the line cores, but leads to too strong line wings and to the appearance of optical C IV lines, which are not observed. The variations in log g, Teff, and He abundance described in Sect. 3.1 do not improve the C IV line fits. The same problem was encountered in our analysis of a hot DO WD with similar temperature and gravity (PG 1034+001, 115 000/7.0; Werner et al. 2017, their Fig. 1). The star is too hot to show the C III multiplet at 1175 Å, which is often seen in other DAO WDs and in Tol 26 (see Sect. 3.4).
Nitrogen displays the N IV multiplet at 922–924 Å and the singlet at 955 Å. We also see two N V doublets at 1048 and 1050 Å, which are partially blended by interstellar lines. The relative strength of the N IV and N V lines is well matched by our final model. Values of Teff as high as 115 000 K (at log g = 7.4) or as low as 95 000 K (at log g = 7.0) can be strictly excluded because the N IV lines are much too weak or too strong, respectively, while the N V line strengths are almost unaffected by the Teff variations.
Prominent oxygen lines from three ionization stages are detected. The O IV/O V line strength ratio is very sensitive against Teff variations. While the O V lines hardly change within a range of 95 000–110 000 K, the O IV lines quickly disappear with increasing Teff. The O VI λλ1032/1038 resonance doublet poses a problem. At the adopted abundance, the innermost line cores are too deep and the line wings are slightly too shallow. Interestingly, however, two subordinate O VI lines (4d–5f and 4f–5g transitions at 1123 and 1125 Å) are reproduced well by our final model. They are too weak in the Teff = 95 000 K model (log g = 7.0) and too strong in the Teff = 115 000 K model (log g = 7.4).
A weak F VI λ1139.50 line can be detected, allowing for a fluorine abundance measurement. The silicon abundance was derived from a fit to the Si IV λλ1122/1128 doublet. The blue component is blended by one of the mentioned relatively broad photospheric O VI lines. Another strong Si IV doublet at 1067 Å is blended by a strong interstellar line. The phosphorus abundance was derived from the P V λλ1118/1128 resonance doublet. The sulfur abundance was found from the S VI λλ933/945 resonance doublet, and from two weaker subordinate S VI lines at 1000 and 1118 Å. The argon abundance was measured from the rather prominent Ar VII λ1063.55 line, which is blended by the wing of an adjacent interstellar line.
The strongest iron lines stem from Fe VII, followed by Fe VI and Fe VIII lines (the only unblended Fe VIII line is at 1148 Å). The relative strengths of lines from the different ionization stages are sensitive temperature indicators. For example, at Teff = 95 000 K (and log g = 7.0), the Fe VII lines become too weak, while the Fe VI lines become too strong. At Teff = 115 000 K (and log g = 7.4), the Fe VI lines are too weak, while the Fe VIII lines are too strong. The nickel abundance is derived from a multitude of relatively weak Ni VI lines.
Other iron group elements were not detected, and we can thus exclude extreme overabundances that were seen in other DAOs, namely HS 2115+1148 (Werner et al. 2018) and BD − 22°3467, the exciting star of Abell 35 (Ziegler et al. 2012). Likewise, we found no hint of trans-iron group elements that are present in strongly oversolar amounts in several hot DO WDs (Hoyer et al. 2018, and references therein).
To summarize, the abundances of hydrogen, helium, and ten more identified species in the white dwarf are, within error limits, compatible with solar values.
Parameters for the white dwarf in EGB 6.
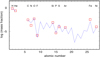 |
Fig. 5 Element abundances measured in the white dwarf in EGB 6 (red squares; see also Table 1). The blue line indicates solar abundances. |
3.3 Stellar parameters, distance
Stellar parameters are estimated from the comparison of the determined atmospheric parameters Teff and log g with evolutionary tracks by Miller Bertolami (2016; Fig. 7). We find  and
and  . The errors are dominated by the uncertainty in log g. The post-AGB age is about 4000 yr; however, the mass uncertainty causes a large possible error: log (tevol/yr) =
  . The mass-loss rates along the evolution assumed by Miller Bertolami (2016) imply log (Ṁ∕M⊙/yr) =
  .
.
The spectroscopic distance d was found by comparing the dereddened visual magnitude V0 with the respective model atmosphere flux, resulting in the relation
![Mathematical equation: \begin{equation*} d \textrm{[pc]}= 7.11\times 10^{4} \sqrt{H_{\nu}\,{\times}\,M\,{\times}\,10^{0.4 V_0-\log g}}\ ,\nonumber \end{equation*}](/articles/aa/full_html/2018/08/aa33200-18/aa33200-18-eq9.png)
where Hν = 1.60 × 10⁻³ erg cm−2 s−1 Hz−1 is the Eddington flux of the model at 5400 Å, and M is the stellar mass in M⊙. For our WD, we have V = 15.998 (Bond et al. 2016). From E(B − V) = 0.025, we derived the visual extinction using the standard relation AV = 3.1E(B − V) = 0.077, hence V0 = 15.92. We found  pc. This value is about 15% higher than the spectroscopic distance derived by Liebert et al. (2013), which essentially reflects the ratio of the effective temperatures of the atmospheric model they used (93 235 K) and that of our model (105 000 K). It agrees with the value of d = 870 ± 250 pc derived by Frew et al. (2016) with a newly developed statistical distance indicator for PNe. The distance to the WD given in the Gaia Data Release 2 (
 kpc) is a factor of two larger than our result, but in agreement within error limits. We conjecture that the Gaia parallax measurement may be compromised by the strong emission lines from the nearby CEK, which could be variable in strength, as was discussed in detail by Bond et al. (2016).
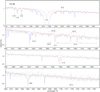 |
Fig. 6 HST/COS spectrum of the white dwarf in Tol 26 (gray) compared to a photospheric model spectrum (red; Teff = 85 000 K, log g = 7.4) with abundances as given in Sect. 3.4. The blue graph is the photospheric model attenuated by interstellar lines. Prominent photospheric lines are identified. Absorption profiles of the C IV resonance doublet and He II λ1640 Å (except for the far wings) are masked by nebular emission lines. |
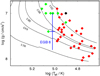 |
Fig. 7 Position of the white dwarf in EGB 6 with error bars in the g–Teff diagram (blue cross). Red, green, and black symbols are DAO WDs from the analyses of Gianninas et al. (2010), Ziegler (2012), and Werner et al. (2018), respectively. Black lines are evolutionary tracks of post-AGB remnants with masses as labeled (in M⊙, from Miller Bertolami 2016; metallicity Z = 0.01). |
3.4 The hot central star of Tol 26
In Fig. 6 we show the HST/COS spectrum of Tol 26. Photospheric lines from He, C, N, O, and Fe can be identified.
He II λ1640 is dominated by strong nebular emission, but we note the outer wings of the photospheric absorption profile. Shortward of 1180 Å, the quality of the spectrum is somewhat poor but the C IV doublet at 1169 Å and the C III multiplet at 1175 Å are detectable. The C IV doublet might be filled in partially by an He I λ1168.67 airglow line (second order from λ584.33). The photospheric C IV resonance doublet is completely filled in by nebular emission. We note a photospheric N V resonance doublet, but a potential photospheric N IV λ1718 line is masked by a tenuous emission feature. We see a O IV multiplet at 1340 Å and O V λ1371. Their relative strengths can be used to constrain the effective temperature. We identify a number of Fe V lines, mostly in the 1374–1430 Å region.
To fit the spectrum, we started to use models with the composition and surface gravity we adopted for EGB 6. We adjusted Teff by using the relative O IV/O V line strengths. The best fit is obtained at Teff = 85 000 ± 5000 K. At that temperature, the C III λ1175 multiplet (which is not present in EGB 6 because of its higher Teff) also fits well. In addition, the Fe V line features are reproduced, so that the C and Fe abundances are the same as in EGB 6. However, we had to reduce the nitrogen and oxygen abundances. We found N = 5 × 10⁻⁶ and O = 1.5 × 10⁻³, i.e., 40 and ≈3 times less than in EGB 6. Error limits for abundances are estimated to 0.5 dex. All other metal abundances cannot be assessed with the HST spectrum. The Si IV resonance doublet is obviously perturbed by interstellar absorption because the line depths cannot be matched by a photospheric model even with an unrealistically high Si abundance. The helium abundance and surface gravity could in principle be constrained with He II λ1640, but both quantities cannot be derived independently given that we only see the outermost part of the line wings. To check to what extent these uncertainties affect the determination of the other atmospheric parameters (Teff, abundances of C, N, O, Fe), we computed models varying log g (± 0.4 dex) and the He abundance (reduction from solar to 1/8 solar) and we found that our results do not change within error limits, in particular, the N and O deficiencies remain.
Given the uncertainty in the He abundance, the question arises whether Tol 26 is a DAOZ at all. Could it be a He-dominated white dwarf (i.e., spectral type DOAZ) or even completely devoid of hydrogen (spectral type DOZ)? Probably not. When we remove hydrogen from our model, the He II λ1640 wings become so strong and broad that it is not compatible with the observation, unless the surface gravity is reduced below log g = 7 in order to diminish the strength of the line wings.
4 Summary and discussion
4.1 EGB 6
We performed a spectral analysis of the hot WD in the PN EGB 6. The effective temperature could be tightly constrained, while the surface gravity remains relatively uncertain (Teff = 105 000 ± 5000 K, log g = 7.4 ± 0.4). A mass of  was derived.The abundances of H, He, and ten more species are solar.
We conclude that element diffusion by gravitational settling and radiative levitation is not acting in the photosphere. The probable reason is that the relatively luminous star (≈100 L⊙) is losing mass by a radiation-driven wind at a rate on the order of 10−11 M⊙ yr−1. Compared to other DAOZ WDs, this is remarkable because they usually show strong deviations from solar abundance patterns due to diffusion (e.g., Good et al. 2005; Ziegler et al. 2012; Werner et al. 2018). The sample of DAOZs and related hot progenitors analyzed by Ziegler (2012) contains objects with temperature and gravity similar to EGB 6. In particular, the central star of Abell 31 (Teff = 114 000 ± 10 000 K, log g = 7.4 ± 0.3) has a roughly solar abundance pattern, while slightly cooler objects like the central star of Abell 35 (Teff = 80 000 ± 10 000 K, log g = 7.2 ± 0.3) show extreme deviations from it (Ziegler et al. 2012). Obviously, stellar winds in cooling DAO WDs effectively prevent element diffusion as long as Teff is higher than ≈100 000 K. Our result for Tol 26 (Teff ≈ 85 000 K; O and N depletion) confirms this conclusion. Similarly, the correlation between helium abundance and effective temperature found by Gianninas et al. (2010) in their sample of DAOs was interpreted as an indication of how the weakening stellar wind along the WD cooling sequence can no longer maintain helium in the atmosphere of a white dwarf.
The theoretical mass-loss rate from the hot WD, log (Ṁ∕M⊙ yr−1) =  , is orders of magnitudes larger than required to inhibit Bondi–Hoyle accretion of interstellar material (MacDonald 1992). We therefore do not expect that any circumstellar material from the PN is accreted unless the accretion flow is reorganized into a disk, due to angular momentum.
Concerning the outer nebula, Liebert et al. (1989) pointed out a discrepancy between their estimations of the post-AGB age of the WD (several 105 yr; based on their spectral analysis and evolutionary tracks by Koester & Schönberner 1986) and the kinematical age of the nebula (20–50 kyr, based on their derived spectroscopic distance of 460 pc and assuming a PN expansion rate of 20–50 km s−1). Our results indicate a much younger WD age, log (tevol yr−1 =  ), mainly due to the higher effective temperature (105 000 K compared to 70 000 K). Taking the PN angular extension (13′), the spectroscopic distance derived by us (660 pc), and the expansion velocity (38 km s−1; Hippelein & Weinberger 1990), we obtain a kinematical age of 15 kyr, which is in agreement with the post-AGB age of the WD.
If the material around the companion was captured at the PN ejection 15 kyr ago, and if the disk lifetime is not much longer, then this would explain why the EGB 6 phenomenon is uncommon. Also, the large distance of the companion from the primary (at least ≈100 AU) prevents a fast evaporation of the disk material by UV radiation from the primary. Measured orbital periods of binary central stars are all much shorter (from hours up to ≈10 yr; see, e.g., the compilation maintained by D Jones3) than that of EGB 6 (larger than ≈500 yr); however a number of wide, visual binaries are known as well (separations of ≈100 to a few thousand AU; Ciardullo et al. 1999).
Liebert et al. (2013) considered an alternative explanation for the origin of the compact emission knot. They put forward the idea that it is the region where the winds from the WD and the supposed dM companion collide. Their “duelling-winds” model was considered unlikely by Bond et al. (2016) since they discovered that the companion is not an exposed dM star but a dust-enshrouded low-luminosity star. In view of our result that the WD is rather young and luminous, it might be worth reconsidering the colliding-wind hypothesis. From an ionization model for the CEK, Liebert et al. (2013) estimated that a WD wind with a rather high mass-loss rate on the order of 10−9 M⊙ yr−1 would be required, but they questioned how a hydrogen-rich WD could maintain such a high rate.
We have shown that the WD has a solar metallicity; therefore, a radiation-driven wind can be sustained with a mass-loss rate of up to 10−10 M⊙ yr−1, and thus almost reaches the required value. However, we also point out that there is no spectroscopic hint of mass-loss; in particular, we would expect the O VI resonance doublet to be most susceptible to wind effects, but the line centers are not shifted relative to other photospheric lines and the profiles are symmetric. Investigations of H-rich central stars showed that the rates are usually larger than 10−9 M⊙ yr−1. The lowest rate derived so far, and thus constraining the threshold for the spectroscopic proof of existing winds, is that of NGC 1360 with ≈ 10−10 M⊙ yr−1 (Herald & Bianchi 2011) using very weak deviations of the O VI resonance doublet line profiles from hydrostatic-atmosphere profiles. Detailed expanding model-atmosphere computations tailored to EGB 6 are required to determine the mass-loss rate that would be necessary to leave a detectable spectroscopic signature.
4.2 Tol 26
We analyzed a UV spectrum of Tol 26. We found, as for EGB 6, that the hot nucleus of Tol 26 is a DAOZ WD, but cooler (Teff ≈ 85 000 K). Helium abundance and surface gravity are uncertain with the observations currently at hand. We measured the abundances of C, N, O, and Fe. Significant depletion of nitrogen and oxygen was revealed, which can be interpreted as an indication that the gravitational settling of elements affects the abundance pattern in the photosphere, in contrast to the WD in EGB 6. Our results confirm that, with regard to the hot nucleus and the compact nebula emission region, Tol 26 is similar to EGB 6. It remains to be investigated whether the central star of Tol 26 also has a low-luminosity companion.
Acknowledgements
We thank R. Napiwotzki for putting the SPY survey spectra at our disposal. The TMAD tool (http://astro.uni-tuebingen.de/~TMAD) used for this paper was constructed as part of the activities of the German Astrophysical Virtual Observatory. Some of the data presented in this paper were obtained from the Mikulski Archive for Space Telescopes (MAST). STScI is operated by the Association of Universities for Research in Astronomy, Inc., under NASA contract NAS5-26555. Support for MAST for non-HST data was provided by the NASA Office of Space Science via grant NNX09AF08G and by other grants and contracts. This research has made use of NASA’s Astrophysics Data System and the SIMBAD database, operated at CDS, Strasbourg, France. Funding for SDSS-III has been provided by the Alfred P. Sloan Foundation, the Participating Institutions, the National Science Foundation, and the U.S. Department of Energy Office of Science. This work has made use of data from the European Space Agency (ESA) mission Gaia (https://www.cosmos.esa.int/gaia), processed by the Gaia Data Processing and Analysis Consortium (DPAC, https://www.cosmos.esa.int/web/gaia/dpac/consortium). Funding for the DPAC has been provided by national institutions, in particular the institutions participating in the Gaia Multilateral Agreement.
References
- Asplund, M., Grevesse, N., Sauval, A. J., & Scott, P. 2009, ARA&A, 47, 481 [NASA ADS] [CrossRef] [Google Scholar]
- Bond, H. E., Ciardullo, R., Esplin, T. L., et al. 2016, ApJ, 826, 139 [NASA ADS] [CrossRef] [Google Scholar]
- Ciardullo, R., Bond, H. E., Sipior, M. S., et al. 1999, AJ, 118, 488 [NASA ADS] [CrossRef] [Google Scholar]
- Conan Doyle A. 1891, The Strand Magazine (London: George Newness Ltd.), 2, 623 [Google Scholar]
- Dopita, M. A., & Liebert, J. 1989, ApJ, 347, 910 [NASA ADS] [CrossRef] [Google Scholar]
- Ellis, G. L., Grayson, E. T., & Bond, H. E. 1984, PASP, 96, 283 [NASA ADS] [CrossRef] [Google Scholar]
- Fleming, T. A., Liebert, J., & Green, R. F. 1986, ApJ, 308, 176 [NASA ADS] [CrossRef] [Google Scholar]
- Frew, D. J., & Parker, Q. A. 2010, PASA, 27, 129 [NASA ADS] [CrossRef] [Google Scholar]
- Frew, D. J., Parker, Q. A., & Bojičić I. S. 2016, MNRAS, 455, 1459 [NASA ADS] [CrossRef] [Google Scholar]
- Gianninas, A., Bergeron, P., Dupuis, J., & Ruiz, M. T. 2010, ApJ, 720, 581 [NASA ADS] [CrossRef] [Google Scholar]
- Good, S. A., Barstow, M. A., Burleigh, M. R., et al. 2005, MNRAS, 363, 183 [NASA ADS] [CrossRef] [Google Scholar]
- Green, R. F., Schmidt, M., & Liebert, J. 1986, ApJS, 61, 305 [NASA ADS] [CrossRef] [Google Scholar]
- Hawley, S. A. 1981, PASP, 93, 93 [NASA ADS] [CrossRef] [Google Scholar]
- Hébrard, G., & Moos, H. W. 2003, ApJ, 599, 297 [NASA ADS] [CrossRef] [Google Scholar]
- Hébrard, G., Friedman, S. D., Kruk, J. W., et al. 2002, Planet. Space Sci., 50, 1169 [NASA ADS] [CrossRef] [Google Scholar]
- Herald, J. E., & Bianchi, L. 2011, MNRAS, 417, 2440 [NASA ADS] [CrossRef] [Google Scholar]
- Hippelein, H., & Weinberger, R. 1990, A&A, 232, 129 [NASA ADS] [Google Scholar]
- Holberg, J. B., Barstow, M. A., & Burleigh, M. R. 2003, ApJS, 147, 145 [NASA ADS] [CrossRef] [Google Scholar]
- Hoyer, D., Rauch, T., Werner, K., & Kruk, J. W. 2018, A&A, 612, A62 [NASA ADS] [CrossRef] [EDP Sciences] [Google Scholar]
- Koester, D., & Schönberner, D. 1986, A&A, 154, 125 [NASA ADS] [Google Scholar]
- Lemoine, M., Vidal-Madjar, A., Hébrard, G., et al. 2002, ApJS, 140, 67 [NASA ADS] [CrossRef] [Google Scholar]
- Liebert, J., Green, R., Bond, H. E., et al. 1989, ApJ, 346, 251 [NASA ADS] [CrossRef] [Google Scholar]
- Liebert, J., Bergeron, P., & Holberg, J. B. 2005, ApJS, 156, 47 [NASA ADS] [CrossRef] [Google Scholar]
- Liebert, J., Bond, H. E., Dufour, P., et al. 2013, ApJ, 769, 32 [NASA ADS] [CrossRef] [Google Scholar]
- MacDonald, J. 1992, ApJ, 394, 619 [NASA ADS] [CrossRef] [Google Scholar]
- Miller Bertolami M. M. 2016, A&A, 588, A25 [NASA ADS] [CrossRef] [EDP Sciences] [Google Scholar]
- Napiwotzki, R. 1993, Acta Astron., 43, 343 [NASA ADS] [Google Scholar]
- Napiwotzki, R., Christlieb, N., Drechsel, H., et al. 2003, Messenger, 112, 25 [NASA ADS] [Google Scholar]
- Schlafly, E. F., & Finkbeiner, D. P. 2011, ApJ, 737, 103 [NASA ADS] [CrossRef] [Google Scholar]
- Werner, K. 1996, ApJ, 457, L39 [NASA ADS] [CrossRef] [Google Scholar]
- Werner, K., & Dreizler, S. 1999, J. Comput. Appl. Math., 109, 65 [NASA ADS] [CrossRef] [Google Scholar]
- Werner, K., Deetjen, J. L., Dreizler, S., et al. 2003, in Stellar Atmosphere Modeling, eds. I. Hubeny, D. Mihalas, & K. Werner, ASP Conf. Ser., 288, 31 [NASA ADS] [Google Scholar]
- Werner, K., Dreizler, S., & Rauch, T. 2012, TMAP: Tübingen NLTE Model-Atmosphere Package, Astrophysics Source Code Library [record ascl:1212.015] [Google Scholar]
- Werner, K., Rauch, T., & Kruk, J. W. 2015, A&A, 582, A94 [NASA ADS] [CrossRef] [EDP Sciences] [Google Scholar]
- Werner, K., Rauch, T., & Kruk, J. W. 2016, A&A, 593, A104 [NASA ADS] [CrossRef] [EDP Sciences] [Google Scholar]
- Werner, K., Rauch, T., & Kruk, J. W. 2017, A&A, 601, A8 [NASA ADS] [CrossRef] [EDP Sciences] [Google Scholar]
- Werner, K., Rauch, T., & Kruk, J. W. 2018, A&A, 609, A107 [NASA ADS] [CrossRef] [EDP Sciences] [Google Scholar]
- Ziegler, M. 2012, Dissertation, Eberhard Karls Universität Tübingen, Germany, http://nbn-resolving.de/urn:nbn:de:bsz:21-opus-71867 [Google Scholar]
- Ziegler, M., Rauch, T., Werner, K., Köppen, J., & Kruk, J. W. 2012, A&A, 548, A109 [NASA ADS] [CrossRef] [EDP Sciences] [Google Scholar]
- Zuckerman, B., Becklin, E. E., & McLean, I. S. 1991, ASP Conf. Ser., 14, 161 [NASA ADS] [Google Scholar]
To pick up the thread from Bond et al. (2016), a fitting quotation of the fictional Sherlock Holmes might be: “It is, of course, a trifle, but there is nothing so important as trifles” (Conan Doyle 1891).
All Tables
All Figures
|
Fig. 1 FUSE spectrum of the white dwarf in EGB 6 (gray) compared to a photospheric model spectrum (red; Teff = 105 000 K, log g = 7.4) withthe adopted parameters (see Table 1). The same model attenuated by interstellar lines is plotted in blue. Prominent photospheric lines are identified. |
| In the text | |
|
Fig. 2 FUSEspectrum (gray) and HST/FOS spectrum (red) of the white dwarf in EGB 6 compared to a photospheric model spectrum (blue; Teff = 105 000 K, log g = 7.4) with the adopted parameters (see Table 1). A reddening of E(B− V) = 0.025 was appliedto the model to fit the observed continuum shape. The model is attenuated by interstellar Lyman line absorption (column density nH = 2 × 1020 cm−2). The black dashed line is the unattenuated model. For clarity, the FUSE spectrum and the models in the respective wavelength range were smoothed with a Gaussian with 1 Å FWHM. The model in the HST/FOS range was convolved with a 7 Å Gaussian. |
| In the text | |
|
Fig. 3 Observed Balmer and He II lines of the white dwarf in EGB 6 (red: SDSS spectrum, gray: SPY spectrum; two lowest lines: HST spectrum) compared to a model spectrum (blue graph; Teff = 105 000 K, log g = 7.4) withthe adopted parameters (see Table 1). Nebular emission lines in the photospheric Balmer line cores are truncated for clarity. |
| In the text | |
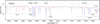 |
Fig. 4 Detailof the FUSE spectrum and model for the white dwarf in EGB 6 from Fig. 1. |
| In the text | |
|
Fig. 5 Element abundances measured in the white dwarf in EGB 6 (red squares; see also Table 1). The blue line indicates solar abundances. |
| In the text | |
|
Fig. 6 HST/COS spectrum of the white dwarf in Tol 26 (gray) compared to a photospheric model spectrum (red; Teff = 85 000 K, log g = 7.4) with abundances as given in Sect. 3.4. The blue graph is the photospheric model attenuated by interstellar lines. Prominent photospheric lines are identified. Absorption profiles of the C IV resonance doublet and He II λ1640 Å (except for the far wings) are masked by nebular emission lines. |
| In the text | |
|
Fig. 7 Position of the white dwarf in EGB 6 with error bars in the g–Teff diagram (blue cross). Red, green, and black symbols are DAO WDs from the analyses of Gianninas et al. (2010), Ziegler (2012), and Werner et al. (2018), respectively. Black lines are evolutionary tracks of post-AGB remnants with masses as labeled (in M⊙, from Miller Bertolami 2016; metallicity Z = 0.01). |
| In the text | |
Current usage metrics show cumulative count of Article Views (full-text article views including HTML views, PDF and ePub downloads, according to the available data) and Abstracts Views on Vision4Press platform.
Data correspond to usage on the plateform after 2015. The current usage metrics is available 48-96 hours after online publication and is updated daily on week days.
Initial download of the metrics may take a while.