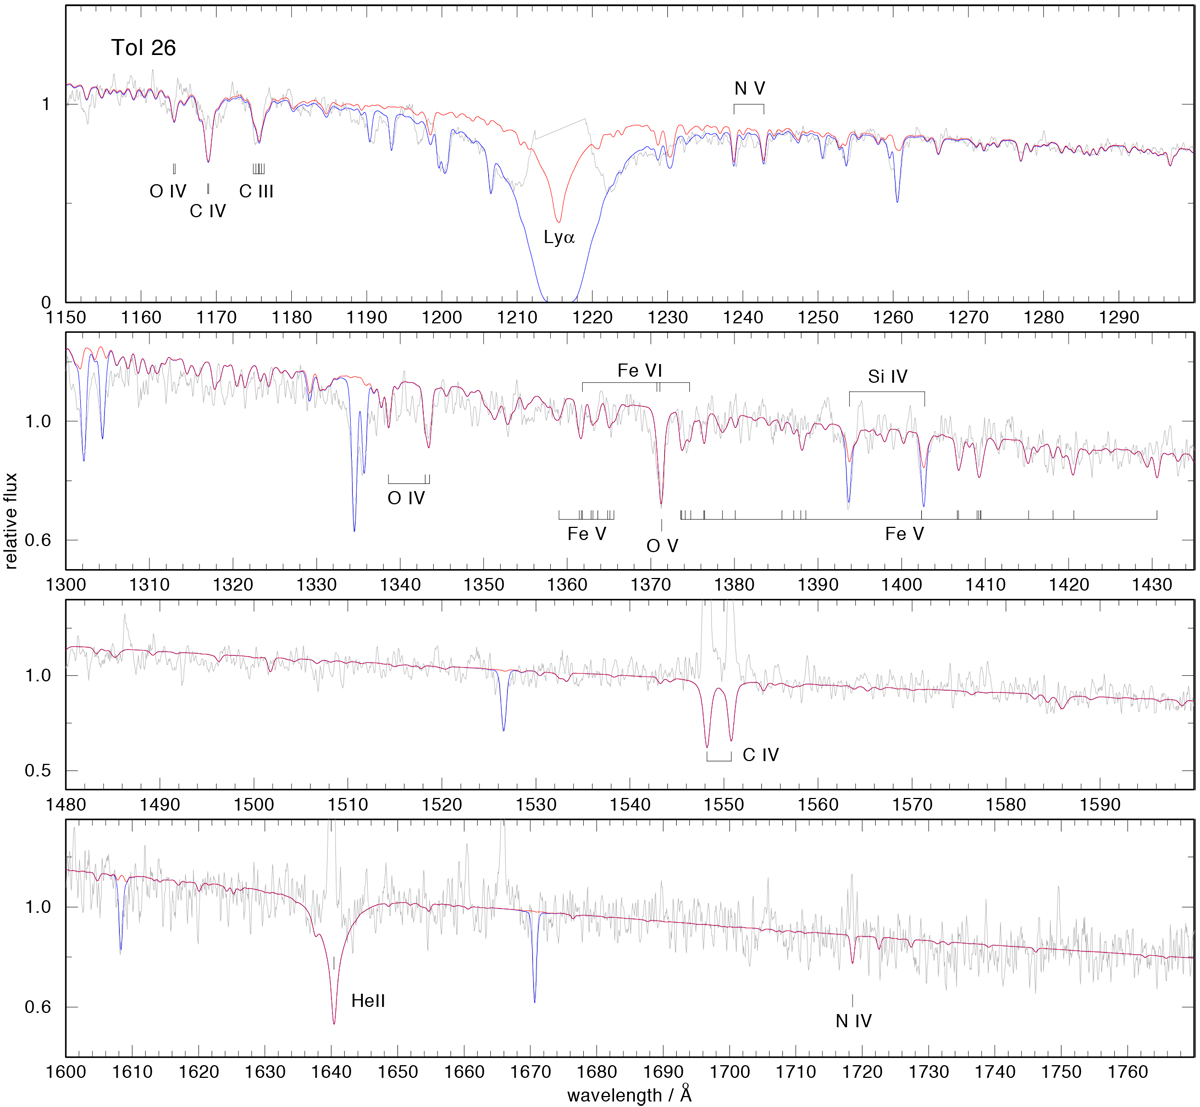
Fig. 6

HST/COS spectrum of the white dwarf in Tol 26 (gray) compared to a photospheric model spectrum (red; Teff = 85 000 K, log g = 7.4) with abundances as given in Sect. 3.4. The blue graph is the photospheric model attenuated by interstellar lines. Prominent photospheric lines are identified. Absorption profiles of the C IV resonance doublet and He II λ1640 Å (except for the far wings) are masked by nebular emission lines.
Current usage metrics show cumulative count of Article Views (full-text article views including HTML views, PDF and ePub downloads, according to the available data) and Abstracts Views on Vision4Press platform.
Data correspond to usage on the plateform after 2015. The current usage metrics is available 48-96 hours after online publication and is updated daily on week days.
Initial download of the metrics may take a while.


