Fig. 3
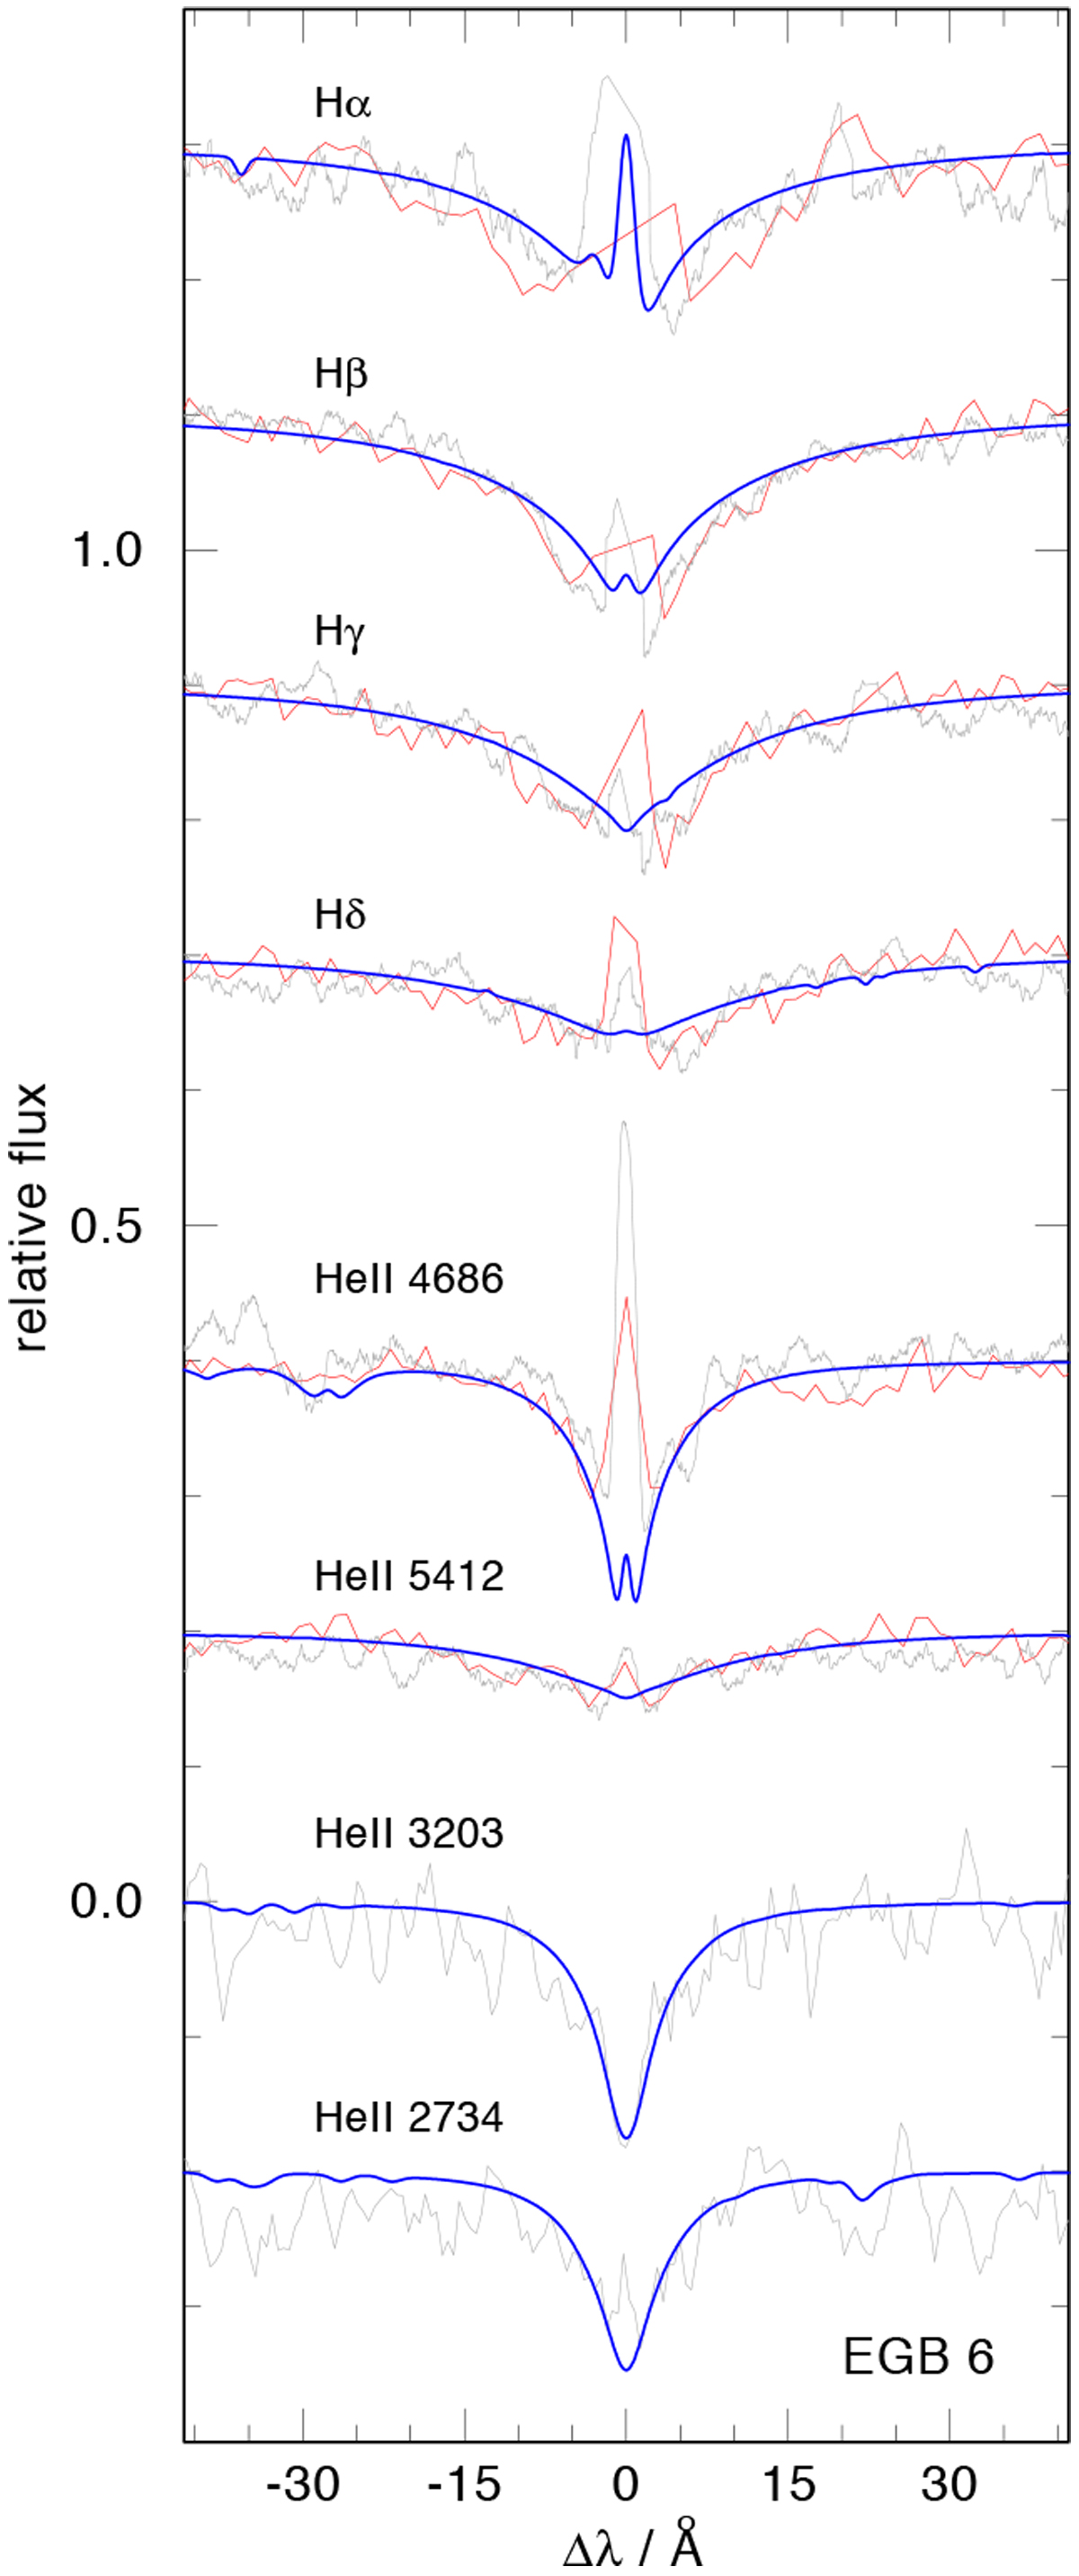
Observed Balmer and He II lines of the white dwarf in EGB 6 (red: SDSS spectrum, gray: SPY spectrum; two lowest lines: HST spectrum) compared to a model spectrum (blue graph; Teff = 105 000 K, log g = 7.4) withthe adopted parameters (see Table 1). Nebular emission lines in the photospheric Balmer line cores are truncated for clarity.
Current usage metrics show cumulative count of Article Views (full-text article views including HTML views, PDF and ePub downloads, according to the available data) and Abstracts Views on Vision4Press platform.
Data correspond to usage on the plateform after 2015. The current usage metrics is available 48-96 hours after online publication and is updated daily on week days.
Initial download of the metrics may take a while.