| Issue |
A&A
Volume 616, August 2018
|
|
|---|---|---|
| Article Number | A77 | |
| Number of page(s) | 40 | |
| Section | Stellar structure and evolution | |
| DOI | https://doi.org/10.1051/0004-6361/201833037 | |
| Published online | 22 August 2018 | |
K2 space photometry reveals rotational modulation and stellar pulsations in chemically peculiar A and B stars
1
Instituut voor Sterrenkunde, KU Leuven, Celestijnenlaan 200D, 3001 Leuven, Belgium
e-mail This email address is being protected from spambots. You need JavaScript enabled to view it.
2
LESIA, Observatoire de Paris, PSL Research University, CNRS, Sorbonne Universités, UPMC Univ. Paris 06, Univ. Paris Diderot, Sorbonne Paris Cité, 5 place Jules Janssen, 92195 Meudon, France
3
Department of Physics, California Lutheran University, 60 West Olsen Road 3700, Thousand Oaks, CA 91360, USA
4
Department of Astrophysics, IMAPP, Radboud University Nijmegen, 6500 GL Nijmegen, The Netherlands
Received:
16
March
2018
Accepted:
4
May
2018
Abstract
Context. The physics of magnetic hot stars and how a large-scale magnetic field affects their interior properties is largely unknown. Few studies have combined high-quality observations and modelling of magnetic pulsating stars, known as magneto-asteroseismology, primarily because of the dearth of detected pulsations in stars with a confirmed and well-characterised large-scale magnetic field.
Aims. We aim to characterise observational signatures of rotation and pulsation in chemically peculiar candidate magnetic stars using photometry from the K2 space mission. Thus, we identify the best candidate targets for ground-based, optical spectropolarimetric follow-up observations to confirm the presence of a large-scale magnetic field.
Methods. We employed customised reduction and detrending tools to process the K2 photometry into optimised light curves for a variability analysis. We searched for the periodic photometric signatures of rotational modulation caused by surface abundance inhomogeneities in 56 chemically peculiar A and B stars. Furthermore, we searched for intrinsic variability caused by pulsations (coherent or otherwise) in the amplitude spectra of these stars.
Results. The rotation periods of 38 chemically peculiar stars are determined, 16 of which are the first determination of the rotation period in the literature. We confirm the discovery of high-overtone roAp pulsation modes in HD 177765 and find an additional 3 Ap and Bp stars that show evidence of high-overtone pressure modes found in roAp stars in the form of possible Nyquist alias frequencies in their amplitude spectra. Furthermore, we find 6 chemically peculiar stars that show evidence of intrinsic variability caused by gravity or pressure pulsation modes.
Conclusions. The discovery of pulsations in a non-negligible fraction of chemically peculiar stars make these stars high-priority targets for spectropolarimetric campaigns to confirm the presence of their expected large-scale magnetic field. The ultimate goal is to perform magneto-asteroseismology and probe the interior physics of magnetic pulsating stars.
Key words: stars: chemically peculiar / stars: magnetic field / stars: rotation / stars: oscillations / stars: early-type
© ESO 2018
1. Introduction
Main-sequence stars of spectral type A and B are possibly the most diverse group of stars in the Hertzsprung–Russell (HR) diagram, as they exhibit many different aspects of physics including rotation, binarity, pulsation, and the possible presence of a large-scale magnetic field. The synergy of these properties have been studied to varying levels of success, yet the interaction of physical processes in the deep radiative interiors of magnetic hot stars remain largely unknown even though they are important for stellar structure and evolution (Maeder 2009; Meynet et al. 2013). The shortcomings in our knowledge of how a large-scale magnetic field affects the internal properties of a star, such as rotation and convective core overshooting, are largest for stars on the upper main sequence, which consequently produce large uncertainties in theoretical models and need to be mitigated.
The study of multi-periodic stellar pulsations is known as asteroseismology and represents a unique methodology for studying the interior physics of a star using its pulsations. The two main types of pulsation modes in stars of spectral type A and B are gravity (g) modes and pressure (p) modes, which are most sensitive to the near-core and near-surface regions in a star, respectively (Aerts et al. 2010). Among the B stars are the beta Cephei (β Cep) and slowly pulsating B (SPB) stars, which predominantly pulsate in p- and g-modes, respectively (Aerts et al. 2010). Similarly, further down the main sequence amongst the A and F stars are the delta Scuti (δ Sct) and gamma Doradus (γ Dor) stars, which also predominately pulsate in p- and g-modes, respectively. Baglin et al. (1973), Waelkens (1991), Breger & Beichbuchner (1996), Handler (1999), Breger (2000), Guzik et al. (2000), Rodríguez & Breger (2001), Aerts et al. (2010), and Bowman (2017) provide reviews of pulsations in B, A, and F stars. From high-quality continuous photometric data sets, such as those provided by the CoRoT (Baglin et al. 2006; Auvergne et al. 2009) and Kepler (Borucki et al. 2010; Koch et al. 2010) space telescopes, individual pulsation modes can be identified and used to probe the largely unknown interior physics of pulsating stars on the upper main sequence.
The coherent pulsations in early-type stars are typically driven by a heat-engine (opacity) operating in partial ionisation zones and/or a flux blocking driving mechanism, although recent work has shown that other types of mode excitation are also possible (Neiner et al. 2012b; Antoci et al. 2014; Houdek & Dupret 2015; Xiong et al. 2016). For example, stochastically excited gravitoinertial modes have been observed in the early-B star HD 51452 (Neiner et al. 2012b), and this type of mode excitation is likely important for rapidly rotating early-type stars (Mathis et al. 2014). Also, evidence for stochastically excited gravity waves has been detected in a handful of O stars (Aerts & Rogers 2015; Aerts et al. 2017a, 2018a; Simón-Díaz et al. 2018), which are predicted to effectively distribute angular momentum and provide a constraint of interior rotation within a star (Rogers et al. 2013; Rogers 2015).
Approximately 10% of intermediate- and high-mass stars host a detectable large-scale magnetic field at the irsurface (Power 2007; Power et al. 2007; Grunhut & Neiner 2015; Neiner et al. 2015; Wade et al. 2016; Villebrun et al. 2016; Grunhut et al. 2017; Sikora et al. 2018). The magnetic field in these stars typically resembles a dipole inclined to the rotation axis, which is known as the oblique rotator model (Stibbs 1950). The total number of magnetic field detections continues to increase thanks to dedicated observing campaigns using high-resolution and high signal-to-noise (S/N) optical spectropolarimetry–for example, MiMeS (Wade et al. 2016), the BOB campaign (Morel et al. 2015), and the BRITE spectropolarimetric survey (Neiner et al. 2017).
Currently, how a large-scale magnetic field affects the physical processes deep within a star’s interior, such as convective core overshooting and the radial chemical mixing and rotation profiles, is poorly constrained using observations. To date, only a dozen pulsating magnetic upper main-sequence stars are known (Buysschaert et al. 2017a), and only three of these have been studied using forward seismic modelling–i.e. magnetoasteroseismology–specifically, β Cep (Shibahashi & Aerts 2000; Henrichs et al. 2013), V2052 Oph (Neiner et al. 2012a; Handler et al. 2012; Briquet et al. 2012), and HD 43317 (Pápics et al. 2012; Buysschaert et al. 2017b, 2018a). This is primarily because of a lack of high-precision and long-term photometric observations of confirmed magnetic stars, which are essential to resolve and extract individual pulsation mode frequencies in pulsating stars and perform forward seismic modelling.
Theory and numerical simulations predict that the internal component of a sufficiently strong large-scale magnetic field should instigate uniform rotation within the radiative layers of early-type stars (Moss 1992; Browning et al. 2004a, b; Mathis & Zahn 2005; Zahn 2011). On the other hand, uniform to weak differential rotation was determined using asteroseismology for 67 intermediate-mass stars (Aerts et al. 2017b); the majority of these stars are not known to host a (detectable) large-scale magnetic field, which suggests that other physical processes also lead to (quasi-)rigid rotation within early-type stars. Additionally, theoretical models predict that a large-scale magnetic field affects and can even suppress the excitation of waves (e.g. Saio 2005, 2014; Lecoanet et al. 2017). The exceptions to this are the high-overtone p-mode pulsations observed in the rapidly oscillating Ap stars. The uniform rotation and a large-scale magnetic field are also predicted by theory to lead to a smaller convective core overshooting region (e.g. Press 1981; Browning et al. 2004a, b). This has been inferred observationally for the β Cep star V2052 Oph (Briquet et al. 2012) by comparing the overshooting value with that of the non-magnetic β Cep star θ Oph (Briquet et al. 2007, 2012).
Similarly, from the forward seismic modelling of the magnetic SPB star HD 43317, Buysschaert et al. (2018a) were able to constrain convective core overshooting to relatively small values, yet the lack of g-mode period spacing pattern spanning a large range of consecutive radial orders could not exclude moderate values of convective core overshooting that have been found for non-magnetic B stars (Moravveji et al. 2015, 2016). Clearly, additional observational studies of pulsating magnetic stars are needed to constrain the interior physics of these stars.
Chemically peculiar (CP) stars on the upper main sequence have been historically grouped into different categories (e.g. Sargent 1964; Jaschek & Jaschek 1974; Preston 1974; Wolff 1983; Smith 1996), in which the presence of the observed chemical peculiarities is often, but not always, related to the presence of a large-scale magnetic field (Michaud 1970; Vauclair et al. 1979). The various flavours of CP stars on the upper main sequence were condensed into four main groups, CP 1–CP 4, by Preston (1974).
The CP 1 stars (also known as Am stars) were first characterised by Titus & Morgan (1940) and later by Smith (1971a, b) as slowly rotating non-magnetic A stars with a difference of at least five spectral subclasses between their Ca K and metallic line strengths. The Am stars are common with approximately 50% of stars of spectral type A8 classified as Am (Smith 1973). Stars that show less than five subclasses between their Ca K and metallic line strengths are classified as marginal Am (Am:) stars (Cowley et al. 1969; Kurtz 1978b), since they are significantly different from chemically normal A stars. The majority of Am stars are typically found in short-period (1 ≤ P orb ≤ 10 d) binary systems (Roman et al. 1948; Abt 1961, 1967; Abt & Levy 1985; Smalley et al. 2014), which is significantly higher than the binary fraction of chemically normal A stars (Abt 2009; Duchêne & Kraus 2013; Moe & Di Stefano 2017). The short orbital periods are sufficient to tidally brake Am stars into being slow rotators and allow gravitational settling and radiative diffusion, and different metallic species thereby rise from radiative levitation or sink from gravity (Breger 1970; Baglin et al. 1973; Vauclair et al. 1979; Turcotte et al. 2000). This leads to transition metals forming clouds near to the stellar surface, which are observed as overabundance anomalies (Breger 1970; Kurtz 2000).
The CP 2 stars, also known as Ap and Bp (or collectively known as ApBp) stars, constitute approximately 10% of all A and B stars (Wolff 1968). The ApBp stars have spectroscopic overabundances of elements such as Cr, Eu, Si, and Sr, which can be as large as 106 times solar values. These stars are also known to host large-scale magnetic fields, which range from a few hundred Gauss (e.g. Aurière et al. 2004) to as large as 34 kG (e.g. HD 215441; Babcock 1960), and are responsible for the observed chemical peculiarities. The magnetic field in an ApBp star is typically inclined to the rotation axis, which is known as the oblique rotator model; the angle between the magnetic and rotation axes is known as the angle of obliquity (Stibbs 1950).
The first studies of binarity amongst ApBp stars were carried out by Abt & Snowden (1973), who found that approximately 20% of ApBp stars were in binary systems. They also found a dearth of ApBp stars in close binary systems, yet a binary fraction for wide binary systems that is typical of normal A and B stars. Later works by Gerbaldi et al. (1985), North et al. (1998), Carrier et al. (2002), Mathys (2017), and Landstreet et al. (2017) have confirmed the dearth of ApBp stars in close-binary systems, which are typically defined as orbital periods less than 3 d. The only known exception being HD 200405, which has a binary orbital period of 1.635 d (Carrier et al. 2002).
The CP 3 stars, also known as HgMn stars, are non-magnetic stars with enhanced Hg and Mn absorption lines in their spectra. However CP 4 stars, also known as He-weak stars, have weaker He I lines than expected for their photometric UBV colours and are thought to be an extension of the CP 2 and CP 3 stars to higher temperatures in the HR diagram, since they also host a large-scale magnetic field and show strong Si, Ti, and Sr absorption lines in their spectra (Sargent 1964; Preston 1974). Another subgroup within CP stars are He-strong stars, which also host a large-scale magnetic field (Borra & Landstreet 1979).
Magnetic CP stars are typically slow rotators with rotation periods of order a day, but can be as long as a few hundred years (Mathys 2015); the fastest rotators have rotation periods of about 0.5 d (e.g. Adelman 2002; Mathys 2004). This distinctly different distribution in the rotation periods of magnetic stars compared to non-magnetic A and B stars is caused by magnetic braking during the pre-main-sequence contraction phase (Abt & Morrell 1995; Ste¸pień 2000). Although a large range spanning several orders of magnitude exists in the rotation periods of magnetic stars, the change in the rotation period of a star is relatively small during the main-sequence stage of evolution, so the magnetic field must be generated prior to the main sequence (Kochukhov & Bagnulo 2006; Neiner et al. 2015; Villebrun et al. 2016; Alecian et al. 2017). The slow rotation and a strong large-scale magnetic field cause atomic diffusion and stratification in the atmosphere, which lead to surface abundance inhomogeneities. For such rotationally variable CP stars (known as α2 CVn stars) and/or stars with a detectable magnetosphere (e.g. Shultz et al. 2018), the rotation period can be determined from the rotational modulation observed in the light curve (Stibbs 1950). These surface abundance inhomogeneities and the topology of the large-scale magnetic field can be studied in great detail using tomographic imaging techniques (see e.g. Kochukhov et al. 2014, 2015; Kochukhov & Wade 2016; Kochukhov 2017; Oksala et al. 2017).
Rapidly oscillating Ap (roAp) stars are a rare subgroup of Ap stars that were first discovered by Kurtz (1978a, 1982). Currently, only 61 confirmed roAp stars are known, which represents a few per cent of all the known Ap stars (Smalley et al. 2015; Joshi et al. 2016). Similarly to Ap stars, roAp stars are typically not found in close-binary or multiple systems (e.g. Schöller et al. 2012). These CP magnetic stars pulsate in highovertone p modes with periods between 5 and 24 min (Kurtz 1982, 1990; Martinez & Kurtz 1994a; Cunha 2002a; Kurtz et al. 2007; Alentiev et al. 2012; Smalley et al. 2015; Joshi et al. 2016) and have photometric peak-to-peak amplitudes as large as 34 mmag in the Johnson B filter (Kurtz 1990; Holdsworth et al. 2018a). Most of the known roAp stars were discovered using high-cadence ground-based photometry, although some were detected using spectroscopic radial velocity studies (e.g. Kochukhov et al. 2002; Elkin et al. 2005).
Unlike chemically normal pulsating A stars, i.e. δ Sct stars, the strong magnetic field in an Ap star is believed to suppress the excitation of low-overtone p modes (Saio 2005). The exact nature of the excitation of the high-overtone p modes in roAp stars is not known, but both the κ-mechanism operating in the hydrogen ionisation zone (Cunha 2002b) and turbulent pressure are thought to be responsible (Cunha et al. 2013). The pulsation symmetry axis of a roAp star is nearly aligned with the magnetic symmetry axis, both of which are inclined to the rotation axis. This is known as the oblique pulsator model and allows the pulsations to be viewed from various orientations as the star rotates (Kurtz 1982; Dziembowski & Goode 1985, 1996; Shibahashi & Takata 1993; Takata & Shibahashi 1995; Bigot et al. 2000; Bigot & Dziembowski 2002; Bigot & Kurtz 2011).
With so few pulsating ApBp stars known and fewer still with high-quality continuous photometry, more observational studies searching for intrinsic variability in these stars are needed. In this paper, we perform a detailed study of 56 CP stars using high-precision photometry obtained by the K2 space mission (Howell et al. 2014). This statistically significant number of stars allows us to determine previously unknown rotation periods and carry out a systematic search for variability caused by stellar pulsations (coherent modes and/or travelling waves). Our goal is to identify pulsating stars for follow-up with spectropolarimetry to confirm the presence of a large-scale magnetic field and to perform magneto-asteroseismology to probe the physics of their interiors.
2. Observations of CP stars by K2
Typically, a star is classified to host a large-scale magnetic field if the Zeeman signature is detected in spectropolarimetric observations using a false alarm probability (FAP) criterion (Donati et al. 1992, 1997). Also, strong large-scale magnetic fields can induce detectable Zeeman splitting of various spectral absorption lines (e.g. Mathys 2017), whereas stellar pulsations are detected using high-precision (and ideally high-cadence) photometric or spectroscopic time series (see Chap. 4 from Aerts et al. 2010). The CP 2 and 4 stars are expected to host a largescale magnetic field, but before the advent of space photometry, few CP stars had high-quality uninterrupted photometric observations available to investigate their intrinsic variability.
Recently, Buysschaert et al. (2018b) analysed a subset of 16 CP stars using high-resolution and high-S/N ground-based optical spectropolarimetry combined with photometry from the K2 space mission. This analysis led to the confirmation of a largescale magnetic field in 12 of these 16 stars, 10 stars of which are the first such detection of a large-scale magnetic field. In this work, we study a larger sample of CP stars observed by the K2 space mission and identify the best candidate pulsating stars for ground-based spectropolarimetric follow-up campaigns to confirm the presence (or absence) of a large-scale magnetic field.
2.1. Target selection
We compiled a sample of 50 ApBp (CP 2), 1 HgMn (CP 3) star, 2 He weak (CP 4) stars using the catalogue of Renson & Manfroid (2009) and an additional 3 CP stars identified by Crawford et al. (1955) and McCuskey (1967), for which space photometry from Campaigns 00–12 of the K2 mission was requested. The total of 56 stars within our sample are listed in Table 1, which provides the K2 EPIC identification and HD numbers, the B and V band magnitudes from SIMBAD1, and the spectral type listed in Renson & Manfroid (2009). The star EPIC 202061263 is not resolved using SIMBAD, so its B- and V-mag values have been extracted using its coordinates (α = 06 03 08.82, δ = +23 47 23.71; J2000.0).
Fifty-six CP stars in our sample with B- and V-mag values from SIMBAD and spectral type from Renson & Manfroid (2009).
2.2. K2 data reduction
The nominal Kepler mission was originally designed to achieve a primary goal of observing transits of Earth-like planets orbiting Sun-like stars (Borucki et al. 2010). Observations are available in two modes: long cadence (LC; 29.5 min) and short cadence (SC; 58.5 s). Only about 500 stars can be observed in SC at any given epoch (Gilliland et al. 2010). The primary 4 yr Kepler mission came to an end in May 2013 after the spacecraft lost the ability to use three reaction wheels, which were necessary to maintain the pointing of the telescope. An ingenious solution was to redefine the mission parameters and point the telescope in the direction of the ecliptic where torque forces caused by solar radiation pressure are minimised (Howell et al. 2014). The new mission, K2, has provided high-quality photometry of many different aspects of astronomy, and the data from this mission are grouped into various campaigns that are each approximately 80 d in length (Howell et al. 2014). The K2 mission has proven extremely valuable for investigating pulsating stars, including some of the most massive stars (e.g. Buysschaert et al. 2015; Johnston et al. 2017; White et al. 2017; Aerts et al. 2018a), stars at different stages of evolution (e.g. Kurtz et al. 2016; Hermes et al. 2017), and stars in clusters (e.g. Lund et al. 2016; Stello et al. 2016).
We downloaded the K2 target pixel files (TPF), which are available from Mikulski Archive for Space Telescopes (MAST2), to investigate the photometric variability of 56 CP stars. For each available K2 (sub-)campaign for each star, we determined an optimum (non-circular) aperture by stacking all TPFs and including the pixels that capture the flux of the target star during a campaign. This is a necessary step since a target star moves on the telescope CCD because of the (quasi-)periodic K2 thruster firing events that occur approximately every 6 h (Howell et al. 2014).
The resultant light curve for each (sub-)campaign was corrected for the mean background flux and detrended using the k2sc software package, which uses Gaussian processes to preserve dominant periodicity in a light curve and remove instrumental systematics (Aigrain et al. 2015, 2016, 2017). Finally, we excluded data points with a bad quality flag output from k2sc, combined all available data for each star into a single light curve, converted the light curve into magnitudes, and subtracted the mean to produce a light curve with a mean magnitude of zero.
3. Extracting rotational modulation
For a CP star with surface abundance inhomogeneities, rotational modulation can be extracted from the Fourier transform of its light curve, i.e. an amplitude spectrum. The (often non-sinusoidal) rotational modulation in the light curve of a CP star is observed as a series of integer harmonics (nνrot) of the surface rotation frequency (νrot) of the star in its amplitude spectrum. The number of harmonics range from unity (purely sinusoidal) to dozens dependent on the number, size, and location of the abundance inhomogeneities on the surface of a star and the viewing angle of the observer (Stibbs 1950). By extension, the number of detectable harmonics depend on the data quality, specifically the noise level in the amplitude spectrum.
From the analysis of the Ap star KIC 2569073, Drury et al. (2017) found a significant change in the amplitude of the rotational modulation signal when comparing new and literature ground-based photometric observations separated by two decades, although no measurable change in the rotation period was found. Physically, this can be interpreted as a change in the size of the surface abundance inhomogeneities on this star, but not their location since the viewing angle had not changed. We expect the rotation periods of CP stars to be constant for time spans much longer than the length of our K2 observations (see e.g. Mathys 2015), although a recent study by Krtička et al. (2017) investigated how torsional oscillations within a star can explain the observed periodic rotation period variations in the CP stars CU Vir and HD 37776.
Thus, it is reasonable to extract a series of harmonics from within the typical frequency range of the rotation periods of CP stars, i.e. Prot ≳ 0.5 d (0 < rot ≲ 2 d−1), and interpret this as rotational modulation signal. However, due care and attention is necessary to ensure that the correct peak is selected as the rotation frequency, where the highest peak in the amplitude spectra of some CP stars does not represent the true rotation frequency (see Fig. B.2 for an example). Although we used the k2sc software package to remove instrumental systematics when creating our optimised K2 light curves, variance inevitably remains in the output light curves. To determine the highest accuracy in the rotation periods for our sample of CP stars and an improved amplitude spectrum noise level, we used a two-step approach. An amplitude spectrum was calculated via a discrete Fourier transform (DFT; Deeming 1975; Kurtz 1985) with an oversampling of (at least) ten for a star. We extracted the low-frequency peak in the amplitude spectrum that represents the rotation frequency for each star and optimised its frequency, amplitude, and phase with a linear (i.e. at fixed frequency) and subsequently a non-linear least-squares fit to the light curve using the equation
 (1)
(1)
where A is the amplitude (mmag), ν is the frequency (d−1), t is the time (d), and φ is the phase (rad). For each star, the midpoint of the K2 light curve was selected as the zero-point of the timescale, t0, in Eq. (1) to reduce frequency uncertainties (see e.g. Montgomery & O’Donoghue 1999; Kurtz et al. 2015; Bowman 2017) and determine the rotational modulation model.
Uncertainties for frequency, amplitude, and phase were derived using the formulae provided by Montgomery & O’Donoghue (1999), which are consistent with the 1σ uncertainties output from a least-squares fit. It should be noted that these uncertainties are underestimates of the true uncertainty because the data in photometric observations can be correlated producing non-white noise in an amplitude spectrum (see e.g. Bowman et al. 2015; Holdsworth et al. 2018b). The ratio of the noise levels at low (where the noise is not white) and high frequencies (where the noise is white) in the residual amplitude spectra of our CP stars is typically between a value of two and three, so to be conservative we multiplied the frequency uncertainty obtained using the formula from Montgomery & O’Donoghue (1999) by a factor of three before propagating it into a rotation period uncertainty.
Next, we determined the number of frequency harmonics to include in the rotational modulation model by using a leastsquares fit and including a series of consecutive integer harmonics of the rotation frequency that have an amplitude larger than 3σ of the amplitude error obtained using the formula from Montgomery & O’Donoghue (1999). For the stars in our sample where rotational modulation was detected, the above method produced a preliminary rotational modulation model, which we subtracted from the light curve of a star and we used a locally weighted scatterplot smoothing (LoWeSS; Cleveland 1979; Seabold & Perktold 2010) filter to determine any remaining systematics in the residual light curve. The smoothing of the employed LoWeSS filter is similar to the low-order polynomial instrumental artefacts often seen in Kepler mission data (e.g. Pápics et al. 2017) and likely represents small changes in the temperature of the CCD or background flux during a K2 campaign. We chose to perform this further detrending since we are interested in searching for pulsation modes in these stars after extracting the rotational modulation. The rotation frequency extraction, optimisation, and multi-frequency model was repeated a second time with the newly improved detrended light curve to gain the most accurate rotational modulation models.
In all stars for which rotational modulation was detected, this two-step approach did not alter the extracted rotation frequency (or period) by more than its uncertainty, but did improve the quality of the light curves in the majority of cases. For example, we calculated the noise level in frequency windows at low (1 ≤ ν ≤ 5 d−1) and high (21 ≤ ν ≤ 24 d−1) frequency in the resultant amplitude spectra and found that in the majority of all cases that the noise level was slightly lower after applying the LoWeSS filter. Furthermore, we calculated the amplitude S/N ratio of the extracted rotation frequency peak and found that it was slightly higher in practically all cases. Thus, this two-step approach is justified for producing higher quality light curves and improved amplitude spectra in order for us to reach the goal of detecting pulsations in stars with rotational modulation.
It is important to note that any variance in an amplitude spectrum that remains within the Rayleigh frequency resolution criterion of an extracted peak after pre-whitening the rotational modulation model is likely an artefact of the data reduction. The remaining variance that is within the Rayleigh frequency resolution is caused by changes in the peak-to-peak amplitudes in the light curve, which is consequently observed as small amplitude and/or frequency modulation in the rotation signal and its harmonics in an amplitude spectrum. In the standard procedure of pre-whitening, frequencies are extracted as purely periodic (co)sinusoids and leave remaining variance in the residual amplitude spectrum if the signal is non-periodic (see e.g. Degroote et al. 2009; Pápics et al. 2017; Bowman 2017). Thus, any signal within the Rayleigh resolution of an extracted frequency in a residual amplitude spectrum should not be claimed as astrophysical since it could be instrumental. Similarly, due to the inherent quasi-periodic nature of the thruster firing, which occurs approximately every 5.9 h (Howell et al. 2014), and the quasi-periodic missing data points that occur approximately every 2 d in K2 data, a complex aliasing structure at and around νthrus = 4.08 d−1 can be seen in an amplitude spectrum. The combined effect can produce side lobes at νthrust ± 0.5 d−1, or aliases caused by high-amplitude peaks around the thruster frequency, which also should not be considered as astrophysical.
In the subsequent sections, we discuss CP stars in our sample for which we detect no rotational modulation in Sect. 4, CP stars with rotational modulation in Sect. 5, CP stars with rotational modulation and additional variability indicative of stellar pulsations in Sect. 6, and CP stars with no rotational modulation yet variability caused by pulsations in Sect. 7.
4. Results: CP stars that lack rotational modulation
The method for extracting rotation periods clearly does not work for stars that (i) are not rotationally variable and have no rotational modulation signal in their light curve or amplitude spectra; or (ii) have a rotation period that is similar or longer than the length of the K2 observations; and/or (iii) the available K2 photometry is of poor quality. For CP stars in our sample that show no evidence of rotational modulation we were unable to perform our two-step methodology. Since no rotation periods were derived for these stars, the step of smoothing the residual light curve using a LoWeSS filter was not applicable. This is the case for 12 stars in our sample, whose EPIC and HD numbers and details of the K2 observations are given in Table 2. Amongst these stars are two interesting cases: the SB2 binary system EPIC 206026652 (HD 215766) and the known roAp star EPIC 214503319 (HD 177765), which are discussed in more detail below.
Properties of the 12 CP stars for which rotation periods could not be extracted using K2 observations.
4.1. EPIC 206026652 – HD 215766
EPIC 206026652 (HD 215766) has been identified as a spectroscopic (SB2) binary system by Renson & Manfroid (2009), a projected surface rotational velocity of ν sin i = 80 ± 12 km s−1 (Chini et al. 2012), and a possible rotation period of Prot = 5.2310 ± 0.0087 d (Wraight et al. 2012). However, Wraight et al. (2012) commented that the detection of this rotation period is uncertain since their observations suffer from significant blending and systematics that severely affect the detection of a reliable period. The K2 light curve and amplitude spectrum of HD 215766 are shown in the top and bottom panels of Fig. 1, respectively. We do not find a significant rotation period of HD 215766 using the available ~70 d of K2 photometry. The measured period of 5.2310 ± 0.0087 d by Wraight et al. (2012) has an amplitude of less than 60 μmag in our K2 observations and is not significant given the comparable noise level for this star.
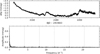 |
Fig. 1. K2 light curve and amplitude spectrum for EPIC 206026652 (HD 215766) are given in the top and bottom panels, respectively. The vertical dashed grey lines indicate the location of integer multiples of the K2 thruster firing frequency of νthrus = 4.08 d−1. |
4.2. Known roAp star: EPIC 214503319 (HD 177765)
EPIC 214503319 (HD 177765) is the only previously confirmed roAp star in our sample. Although null detections (NDs) of high-overtone pulsations in this star appear in the literature (e.g. Martinez & Kurtz 1994b), the discovery of its roAp pulsations was first made by Alentiev et al. (2012). The exact rotation period of HD 177765 is not known but has been constrained to Prot ≫ 5 yr by Mathys (2017), which explains our non-detection using ~80 d of K2 space photometry. The K2 light curve and amplitude spectrum of HD 177765 are shown in the top and bottom panels of Fig. 2, respectively. HD 177765 has also been confirmed as a magnetic CP star with a mean field modulus of 〈B〉 ≃ 3.2 kG (Mathys et al. 1997; Renson & Manfroid 2009; Mathys 2017), which is compatible with the minimum polar strength of Bp ≃ 3.5 kG from Buysschaert et al. (2018b), and a projected surface rotational velocity of ν sin i = 5 ± 2 km s−1 (Buysschaert et al. 2018b). We note that the LC Kepler sampling frequency of νsamp = 48.94 d−1 can be used to demonstrate that the peak at 11.760 ± 0.002 d−1 with an amplitude of 14 ± 4 μmag in our K2 observations is the Nyquist alias of its high-frequency pulsation with a period of 23.6 min (ν = 61.02 d−1; Alentiev et al. 2012), as shown in the summary figure in Fig. 2. Further analysis of this star has also been performed in which multiple roAp pulsation modes have been detected (Holdsworth 2016).
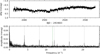 |
Fig. 2. K2 light curve and amplitude spectrum for EPIC 214503319 (HD 177765) are given in the top and bottom panels, respectively. The vertical dashed grey lines indicate the location of integer multiples of the K2 thruster firing frequency of νthrus = 4.08 d−1. HD 177765 is a confirmed roAp star, and a Nyquist alias of its high-frequency pulsation modes can be seen at 11.760 ± 0.002 d−1, indicated by the solid green line. |
5. Results: CP stars with measured rotational modulation but no other variability
For the 38 stars in which rotational modulation was detected, the measured and literature (if available) rotation periods are given in Table 3, and rotational modulation figures are given in Appendix A. In our sample, 10 stars are almost entirely absent from the scientific literature with the exception of a spectral type from the Renson & Manfroid (2009) catalogue. For 16 stars in our sample, we report the first measurement of rotation periods.
Properties of the CP stars for which variability was detected using K2 observations.
For each star for which we measure a rotation period, the results of our analysis of the available K2 photometry are summarised in a multi-panel figure; the example for EPIC 201667495 (HD 107000) is shown in Fig. 3. The multipanel summary figures for the detected rotational modulation in the other CP stars discussed in this paper are given in Appendices A and B. Each summary figure contains the detrended K2 light curve, the phase-folded light curve, and the amplitude spectrum before and after pre-whitening the rotational modulation model.
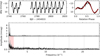 |
Fig. 3. Rotational modulation in EPIC 201667495 (HD 107000). The detrended K2 light curve is shown in the top left panel. Bottom panel: amplitude spectrum calculated up to the K2 LC Nyquist frequency of 24.47 d−1; the lower part shows the residual amplitude spectrum calculated after the rotational modulation signal was removed for comparison. We note the change in ordinate scale. The vertical red lines indicate the location of the extracted rotation frequency and of its significant harmonics, which were used to construct the rotational modulation frequency model. The vertical dashed grey lines indicate the location of integer multiples of the K2 thruster firing frequency of νthrus = 4.08 d−1. The phase-folded light curve using the derived rotation period is shown in the top right panel with black circles indicating the K2 observations and the red line indicating the rotational modulation frequency model. |
5.1. EPIC 201667495 – HD 107000
The rotation period of EPIC 201667495 (HD 107000) is somewhat disputed in the literature; that is Prot = 2.8187 ± 0.0024 d was measured by Wraight et al. (2012), yet twice this value, i.e. 5.638 d, was measured by Romanyuk et al. (2015). Therefore, it is likely that Wraight et al. (2012) measured twice the rotation frequency, i.e. half the rotation period. The longer rotation has since been confirmed and was determined to be Prot = 5.6 ± 0.7 d and a projected surface rotational velocity of ν sin i = 20 ± 5 km s−1 by Buysschaert et al. (2018b), and this star is known to host a large-scale magnetic field with a polar strength of order Bp ≃ 750 G (Romanyuk & Kudryavtsev 2008; Romanyuk et al. 2014, 2015; Buysschaert et al. 2018b). In this work, we measured a rotation period of 5.641 ± 0.001 d with K2 photometry, which is more precise than previous literature values. The summary figure of EPIC 201667495 is shown in Fig. 3.
5.2. EPIC 201777342 – HD 97859
The rotation period of this star is known with values of Prot = 0.7921 ± 0.0002 from Wraight et al. (2012) and Prot = 0.792 ± 0.008 d from Buysschaert et al. (2018b). HD 97859 is also known to host a large-scale magnetic field with a polar strength of order Bp ≃ 1.7 kG and has a projected surface rotational velocity of ν sin i = 83 ± 1 km s−1 (Buysschaert et al. 2018b). In this work, we measure a rotation period of Prot = 0.792122 ± 0.000004 d, which is consistent yet more precise than previous literature values. A significant period of 1.5848 d (i.e. twice the rotation period) for this star was found by Armstrong et al. (2016) using their automated classification method, but this frequency is absent from our K2 photometry after removing the rotational modulation signal including all its harmonics. The summary figure of EPIC 201777342 is shown in Fig. A.1.
5.3. EPIC 203092367 – HD 150035
This star was investigated by Thompson et al. (1987) for possibly having a magnetic field, although the detection of a few hundred Gauss field was deemed not to be statistically significant. Modern observations using spectropolarimetry will more conclusively determine the strength and significance of the possible magnetic field in this star. HD 150035 has a literature rotation period of Prot = 2.3389 ± 0.0013 d from Wraight et al. (2012) using STEREO photometry. In this work, we measure a rotation period of Prot = 2.403 ± 0.002 d, which is significantly different from the literature value given by Wraight et al. (2012). The summary figure of EPIC 203092367 is shown in Fig. A.2, in which a peak at 6.108 ± 0.002 d−1 lies close to 1.5 νthrus and so we exclude this frequency since it is likely instrumental. HD 150035 is a bright star and its necessarily large pixel mask may include neighbouring stars. Short cadence data are also available for HD 150035, which provided the ability to exclude the possibility that this star is a roAp star since we found no variability indicative of stellar pulsations up to the SC Nyquist frequency of 714 d−1.
5.4. EPIC 203814494 – HD 142990
This star is a known magnetic star with a polar strength of Bp ≃ 1 kG (Borra et al. 1983; Bohlender et al. 1993; Wade et al. 2016; Shultz et al. 2018). Recently, Shultz et al. (2018) identified that this star has a significant non-dipolar magnetic field structure. Measurements of the projected surface rotational velocity of HD 142990 include ν sin i = 125 ± 64 km s−1 (Aerts et al. 2014) and ν sin i = 122 ± 2 km s (Shultz et al. 2018). Previous measurements of the rotation period of this star are Prot = 0.9789 ± 0.0003 d (Wraight et al. 2012) and Prot = 0.978832 ± 0.000002 d (Shultz et al. 2018). In this work, we measure a rotation period of Prot = 0.97892 ± 0.00002 d, which is consistent with the value from Wraight et al. (2012) yet significantly different from the value from Shultz et al. (2018). The summary figure of EPIC 203814494 is shown in Fig. A.3.
5.5. EPIC 204964091 – HD 147010
This star is part of the Scorpio–Centaurus association and has a strong magnetic field with a mean magnetic field modulus of 〈B〉 ≃ 16 kG (Thompson et al. 1987; Mathys 1995, 2017; Mathys & Hubrig 1997; Bailey & Landstreet 2013). HD 147010 has a rotation period of Prot = 3.9209 ± 0.0048 d (Wraight et al. 2012). Similarly, Bailey & Landstreet (2013) measured a projected surface rotational velocity of ν sin i = 15 ± 2 km s−1 and a rotation period of Prot = 3.9207 ± 0.0003 d. In this work, we measure a rotation period of Prot = 3.9216 ± 0.0003 d, which is consistent with the value from Wraight et al. (2012) yet significantly different from the value given by Bailey & Landstreet (2013), who determined the rotation period from the periodic changes in the measured longitudinal field strength. The summary figure of EPIC 204964091 is shown in Fig. A.4.
5.6. EPIC 210964459 – HD 26571
This star is confirmed as a slow rotator with Prot = 15.7505 ± 0.0004 d via ground-based photometry (Adelman 2008) and has a projected surface rotational velocity of ν sin i = 20.0 ± 3.0 km s−1 (Wraight et al. 2012). However, the rotation period of HD 26571 is somewhat disputed in the literature, where a value of 1.06 d was given by Catalano & Renson (1998), although these authors commented that this value is dubious and could arise from a 1-day alias, and Wraight et al. (2012) classifying the star as non-variable. In this work, we measure a rotation period of Prot = 15.733 ± 0.002 d, which is significantly different from the literature value from Adelman (2008). The summary figure of EPIC 210964459 is shown in Fig. A.5.
5.7. EPIC 213786701 – HD 173657
This star has a literature rotation period of P rot = 1.93789 ± 0.00005 d derived from ASAS-3 photometry (Hümmerich et al. 2016). Recently, a non-detection of a large-scale magnetic field with an upper limit of ~80 G, a projected surface rotational velocity of ν sin i = 91 ± 5 km s−1 and a rotation period of Prot = 1.94 ± 0.05 d for HD 173657 was reported by Buysschaert et al. (2018b). In this work, we measure a rotation period of Prot = 1.93810 ± 0.00006 d, which is significantly different from the value from Hümmerich et al. (2016). The summary figure of EPIC 213786701 is shown in Fig. A.6.
5.8. EPIC 214197027 – HD 173857
We report the first measurement of the rotation period of Prot = 1.7349 ± 0.0003 d for HD 173857. The summary figure of EPIC 214197027 is shown in Fig. A.7.
5.9. EPIC 214775703 – HD 178786
We report the first measurement of the rotation period of Prot = 1.76413 ± 0.00004 d for HD 178786. The summary figure of EPIC 214775703 is shown in Fig. A.8.
5.10. EPIC 215357858 – HD 174356
This star has a literature rotation period of Prot = 4.0431 ± 0.0003 d derived from ASAS-3 photometry (Hümmerich et al. 2016). In this work, we measure a rotation period of Prot = 4.045 ± 0.003 d, which is consistent with the literature value from Hümmerich et al. (2016). The summary figure of EPIC 215357858 is shown in Fig. A.9. However, a second period is detected in the amplitude spectrum of HD 174356, which is not well-resolved from the harmonic of the measured rotation period. This suggests that HD 174356 may be a binary or multiple system similar to the magnetic Bp star Atlas (White et al. 2017); this has not been noted in previous studies. The light curve of HD 174356 has the characteristic signature of migrating spots on the surface of a cool star with a large convective envelope like the Sun, for which differential latitudinal surface rotation is common. However, HD 174356 has a spectral type of B9 Si (Renson & Manfroid 2009) and migrating spots on the surface of a hot and candidate magnetic star is not expected and would imply a large amount of differential latitudinal surface rotation. Clearly, further study of this system is needed to resolve the intrinsic variability of this star.
5.11. EPIC 215431167 – HD 174146
This star has a literature rotation period of Prot = 11.185 ± 0.001 d derived from ASAS-3 photometry (Hümmerich et al. 2016). In this work, we measure a rotation period of Prot = 11.1820 ± 0.0005 d, which is significantly different yet more precise than the value from Hümmerich et al. (2016). The summary figure of EPIC 215431167 is shown in Fig. A.10.
5.12. EPIC 215584931 – HD 172480
This star has a literature rotation period of Prot = 0.87134 ± 0.00001 d derived from ASAS-3 photometry (Hümmerich et al. 2016). In this work, we measure a rotation period of Prot = 0.87133 ± 0.00001 d, which is consistent with the literature value from Hümmerich et al. (2016). The summary figure of EPIC 215584931 is shown in Fig. A.11.
5.13. EPIC 215876375 – HD 184343
We report the first measurement of the rotation period of Prot = 7.1987 ± 0.0006 d for HD 184343. The summary figure of EPIC 215876375 is shown in Fig. A.12.
5.14. EPIC 216005035 – HD 182459
We report the first measurement of the rotation period of Prot = 1.26055 ± 0.00002 d for HD 182459. The summary figure of EPIC 216005035 is shown in Fig. A.13.
5.15. EPIC 217323447 – HD 180303
We report the first measurement of the rotation period of Prot = 2.7927 ± 0.0002 d for HD 180303. The summary figure of EPIC 217323447 is shown in Fig. A.14.
5.16. EPIC 218676652 – HD 173406
This star is reported to have unresolved periodic variability by Koen & Eyer (2002), although a rotation period of Prot = 5.095 d is measured by Watson et al. (2006) using photometry from the American Association of Variable Star Observers (AAVSO). A non-detection of a large-scale magnetic field with an upper limit of ~50 G, a rotation period of Prot = 4.6 ± 0.3 d and a projected surface rotational velocity of ν sin i = 38 ± 2 km s−1 were measured by Buysschaert et al. (2018b) for HD 173406. In this work, we measure a rotation period of Prot = 4.562 ± 0.002 d, which is significantly different from the literature value of 5.095 d from Watson et al. (2006). From inspection of the light curve and amplitude spectrum, it is clear that HD 173406 exhibits periodic behaviour over the K2 observations, but the cause of the 0.5 d difference in rotation period compared to the analysis by Watson et al. (2006) is unclear. The summary figure of EPIC 218676652 is shown in Fig. A.15.
5.17. EPIC 218818457 – HD 176330
We report the first measurement of the rotation period of P rot = 13.26 ± 0.01 d for HD 176330. The summary figure of EPIC 218818457 is shown in Fig. A.16.
5.18. EPIC 219198038 – HD 177013
This star has a literature rotation period of Prot = 4.873 d via AAVSO photometry (Watson et al. 2006), and a marginal detection of a magnetic field with a polar strength of Bp ≃ 600 G, a projected surface rotational velocity of ν sin i = 24 ± 6 km s−1, and rotation period of Prot = 4.9 ± 0.3 d from Buysschaert et al. (2018b). In this work, we measure a rotation period of Prot = 4.8730 ± 0.0001 d, which is consistent with the literature values. The summary figure of EPIC 219198038 is shown in Fig. A.17.
5.19. EPIC 224206658 – HD 165972
This star has a literature rotation period of Prot = 2.7596 ± 0.0001 derived from ASAS-3 photometry (Hümmerich et al. 2016), and a magnetic polar field strength of Bp ≃ 1 kG, a projected surface rotational velocity of ν sin i = 29 ± 4 km s−1 and a rotation period of Prot = 2.8 ± 0.1 d from Buysschaert et al. (2018b). In this work, we measure a rotation period of Prot = 2.7596 ± 0.0003 d, which is consistent with the literature value from Hümmerich et al. (2016). The summary figure of EPIC 224206658 is shown in Fig. A.18.
5.20. EPIC 226097699 – HD 166190
We report the first measurement of the rotation period of Prot = 1.1696 ± 0.0001 d for HD 166190. The summary figure of EPIC 226097699 is shown in Fig. A.19.
5.21. EPIC 226241087 – HD 164224
This star has a confirmed large-scale magnetic field with a polar strength of Bp ≃ 1.7 kG, a rotation period of Prot = 0.73 ± 0.01 d and projected surface rotational velocity of ν sin i = 22 ± 4 km s−1 from Buysschaert et al. (2018b). In this work, we measure a rotation period of Prot = 0.73156 ± 0.00001 d, which is consistent with the literature value. The summary figure of EPIC 226241087 is shown in Fig. A.20.
5.22. EPIC 227108971 – HD 164190
We report the first measurement of the rotation period of Prot = 4.657 ± 0.002 d for HD 164190. The summary figure of EPIC 227108971 shown in Fig. A.21.
5.23. EPIC 227373493 – HD 166804
This star has literature rotation periods of Prot = 1.76009 ± 0.00004 d (Bernhard et al. 2015) and Prot = 3.7035 ± 0.0002 d (Hümmerich et al. 2016), both derived using ASAS-3 photometry. More recently, Buysschaert et al. (2018b) confirmed the presence of a large-scale magnetic field with a polar strength of Bp ≃ 1.4 kG, a projected surface rotational velocity of ν sin i = 45 ± 3 km s−1, and a rotation period of Prot = 3.7 ± 0.2 d for HD 166804. We measure a rotation period of Prot = 3.7024 ± 0.0005 d, which is significantly different from the literature value from Hümmerich et al. (2016). The summary figure of EPIC 227373493 is shown in Fig. A.22.
5.24. EPIC 227825246 – HD 164085
This star has a literature rotation period of Prot = 1.22072 ± 0.00002 d derived from ASAS-3 photometry (Hümmerich et al. 2016). We measure a rotation period of Prot = 1.22079 ± 0.00002 d, which is significantly different from the literature value from Hümmerich et al. (2016). The summary figure of EPIC 227825246 is shown in Fig. A.23.
5.25. EPIC 232147357 – HD 153192
This star has a literature rotation period of Prot = 11.357 ± 0.002 d derived using ASAS-3 photometry (Bernhard et al. 2015). We measure a rotation period of Prot = 11.393 ± 0.003 d, which is significantly different from the literature value from Bernhard et al. (2015). The summary figure of EPIC 232147357 is shown in Fig. A.24.
5.26. EPIC 232176043 – HD 152834
This star has a literature rotation period of Prot = 4.2928 ± 0.0003 d derived from ASAS-3 photometry (Hümmerich et al. 2016). Recently, Buysschaert et al. (2018b) confirmed the presence of a large-scale magnetic field with a polar strength of Bp ≃ 700 G, a projected surface rotational velocity of ν sin i = 13 ± 1 km s−1, and a rotation period of Prot = 4.4 ± 0.3 d. We measure a rotation period of Prot = 4.2919 ± 0.0007 d, which is significantly different from the literature value from Hümmerich et al. (2016). The summary figure of EPIC 232176043 is shown in Fig. A.25.
5.27. EPIC 232284277 – HD 155127
This star has a literature rotation period of Prot = 5.5243 ± 0.0004 d derived from ASAS-3 photometry (Hümmerich et al. 2016). Recently, Buysschaert et al. (2018b) confirmed the presence of a large-scale magnetic field with a polar strength of Bp ≃ 1.3 kG, and measured a projected surface rotational velocity of ν sin i = 37 ± 3 km s−1 and a rotation period of Prot = 5.5 ± 0.4 d. We measure a rotation period of Prot = 5.5171 ± 0.0007 d, which is significantly different from the literature value from Hümmerich et al. (2016). The summary figure of EPIC 232284277 is shown in Fig. A.26.
5.28. EPIC 247729177 – HD 284639
We report the first measurement of the rotation period of Prot = 9.155 ± 0.001 d for HD 284639. Although Wraight et al. (2012) commented HD 284639 has no obvious Prot using STEREO photometry, we clearly detect rotational modulation in the K2 light curve and amplitude spectrum for HD 284639. The summary figure of EPIC 247729177 is shown in Fig. A.27.
6. Results: CP stars with rotational modulation and additional variability indicative of pulsations
In this section, we discuss the stars that have measured rotation periods determined using K2 photometry and that also show additional variability indicative of stellar pulsations. The rotational modulation figures are given in Appendix B.
6.1. EPIC 203749199 – HD 152366
This star has recently been confirmed to have a large-scale magnetic field with a polar strength of Bp ≃ 250 G, a measured rotation period of Prot = 3.23 ± 0.01 d, and a projected surface rotational velocity of ν sin i = 23 ± 2 km s−1 by Buysschaert et al. (2018b). In this work, we measure a rotation period of Prot = 3.2308 ± 0.0001 d. The summary figure of EPIC 203749199 is shown in Fig. B.1. We also classify this star as a possible pulsating star because a significant and resolved peak at v = 0.5079 ± 0.0002 d−1 can be seen in the residual amplitude spectrum that is not associated with harmonics of the rotation frequency. However, if separate amplitude spectra for each of the two subsections of the light curve are examined, we find that the amplitude of this peak varies during the two subsections, which span a total of ~960 d. Therefore, we cannot exclude the possibility that this frequency is instrumental. We find no evidence of contamination from a nearby source for this star.
6.2. EPIC 216956748 – HD 181810
We report the first measurement of the rotation period of Prot = 13.509 ± 0.009 d for HD 181810. The summary figure of EPIC 216956748 is shown in Fig. B.2. We also classify this star as a candidate pulsating star because a significant and isolated peak can be seen at 5.9331± 0.0005 d−1 in the residual amplitude spectrum, which cannot be associated with harmonics of the rotation frequency or multiples of the K2 thruster firing frequency. The peak at 5.9331 ± 0.0005 d−1 could be a Nyquist alias frequency of a high-frequency roAp pulsation mode frequency or a δ Sct pulsation mode frequency, therefore further observations at a high cadence are needed to confirm this star as a roAp star. A subharmonic of this peak found at 2.967 ± 0.001 d−1 is also visible in the residual amplitude spectrum of HD 181810, but it has a S/N = 1.4 and so we do not consider it significant. Contamination from a nearby source is unlikely for this star, as the nearest possible source of contamination was not included in our pixel mask.
6.3. EPIC 217437213 – HD 177016
We report the first measurement of the rotation period of Prot = 3.276 ± 0.004 d for HD 177016. The summary figure of EPIC 217437213 is shown in Fig. B.3. We also classify this star as a candidate pulsating star because multiple resolved frequencies can be seen in the g-mode frequency regime in the residual amplitude spectrum, which are not associated with harmonics of the rotation frequency or multiples of the K2 thruster firing frequency. It is possible that the measured rotation period of HD 177016 is a g-mode pulsation frequency, but we conclude this to be unlikely because of the six significant harmonics. We find no evidence of contamination from a nearby source for this star. Regardless, this CP star clearly has variability indicative of pulsations and warrants further study.
6.4. EPIC 223573464 – HD 161851
We report the first measurement of the rotation period of Prot = 1.6209 ± 0.0007 d for HD 161851. The summary figure of EPIC 223573464 is shown in Fig. B.4. We also classify this star as a candidate pulsating star because a significant low-frequency power excess can be seen between 0.1 ≤ ν ≤ 3.0 d−1 in its original and residual amplitude spectra, and its light curve exhibits multi-periodic variability. The low-frequency power excess, shown in Fig. B.4, could be caused by unresolved g-mode pulsation frequencies making HD 161851 a candidate SPB star since it has a spectral type of A0 Si (Renson & Manfroid 2009). The observed power-law nature is similar to that seen in numerical simulations of stochastically excited gravity waves (Rogers et al. 2013; Rogers 2015; Aerts & Rogers 2015; Aerts et al. 2017a, 2018a; Simón-Díaz et al. 2018). However, contamination from a neighbouring cool star, for example a γ Dor star, is a likely explanation since HD 161851 lies within a crowded region. On the other hand, the low-frequency power excess could be caused by the quality of the K2 photometry and reduction, but we find this unlikely because of the broad range and high amplitude of the observed power excess.
6.5. EPIC 225191577 – HD 164068
We report the first measurement of the rotation period of Prot = 2.4130 ± 0.0003 d for HD 164068. The summary figure of EPIC 225191577 is shown in Fig. B.5. We also classify this star as a candidate pulsating star because multiple significant peaks can be seen in the residual amplitude spectrum that are not associated with harmonics of the rotation frequency or multiples of the K2 thruster firing frequency. We interpret these peaks as possible g- and p-mode pulsation frequencies that are within the typical frequency range for δ Sct stars (Bowman 2017; Bowman & Kurtz 2018). On the other hand, contamination from a background or nearby and possible companion star seems a likely explanation since HD 164068 lies within a crowded region. The nearest significant source of contamination to HD 164068 is J18002338-2258032, which is 15 arcsec away and 2.5 mag fainter in V so flux from this star may be bleeding into the aperture mask of the target star. If the pulsation modes originate in this neighbouring star, their amplitudes are being diluted by a factor of 10 in flux, making them of order 5 mmag, which is within the typical p-mode amplitude range observed in δ Sct stars (Bowman 2017; Bowman & Kurtz 2018). Therefore, it remains unclear if the observed pulsation modes originate in HD 164068, a companion, or contaminating star.
6.6. EPIC 225990054 – HD 158596
This star has a literature rotation period of Prot = 2.02206 ± 0.00005 d derived using ASAS-3 photometry (Bernhard et al. 2015). Furthermore, this star was recently confirmed to have a large-scale magnetic field with a polar strength of Bp ≃ 1.8 kG, a rotation period of Prot = 2.02 ± 0.02 d, and a projected surface rotational velocity of ν sin i = 60 ± 3 km s−1 by Buysschaert et al. (2018b). In this work, we measure a rotation period of Prot = 2.02208 ± 0.00003 d, which is consistent with the literature value from Bernhard et al. (2015). The summary figure of EPIC 225990054 is shown in Fig. B.6.
Similar to Buysschaert et al. (2018b), we detect a significant isolated peak in the residual amplitude spectrum of HD 158596 at 17.0074 ± 0.0004 d−1, and interpret it as a Nyquist alias frequency of a high-frequency pulsation mode. This frequency is the only significant peak found in the residual amplitude spectrum of HD 158596 and is present in both subsections (i.e. C09 and C11) of the K2 light curve. We postulate that this frequency is a Nyquist alias and not an intrinsic p-mode frequency since mono-periodic δ Sct stars appear to be rare when using high-quality space photometry. For example, from a sample of 983 δ Sct stars observed by the nominal Kepler mission, Bowman et al. (2016) find only four such stars, i.e. less than half a percentage as an occurrence rate. Furthermore, the spectral type of HD 158596 is B9 Si, which places it outside of the δ Sct instability strip. We note that HD 158596 was observed by the K2 mission in campaigns 09 and 11, such that a significant gap is present in the available observations. This results in a complex window pattern structure in its amplitude spectrum, especially around the K2 thruster firing frequency.
Contamination from a neighbouring faint source is also a possible explanation. HD 158596 has a nearby star with an angular separation of 0.3 arcsec (ESA 1997; Fabricius et al. 2002) making it a visual double star and possibly part of a close-binary system, although no evidence of the companion star was found in spectroscopy of HD 158596 by Buysschaert et al. (2018b). Highcadence photometry of HD 158596 is required to confirm that the peak at 17.0074 ± 0.0004 d−1 is a Nyquist alias of a high-frequency roAp pulsation mode.
6.7. EPIC 227231984 – HD 158336
This star has a literature rotation period of Prot = 1.76009 ± 0.00004 d derived using ASAS-3 photometry (Bernhard et al. 2015). We measure a rotation period of Prot = 1.7609 ± 0.0008 d, which is consistent with the literature value from Bernhard et al. (2015). The summary figure of EPIC 227231984 is shown in Fig. B.7. We also classify this star as a candidate pulsating star because a significant low-frequency power excess can be seen between 0.1 ≤ ν ≤ 3.0d−1 in its original and residual amplitude spectra. This power excess could be caused by unresolved g-mode pulsation frequencies, making HD 158336 a candidate SPB star since it has a spectral type of B9 Si (Renson & Manfroid 2009). The observed power-law nature is similar to that seen in numerical simulations of stochastically excited gravity waves (Rogers et al. 2013; Rogers 2015; Aerts & Rogers 2015; Aerts et al. 2017a, 2018a; Simón-Díaz et al. 2018). It is difficult to exclude an imperfect reduction as a possible cause of the low-frequency power excess, but we find this unlikely because of the broad range and high amplitude of the observed power excess.
6.8. EPIC 227305488 – HD 166542
We report the first measurement of the rotation period of Prot = 3.6331 ± 0.0003 d for HD 166542. The summary figure of EPIC 227305488 is shown in Fig. B.8. We also classify this star as a candidate pulsating star because an isolated peak at 16.429 ± 0.004 d−1 can be seen in the residual amplitude spectrum, which is not associated with a harmonic of the rotation frequency or a multiple of the K2 thruster firing frequency. Contamination from a neighbouring source is also possible since HD 166542 lies within in a crowded region. This peak could be a Nyquist alias of a high-frequency pulsation mode, thus highcadence photometry of HD 166542 is required to confirm this star as a roAp star and determine the frequency of its intrinsic pulsation modes.
6.9. EPIC 228293755 – HD 165945
We report the first measurement of the rotation period of Prot = 2.13522 ± 0.00008 d for HD 165945. The summary figure of EPIC 228293755 is shown in Fig. B.9. We also classify this star as a candidate pulsating star because two significant peaks can be seen in the residual amplitude spectrum that are not associated with harmonics of the rotation frequency or multiples of the K2 thruster firing frequency. Contamination is possible for HD 165945 since it lies within a region with multiple faint background sources. We interpret these peaks as g-mode pulsation frequencies, thus HD 165945 warrants further study to establish these pulsations originate in the target or a background source.
6.10. EPIC 230753303 – HD 153997
We report the first measurement of the rotation period of Prot = 5.4966 ± 0.0006 d for HD 153997. The summary figure of EPIC 230753303 is shown in Fig. B.10. We also classify this star as a candidate pulsating star because a significant peak can be seen in the residual amplitude spectrum that is not associated with a harmonic of the rotation frequency or a multiple of the K2 thruster firing frequency. Contamination from a neighbouring source is also possible for HD 153997. We interpret this peak as a g-mode pulsation frequency, thus HD 153997 warrants further study to establish if this variability originates in the target or a background source.
7. Results: CP stars with intrinsic variability indicative of stellar pulsations yet lacking significant photometric rotational modulation
In this section, CP stars in our sample that show no evidence of rotational modulation, but show variability indicative of pulsations are discussed. For pulsating stars, and especially for g modes, it is difficult to extract individual pulsation mode frequencies, because of the poor frequency resolution of a ~80-d light curve being of order 0.01 d−1. It is known that g and p modes can be spaced closer than 0.001 d−1 in frequency (Bowman et al. 2016; Bowman 2017), which produces complex beating patterns and an unresolved power excess in an amplitude spectrum instead of individual pulsation mode frequencies.
In our sample of CP stars, we find five stars that show variability consistent with multiple g-mode pulsation frequencies and one star that shows variability consistent with multiple p-mode pulsation frequencies. In all cases, a rotation period was purposefully not determined for these stars because of the likelihood that peaks in the low frequency (0 ≤ ν ≤ 4) are either (unresolved) g-mode pulsation frequencies or combination frequencies of p-mode pulsation frequencies (see e.g. Degroote et al. 2009, 2012; Thoul et al. 2013; Kurtz et al. 2015; Bowman 2017). The available K2 photometry and amplitude spectra are shown in Appendix C; all the significant (pulsation mode) frequencies are identified by vertical blue lines in the residual amplitude spectrum and significant peaks are defined as those that have an amplitude S/N ≥ 4 (Breger et al. 1993).
7.1. EPIC 202060145
This star is a member of the open cluster M67 and has been determined to be part of a double star system using speckle interferometry obtained at the US naval observatory, but a binary orbit solution is yet to be determined (Mason et al. 2002, 2004; Hartkopf & Mason 2011). A dominant period of 1.1472 d was measured by Armstrong et al. (2015) using an automated classification algorithm applied to the K2 photometry, but this period was labelled as quasi-periodic. In this work, we measure a dominant period of 1.1456 ± 0.0008 d using K2 photometry, but the amplitude spectrum of EPIC 202060145 clearly contains multiple low-frequency peaks that we interpret as g-mode pulsation frequencies. Since EPIC 202060145 is part of close double-star system, it is possible that the observed pulsation mode frequencies originate from the unseen companion. The summary figure of EPIC 202060145 is shown in Fig. C.1.
7.2. EPIC 203917770 – HD 145792
This star has been confirmed to have a large-scale magnetic field (Thompson et al. 1987) and part of a close-binary system with a projected surface rotational velocity of ν sin i = 30 ± 8 km s−1 by Zorec & Royer (2012). The spectral type of HD 145792 is B6 He weak from the Renson & Manfroid (2009) catalogue making this star a CP 4 star. The rotation period of HD 145792 is somewhat disputed as Renson & Manfroid (2009) measure a value of Prot of 0.8478 d from spectroscopy and Wraight et al. (2012) measure approximately twice this value, i.e. Prot = 1.6956 ± 0.0005 d using STEREO photometry. In this work, we measure a dominant period of 0.84815 ± 0.00006 d, which is similar to the value found by Renson & Manfroid (2009) and approximately half the rotation period from Wraight et al. (2012). The summary figure of EPIC 203917770 is shown in Fig. C.2. A comparable dominant period of 0.847862 d was also measured by Armstrong et al. (2016) using an automated classification algorithm applied to K2 photometry, although the physical cause of the variability was not discussed in detail. We interpret the variability in HD 145792, specifically the isolated peaks in its amplitude spectrum, as g-mode pulsation frequencies. None of the low-frequency peaks have a significant harmonic, thus are unlikely to represent rotational modulation caused by surface abundance inhomogeneities. Since this star is part of a close-binary system, we cannot exclude contamination as the source of the observed pulsational variability.
7.3. EPIC 206120416 – HD 210424
This star has a literature rotation period of P rot = 3.9613 ± 0.0033 d derived from STEREO photometry (Wraight et al. 2012). However, the corresponding frequency peak has an amplitude less than 80 μmag and S/N < 1.0 in our K2 photometry thus it is not significant. We find no evidence of contamination from a nearby source for this star. We measure a dominant period of P = 1.4478 ± 0.0005 d (ν = 0.6907 ± 0.0005 d−1); a comparable dominant period of 1.4465 d is also measured by Armstrong et al. (2016) via an automated classification algorithm applied to K2 photometry, although the physical cause of this variability was not discussed by Armstrong et al. (2016). The summary figure of HD 210424 is shown in Fig. C.3, in which three relatively high-amplitude peaks at ν1 = 0.4738 ± 0.0006 d−1, ν2 = 0.6907 ± 0.0005 d−1 and ν3 = 0.959 ± 0.001 d−1 can be seen in the amplitude spectrum.
Upon first inspection, it would appear that possible harmonics of a possible rotation frequency are within the amplitude spectrum (i.e. 2ν1 = ν3) given the Rayleigh frequency resolution (0.0145 d−1) of our data. However, given the large variance in the residual amplitude spectra of HD 210424 around these frequencies, it is clear that they are not well-resolved in the limited length of the 67.7-d K2 observations. This, coupled with the fact that none of these frequencies are compatible with the literature rotation period for this star from Wraight et al. (2012), led us to the conclusion that these low-frequency peaks and the low-frequency power excess is caused by the beating of multiple unresolved pulsation mode frequencies (see e.g. Degroote et al. 2011; Bowman et al. 2016; Bowman 2017).
From inspection of the light curve and amplitude spectrum in Fig. C.3, HD 210424 is clearly a multi-periodic pulsator, so caution is needed when identifying the correct rotation frequency caused by surface abundance inhomogeneities. To that end, we include Prot = 2.111 ± 0.003 d using ν1 as a possible rotation period for HD 210424 in Table 3. If ν1 is indeed the rotation frequency and ν3 is its harmonic, this does not explain the dominant frequency ν2, nor does it explain the low-frequency power excess, which has amplitudes of order 200 μmag at frequencies between 0 < ν < 1.5d−1. We conclude that HD 210424 is a multi-periodic pulsator with an amplitude spectrum that can be explained by multiple unresolved g modes with possible amplitude and/or frequency modulation (see e.g. Degroote et al. 2011; Bowman et al. 2016; Bowman 2017), or travelling gravity waves (Rogers et al. 2013; Rogers 2015; Aerts & Rogers 2015; Aerts et al. 2017a, 2018a; Simón-Díaz et al. 2018).
7.4. EPIC 206326769 – HD 211838
This star is reported as a spectroscopic binary (SB1) and has a ND for a large-scale magnetic field (Makaganiuk et al. 2011), as expected for a CP 3 star with a spectral type of B8 MgMn (Renson & Manfroid 2009). More recently, a study by Paunzen et al. (2013) measured a rotation period of Prot = 6.5633 ± 0.0063 d using STEREO photometry and a projected surface rotational velocity of ν sin i = 65.0 ± 6.9 km s−1 for HD 211838. The summary figure for our K2 observations of EPIC 206326769 is shown in Fig. C.4. The rotation period measured by Paunzen et al. (2013) is not statistically significant in our K2 photometry becasue it has an amplitude of less than 100 μHz and S/N < 4. Most interestingly, Paunzen et al. (2013) also report the presence of γ Dor and δ Sct pulsations in HD 211838. In our K2 photometry, we measure a dominant period of P = 1.1203 ± 0.0002 d (ν = 0.892 ± 0.0002 d−1). A comparable dominant period of 1.119692 d was also measured by Armstrong et al. (2016) using an automated classification algorithm applied to K2 photometry, although the physical cause of this variability was not discussed in detail. We also detect three additional frequencies in the amplitude spectrum of HD 211838, which are 0.4746 ± 0.0002 d−1, 0.3927 ± 0.0005 d−1, and 0.3251 ± 0.0005 d−1, but the latter two have S/N = 3.6 and so are not shown as vertical blue lines in Fig. C.4. We interpret the variability in HD 211838, specifically the isolated peaks in its amplitude spectrum, as pulsation mode frequencies. The low-frequency peaks are likely g-mode pulsation frequencies and not rotational modulation caused by surface abundance inhomogeneities. Contamination from the companion binary star or background sources is also possible for HD 211838 since it is a bright star in a SB1 system and requires a large pixel mask that likely contains flux from other stars.
7.5. EPIC 224947037 – HD 162814
We measure a dominant period of P = 0.66203 ± 0.00008 d (ν = 1.5105 ± 0.0002 d−1) for HD 162814 and interpret its variability as multi-periodic pulsation mode frequencies. The summary figure of EPIC 224947037 is shown in Fig. C.5. The low-frequency peaks are likely g-mode pulsation frequencies and not rotational modulation caused by surface abundance inhomogeneities because no significant harmonics of any frequencies were detected in the amplitude spectrum. We detect a possible rotation period of Prot = 8.62 ± 0.07 d (ν = 0.116 ± 0.001 d−1) for HD 162814, which has an amplitude of 166 ± 9 μmag and a S/N = 5.7 in the amplitude spectrum, but it has no significant harmonics. This frequency may be a (difference) combination frequency of the dominant frequency at 1.5105 ± 0.0002 d−1 and a frequency peak at 1.39 ± 0.01 d−1, the latter of which has S/N ≃ 3.5, so it is not significant. Contamination is also a possible explanation of the multiple pulsation mode frequencies in the light curve and amplitude spectrum of HD 162814, as it lies within a crowded field.
7.6. EPIC 246152326 – HD 220556
HD 220556 is one of the more interesting stars in our sample because of its rich pulsation frequency spectrum; its summary figure is shown in Fig. C.6. We find no significant evidence of rotational modulation consistent with surface abundance inhomogeneities in the multi-periodic light curve of HD 220556. From studying the pixel masks for HD 220556, we also find no evidence of contamination from a nearby or background source. There are, however, multiple observed frequencies between 10 ≤ ν ≤ 22 d−1 in the amplitude spectrum of HD 220556.
It should be noted that the spectral type of HD 220556 is given as A2 SrEuCr by Renson & Manfroid (2009), but this star is listed as Ap SrEuCr in the Michigan catalogue (Houk & Swift 1999). Furthermore, HD 220556 is included in the AAVSO Photometric All-Sky Survey (APASS) of RAdial Velocity Experiment (RAVE) stars, and Munari et al. (2014) derive an approximate effective temperature of Teff ≃ 7500 K. This places HD 220556 within the classical instability strip with theoretical pulsation models for main-sequence δ Sct stars predicting p-mode pulsation frequencies between 5 ≲ ν ≲ 70 d−1 (Pamyatnykh 1999, 2000). Therefore, we conclude that HD 220556 is a multi-periodic δ Sct pulsator.
With only LC K2 data, we are unable to probe frequencies above the LC Nyquist frequency of 24.47 d−1. Furthermore, only ~80 d of K2 data prevents us from applying the super-Nyquist technique developed by Murphy et al. (2013), which requires at least 1 yr of Kepler observations to distinguish Nyquist alias and real frequencies in an amplitude spectrum. If the observed frequencies between 10 ≲ ν ≲ 20 d−1 are in fact Nyquist alias frequencies of high-frequency p modes, then the real pulsation modes would lie either between 27 ≲ ν ≲ 39 d−1 or between 52 ≲ ν ≲ 64 d−1. The observed and two possible frequency regimes are plausible, yet high-frequency p modes are expected and more commonly observed in hot δ Sct stars (Baglin et al. 1973; Breger 2000; Bowman & Kurtz 2018). The real pulsation modes would also have higher amplitudes than their Nyquist aliases (Murphy et al. 2013; Bowman et al. 2016). Therefore the detection of p modes in a CP star, which is expected to have a large-scale magnetic field, is an interesting discovery and warrants further study since a strong large-scale magnetic field is predicted to damp low-overtone p modes (Saio 2005, 2014). If such a field exists in HD 220556, it is as yet to be determined.
8. Discussion and conclusions
We have searched for variability in the light curves of 56 CP 2, 3 and 4 stars using high-quality optimised photometry from the K2 space mission. For 12 stars in our sample, we do not detect any significant photometric variability, so we conclude that if these stars are photometrically variable then their rotation periods must be comparable or longer than the available ~80 d of K2 space photometry. This is certainly the case for EPIC 214503319 (HD 177765), which is a known magnetic star with a literature rotation period of Prot ≫ 5 yr (Mathys et al. 1997; Mathys 2017); our detection of the Nyquist alias of its high-frequency roAp pulsation modes is shown in Fig. 2.
We detect rotational modulation caused by surface abundance inhomogeneities and measure the rotation period of 38 stars in our sample, of which 16 are new detections that were previously unknown in the literature. Our results for all CP stars for which a rotation period using K2 space photometry are summarised in Table 3, including a comparison to literature values if they are available. We also show the distribution of the rotation periods for the 38 CP stars in Fig. 4, in which the grey region denotes all 38 stars in our sample with measured rotation periods, and the red and blue hatched regions denoting the candidate pulsators and known magnetic stars, respectively. The majority of our stars are moderate to slow rotators with rotation periods that range from Prot = 0.73156 ± 0.00001 d in EPIC 226241087 (HD 164224) to Prot = 15.733 ± 0.002 d in EPIC 210964459 (HD 26571), which are typical for ApBp stars (see e.g. Adelman 2002; Mathys 2004). However, since only ~80 d of K2 photometry is available for a star in each K2 campaign, our results are limited to stars with rotation periods shorter than the length of the available K2 data.
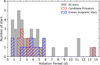 |
Fig. 4. Distribution of rotation periods for all 38 CP stars for which a rotation period is determined is shown in black. The distribution for the subset of candidate pulsating CP stars is shown in red, and those that have confirmed large-scale magnetic fields are shown in blue. |
The majority of the CP stars in our sample show clear rotational modulation in the K2 space photometry, and as theory predicts, these stars with surface abundance inhomogeneities should host a large-scale magnetic field (Stibbs 1950). A precise determination of the rotation period of a magnetic CP star is important for determining the topology of the magnetic field in a star, including if the magnetic field is more complex than a simple dipolar field (see e.g. Shultz et al. 2018). We have successfully identified pulsating CP stars that are preferred targets to follow up with high-resolution spectropolarimetry to confirm their spectral type, rotation period, and quantify the strength of the magnetic field at the stellar surface.
However, there are notable examples of stars within our sample for which we determine a rotation period that is significantly different from other studies. For example, we calculate a rotation period of 2.403 ± 0.002 d using K2 photometry for EPIC 203092367 (HD 150035), whereas Wraight et al. (2012) determined a rotation period of 2.3389 ± 0.0013 d using STEREO photometry.There are also stars in our sample for which we detect a clear rotation period yet other studies do not (e.g. EPIC 210964459; HD 26571), and vice versa. These differences only occur for a minority of stars in our sample, but highlight the need to investigate the stability of rotational modulation and its impact on determining stellar rotation periods in CP stars.
We identify ten CP stars with clear and periodic rotational modulation caused by stable surface abundance inhomogeneities, but also show variability caused by stellar pulsations. After extracting the rotational modulation in these stars, we find significant peaks in the residual amplitude spectra of these stars that are likely pulsation mode frequencies since they were not associated with harmonics of the rotation frequency or K2 thruster firing frequencies. It is true that contamination from a background star, binary companion, or a neighbouring star could be responsible for the significant frequency peaks in these stars, yet we made sure to minimise sources of contamination when creating our customised pixel masks for each star. There is also no obvious dependence of the detection of pulsations and the spectral types of these stars. Of course, our study is not the first detection of pulsations in intermediate-mass CP stars. For example, δ Sct stars with chemical peculiarities include HD 41641 (Escorza et al. 2016) and HD 188774 (Neiner & Lampens 2015), the latter of which has also been confirmed to host a magnetic field using spectropolarimetry.
One star in our sample, EPIC 214503319 (HD 177765), is a known roAp pulsator (Alentiev et al. 2012), for which we detect the Nyquist alias frequency in our K2 observations as shown in Fig. 2. We also identify three stars as candidate roAp stars, EPIC 225990054 (HD 158596), EPIC 227305488 (HD 166542), and EPIC 216956748 (HD 181810), since only a single isolated peak is present in their residual amplitude spectra that could be a Nyquist alias of a high-frequency roAp pulsation mode. We note that EPIC 225990054 (HD 158596) was previously identified as a candidate roAp pulsator by Buysschaert et al. (2018b). In the future, we will obtain high-cadence ground-based photometry of these stars to confirm the presence of high-frequency roAp pulsation modes in these stars, which would represent a further increase in the members of this rare type of pulsating magnetic CP star.
Furthermore, we find six stars that show multiple frequencies in their amplitude spectra that are indicative of stellar pulsations, yet lack rotational modulation: i.e. EPIC 202060145, EPIC 203917770 (HD 145792), EPIC 206120416 (HD 210424), EPIC 206326769 (HD 211838), EPIC 224947037 (HD 162814), and EPIC 246152326 (HD 220556). It should be noted that three of these stars have literature rotation periods, but we find no significant evidence that these literature rotation periods are correct according to our K2 photometry. This, coupled with the fact that all of these six stars are multi-periodic, lead us to the conclusion that these stars are intrinsically variable from pulsation modes. Unfortunately, a single ~80-d campaign of K2 space photometry is insufficient to confidently extract pulsation mode frequencies, which can be spaced as close as 0.001 d−1 (Bowman et al. 2016; Bowman 2017), and our observations are not long enough to sufficiently resolve pulsation mode frequencies spaced closer than 0.013 d−1 in the best of cases. In the near future, the Transiting Exoplanet Survey Satellite (TESS) will provide high-quality photometry across almost the entire sky with time spans up to 1 yr in its two continuous viewing zones (Ricker et al. 2015). The TESS mission will increase the available photometry of many previously studied stars, and allow us to vastly expand our search for pulsating magnetic stars.
The rapidly rotating B9 star HD 174648 was studied by Degroote et al. (2011) using ~30 d of CoRoT photometry and these authors concluded that the significant frequencies detected in the amplitude spectrum were unlikely to be g modes because the star has an effective temperature of Teff = 11 000 ± 1000 K and a surface gravity of log g = 4.2 ± 0.3 cm s−2. Thus HD 174648 is in between the cool edge of the SPB g-mode instability region and the hot edge of the classical instability strip, which is similar to many of the CP stars in our study. Degroote et al. (2011) performed a detailed study to investigate whether closely spaced frequencies separated by 0.05 d−1 could be explained by latitudinal surface differential rotation in HD 174648; the measured frequency splittings correspond to approximately 1% difference in the equatorial and polar surface rotation periods. Clearly, distinguishing g-mode pulsation frequencies and differential latitudinal surface rotation is non-trivial, especially since pulsation mode frequencies can be spaced closer than 0.001 d−1 (Bowman et al. 2016; Bowman 2017).
The CP stars in our sample, which unlike the fast-rotating B9 star HD 174648 (Degroote et al. 2011), have rotation periods of order days and are expected to have large-scale magnetic fields that instigate uniform rotation within their radiative envelopes (Moss 1992; Browning et al. 2004a,b; Mathis & Zahn 2005; Zahn 2011). Furthermore, the relatively short time spans of K2 mission data coupled with their slow rotation periods severely limits the ability to detect differential latitudinal surface rotation. In the best cases for stars with ~80 d of K2 photometry is available; this corresponds to a Rayleigh frequency resolution of approximately 0.01 d−1 meaning that rotationally split pulsation modes and/or differential latitudinal surface rotation is unlikely to be detectable for slowly rotating CP stars. As also stated by Degroote et al. (2011), it is difficult to impossible to differentiate between unresolved pulsation mode frequencies and (latitudinal surface differential) rotational modulation with photometric data of limited length.
The discovery of pulsations in a non-negligible fraction of CP stars using K2 space photometry make these stars high-priority targets for spectropolarimetric follow-up campaigns to confirm the presence of a large-scale magnetic field. Magnetic pulsating stars are rare and provide the opportunity to test theoretical models of pulsation in the presence of a magnetic field (see e.g. Shibahashi & Aerts 2000; Neiner et al. 2012a; Handler et al. 2012; Briquet et al. 2012; Henrichs et al. 2013; Buysschaert et al. 2017b, 2018a). This is especially true for roAp stars with currently only 61 of these pulsators known; see Smalley et al. (2015) and Joshi et al. (2016) for recent catalogues. Almost all of the CP stars identified as pulsator candidates in our study are bright (V ≲ 10 mag), making them preferred targets for ground-based follow-up spectropolarimetric campaigns to confirm their spectral type and rotation period, and the topology of their magnetic field, if present. This is especially true for the three stars identified in our study as candidate roAp stars, HD 158596, HD 166542, and HD 181810, and the candidate magnetic δ Sct star HD 220556.
The relatively poor frequency resolution and quality of K2 photometry compared to the original 4-yr Kepler mission, also has large implications for the successful application of asteroseismology in terms of forward seismic modelling (see Buysschaert et al. 2018a and Aerts et al. 2018b). Specifically, asteroseismic studies require multiple pulsation mode frequencies to be uniquely identified in terms of their geometry (i.e. radial order n, angular degree ℓ, and azimuthal order m). For g modes in main-sequence B, A, and F stars, the commonly used method of mode identification is to use period spacing patterns (see e.g. Degroote et al. 2010; Van Reeth et al. 2015; Pápics et al. 2015, 2017), which allow the physics of the near-core region to be probed. This method of mode identification is non-trivial even for stars with high-quality observations spanning years, such as the nominal Kepler mission. The quantitative comparison of observed pulsation mode frequencies with theoretical predictions requires long-term data sets in order to achieve a good frequency resolution. Our study clearly demonstrates that a non-negligible fraction of CP stars are candidate pulsators. Light curves of sufficient frequency resolution to perform asteroseismic modelling for many CP stars are expected in the near future by the TESS mission (Ricker et al. 2015) and later from the PLATO mission (Rauer et al. 2014).
SIMBAD website: http://simbad.u-strasbg.fr/simbad/
MAST website: http://archive.stsci.edu/kepler/
Acknowledgments
We thank the referee for his or her comments that improved the manuscript, and the Kepler/K2 science teams for providing such excellent data. Funding for the Kepler/K2 mission is provided by NASA’s Science Mission Directorate. The K2 data presented in this paper were obtained from the Mikulski Archive for Space Telescopes (MAST). Support for MAST for non-HST data is provided by the NASA Office of Space Science via grant NNX09AF08G and by other grants and contracts. The research leading to these results has received funding from the European Research Council (ERC) under the European Union’s Horizon 2020 research and innovation programme (grant agreement No670519: MAMSIE). This research has made use of the SIMBAD database, operated at CDS, Strasbourg, France; the SAO/NASA Astrophysics Data System; and the VizieR catalogue access tool, CDS, Strasbourg, France.
References
- Abt, H. A. 1961, ApJS, 6, 37 [NASA ADS] [CrossRef] [Google Scholar]
- Abt, H. A. 1967, in Magnetic and Related Stars, ed. R. C. Cameron, 173 [Google Scholar]
- Abt, H. A. 2009, AJ, 138, 28 [NASA ADS] [CrossRef] [Google Scholar]
- Abt, H. A., & Levy, S. G. 1985, ApJS, 59, 229 [NASA ADS] [CrossRef] [Google Scholar]
- Abt, H. A., & Morrell, N. I. 1995, ApJS, 99, 135 [Google Scholar]
- Abt, H. A., & Snowden, M. S. 1973, ApJS, 25, 137 [NASA ADS] [CrossRef] [Google Scholar]
- Adelman, S. J. 2002, Balt. Astron., 11, 475 [NASA ADS] [Google Scholar]
- Adelman, S. J. 2008, PASP, 120, 595 [NASA ADS] [CrossRef] [Google Scholar]
- Aerts, C., & Rogers, T. M. 2015, ApJ, 806, L33 [NASA ADS] [CrossRef] [Google Scholar]
- Aerts, C., Christensen-Dalsgaard, J., & Kurtz, D. W. 2010, Asteroseismology (Berlin: Springer-Verlag) [Google Scholar]
- Aerts, C., Molenberghs, G., Kenward, M. G., & Neiner, C. 2014, ApJ, 781, 88 [NASA ADS] [CrossRef] [Google Scholar]
- Aerts, C., Símon-Díaz, S., Bloemen, S., et al. 2017a, A&A, 602, A32 [NASA ADS] [CrossRef] [EDP Sciences] [Google Scholar]
- Aerts, C., Van Reeth, T., & Tkachenko, A. 2017b, ApJ, 847, L7 [NASA ADS] [CrossRef] [Google Scholar]
- Aerts, C., Bowman, D. M., Símon-Díaz, S., et al. 2018a, MNRAS, 476, 1234 [NASA ADS] [CrossRef] [Google Scholar]
- Aerts, C., Molenberghs, G., Michielsen, M., et al. 2018b, ApJS, 237, 15 [NASA ADS] [CrossRef] [Google Scholar]
- Aigrain, S., Hodgkin, S. T., Irwin, M. J., Lewis, J. R., & Roberts, S. J. 2015, MNRAS, 447, 2880 [NASA ADS] [CrossRef] [Google Scholar]
- Aigrain, S., Parviainen, H., & Pope, B. J. S. 2016, MNRAS, 459, 2408 [NASA ADS] [Google Scholar]
- Aigrain, S., Parviainen, H., Roberts, S., Reece, S., & Evans, T. 2017, MNRAS, 471, 759 [NASA ADS] [CrossRef] [Google Scholar]
- Alecian, E., Villebrun, F., Grunhut, J., et al. 2017, ArXiv e-prints [arXiv:1705.10650] [Google Scholar]
- Alentiev, D., Kochukhov, O., Ryabchikova, T., et al. 2012, MNRAS, 421, L82 [NASA ADS] [Google Scholar]
- Antoci, V., Cunha, M., Houdek, G., et al. 2014, ApJ, 796, 118 [NASA ADS] [CrossRef] [Google Scholar]
- Armstrong, D. J., Kirk, J., Lam, K. W. F., et al. 2015, A&A, 579, A19 [NASA ADS] [CrossRef] [EDP Sciences] [Google Scholar]
- Armstrong, D. J., Kirk, J., Lam, K. W. F., et al. 2016, MNRAS, 456, 2260 [NASA ADS] [CrossRef] [Google Scholar]
- Aurière, M., Silvester, J., Wade, G. A., et al. 2004, IAU Symp., 224, 633 [Google Scholar]
- Auvergne, M., Bodin, P., Boisnard, L., et al. 2009, A&A, 506, 411 [NASA ADS] [CrossRef] [EDP Sciences] [Google Scholar]
- Babcock, H. W. 1960, ApJ, 132, 521 [NASA ADS] [CrossRef] [Google Scholar]
- Baglin, A., Breger, M., Chevalier, C., et al. 1973, A&A, 23, 221 [NASA ADS] [Google Scholar]
- Baglin, A., Auvergne, M., Barge, P., et al. 2006, ESA SP, 1306, 33 [Google Scholar]
- Bailey, J. D., & Landstreet, J. D. 2013, MNRAS, 432, 1687 [NASA ADS] [CrossRef] [Google Scholar]
- Bernhard, K., Hümmerich, S., Otero, S., & Paunzen, E. 2015, A&A, 581, A138 [NASA ADS] [CrossRef] [EDP Sciences] [Google Scholar]
- Bigot, L., & Dziembowski, W. A. 2002, A&A, 391, 235 [NASA ADS] [CrossRef] [EDP Sciences] [Google Scholar]
- Bigot, L., & Kurtz, D. W. 2011, A&A, 536, A73 [NASA ADS] [CrossRef] [EDP Sciences] [Google Scholar]
- Bigot, L., Provost, J., Berthomieu, G., Dziembowski, W. A., & Goode, P. R. 2000, A&A, 356, 218 [NASA ADS] [Google Scholar]
- Bohlender, D. A., Landstreet, J. D., & Thompson, I. B. 1993, A&A, 269, 355 [NASA ADS] [CrossRef] [Google Scholar]
- Borra, E. F., & Landstreet, J. D. 1979, ApJ, 228, 809 [NASA ADS] [CrossRef] [Google Scholar]
- Borra, E. F., Landstreet, J. D., & Thompson, I. 1983, ApJS, 53, 151 [NASA ADS] [CrossRef] [Google Scholar]
- Borucki, W. J., Koch, D., Basri, G., et al. 2010, Science, 327, 977 [NASA ADS] [CrossRef] [PubMed] [Google Scholar]
- Bowman, D. M. 2017, Amplitude Modulation of Pulsation Modes in Delta Scuti Stars (Berlin: Springer-Verlag) [Google Scholar]
- Bowman, D. M., & Kurtz, D. W. 2018, MNRAS, 476, 3169 [NASA ADS] [CrossRef] [Google Scholar]
- Bowman, D. M., Holdsworth, D. L., & Kurtz, D. W. 2015, MNRAS, 449, 1004 [NASA ADS] [CrossRef] [Google Scholar]
- Bowman, D. M., Kurtz, D. W., Breger, M., Murphy, S. J., & Holdsworth, D. L. 2016, MNRAS, 460, 1970 [NASA ADS] [CrossRef] [Google Scholar]
- Breger, M. 1970, ApJ, 162, 597 [NASA ADS] [CrossRef] [Google Scholar]
- Breger, M. 2000, ASP Conf. Ser., 210, 3 [Google Scholar]
- Breger, M., & Beichbuchner, F. 1996, A&A, 313, 851 [NASA ADS] [Google Scholar]
- Breger, M., Stich, J., Garrido, R., et al. 1993, A&A, 271, 482 [NASA ADS] [Google Scholar]
- Briquet, M., Morel, T., Thoul, A., et al. 2007, MNRAS, 381, 1482 [NASA ADS] [CrossRef] [Google Scholar]
- Briquet, M., Neiner, C., Aerts, C., et al. 2012, MNRAS, 427, 483 [NASA ADS] [CrossRef] [Google Scholar]
- Browning, M. K., Brun, A. S., & Toomre, J. 2004a, IAU Symp., 224, 149 [NASA ADS] [CrossRef] [Google Scholar]
- Browning, M. K., Brun, A. S., & Toomre, J. 2004b, ApJ, 601, 512 [NASA ADS] [CrossRef] [Google Scholar]
- Buysschaert, B., Aerts, C., Bloemen, S., et al. 2015, MNRAS, 453, 89 [NASA ADS] [CrossRef] [Google Scholar]
- Buysschaert, B., Neiner, C., & Aerts, C. 2017a, IAU Symp., 329, 146 [NASA ADS] [Google Scholar]
- Buysschaert, B., Neiner, C., Briquet, M., & Aerts, C. 2017b, A&A, 605, A104 [NASA ADS] [CrossRef] [EDP Sciences] [Google Scholar]
- Buysschaert, B., Aerts, C., Bowman, D. M., et al. 2018a, A&A, in press, DOI: 10.1051/0004-6361/201832642 [Google Scholar]
- Buysschaert, B., Neiner, C., Martin, A. J., et al. 2018b, MNRAS, 478, 2777 [NASA ADS] [CrossRef] [Google Scholar]
- Carrier, F., North, P., Udry, S., & Babel, J. 2002, A&A, 394, 151 [NASA ADS] [CrossRef] [EDP Sciences] [Google Scholar]
- Catalano, F. A., & Renson, P. 1998, A&AS, 127, 421 [NASA ADS] [CrossRef] [EDP Sciences] [Google Scholar]
- Chini, R., Hoffmeister, V. H., Nasseri, A., Stahl, O., & Zinnecker, H. 2012, MNRAS, 424, 1925 [NASA ADS] [CrossRef] [Google Scholar]
- Cleveland, W. S. 1979, J. Am. Stat. Assoc., 74, 829 [Google Scholar]
- Cowley, A., Cowley, C., Jaschek, M., & Jaschek, C. 1969, AJ, 74, 375 [NASA ADS] [CrossRef] [Google Scholar]
- Crawford, D., Limber, D. N., Mendoza, E., et al. 1955, ApJ, 121, 24 [NASA ADS] [CrossRef] [Google Scholar]
- Cunha, M. S. 2002a, MNRAS, 333, 47 [NASA ADS] [CrossRef] [Google Scholar]
- Cunha, M. S. 2002b, ASP Conf. Ser., 259, 272 [NASA ADS] [Google Scholar]
- Cunha, M. S., Alentiev, D., Brandão, I. M., & Perraut, K. 2013, MNRAS, 436, 1639 [NASA ADS] [CrossRef] [Google Scholar]
- Deeming, T. J. 1975, Ap&SS, 36, 137 [NASA ADS] [CrossRef] [MathSciNet] [Google Scholar]
- Degroote, P., Briquet, M., Catala, C., et al. 2009, A&A, 506, 111 [NASA ADS] [CrossRef] [EDP Sciences] [Google Scholar]
- Degroote, P., Aerts, C., Baglin, A., et al. 2010, Nature, 464, 259 [NASA ADS] [CrossRef] [PubMed] [Google Scholar]
- Degroote, P., Acke, B., Samadi, R., et al. 2011, A&A, 536, A82 [NASA ADS] [CrossRef] [EDP Sciences] [Google Scholar]
- Degroote, P., Aerts, C., Michel, E., et al. 2012, A&A, 542, A88 [NASA ADS] [CrossRef] [EDP Sciences] [Google Scholar]
- Donati, J.-F., Semel, M., & Rees, D. E. 1992, A&A, 265, 669 [NASA ADS] [Google Scholar]
- Donati, J.-F., Semel, M., Carter, B. D., Rees, D. E., & Collier Cameron, A. 1997, MNRAS, 291, 658 [NASA ADS] [CrossRef] [MathSciNet] [Google Scholar]
- Drury, J. A., Murphy, S. J., Derekas, A., et al. 2017, MNRAS, 471, 3193 [NASA ADS] [CrossRef] [Google Scholar]
- Duchêne, G., & Kraus, A. 2013, ARA&A, 51, 269 [Google Scholar]
- Dziembowski, W., & Goode, P. R. 1985, ApJ, 296, L27 [NASA ADS] [CrossRef] [Google Scholar]
- Dziembowski, W. A., & Goode, P. R. 1996, ApJ, 458, 338 [NASA ADS] [CrossRef] [Google Scholar]
- Elkin, V. G., Kurtz, D. W., Mathys, G., et al. 2005, MNRAS, 358, 1100 [NASA ADS] [CrossRef] [Google Scholar]
- ESA 1997, ESA SP, 1200 [Google Scholar]
- Escorza, A., Zwintz, K., Tkachenko, A., et al. 2016, A&A, 588, A71 [NASA ADS] [CrossRef] [EDP Sciences] [Google Scholar]
- Fabricius, C., Høg, E., Makarov, V. V., et al. 2002, A&A, 384, 180 [NASA ADS] [CrossRef] [EDP Sciences] [Google Scholar]
- Gerbaldi, M., Floquet, M., & Hauck, B. 1985, A&A, 146, 341 [NASA ADS] [Google Scholar]
- Gilliland, R. L., Brown, T. M., Christensen-Dalsgaard, J., et al. 2010, PASP, 122, 131 [NASA ADS] [CrossRef] [Google Scholar]
- Grunhut, J. H., & Neiner, C. 2015, IAU Symp., 305, 53 [Google Scholar]
- Grunhut, J. H., Wade, G. A., Neiner, C., et al. 2017, MNRAS, 465, 2432 [NASA ADS] [CrossRef] [Google Scholar]
- Guzik, J. A., Kaye, A. B., Bradley, P. A., Cox, A. N., & Neuforge, C. 2000, ApJ, 542, L57 [NASA ADS] [CrossRef] [Google Scholar]
- Handler, G. 1999, MNRAS, 309, L19 [NASA ADS] [CrossRef] [Google Scholar]
- Handler, G., Shobbrook, R. R., Uytterhoeven, K., et al. 2012, MNRAS, 424, 2380 [NASA ADS] [CrossRef] [Google Scholar]
- Hartkopf, W. I., & Mason, B. D. 2011, AJ, 142, 56 [NASA ADS] [CrossRef] [Google Scholar]
- Henrichs, H. F., de Jong, J. A., Verdugo, E., et al. 2013, A&A, 555, A46 [NASA ADS] [CrossRef] [EDP Sciences] [Google Scholar]
- Hermes, J. J., Gänsicke, B. T., Gentile Fusillo, N. P., et al. 2017, MNRAS, 468, 1946 [NASA ADS] [CrossRef] [Google Scholar]
- Holdsworth, D. L. 2016, IBVS, 6185 [Google Scholar]
- Holdsworth, D. L., Kurtz, D. W., Saio, H., et al. 2018a, MNRAS, 473, 91 [NASA ADS] [CrossRef] [Google Scholar]
- Holdsworth, D. L., Saio, H., Bowman, D. M., et al. 2018b, MNRAS, 476, 601 [NASA ADS] [CrossRef] [Google Scholar]
- Houdek, G., & Dupret, M.-A. 2015, Liv. Rev. Sol. Phys., 12, 8 [CrossRef] [Google Scholar]
- Houk, N., & Swift, C. 1999, in Michigan Catalogue of Two-Dimensional Spectral Types for the HD Stars (University of Michigan), 5 [Google Scholar]
- Howell, S. B., Sobeck, C., Haas, M., et al. 2014, PASP, 126, 398 [NASA ADS] [CrossRef] [Google Scholar]
- Hümmerich, S., Paunzen, E., & Bernhard, K. 2016, AJ, 152, 104 [NASA ADS] [CrossRef] [Google Scholar]
- Jaschek, M., & Jaschek, C. 1974, Vistas Astron., 16, 131 [Google Scholar]
- Johnston, C., Buysschaert, B., Tkachenko, A., Aerts, C., & Neiner, C. 2017, MNRAS, 469, L118 [NASA ADS] [CrossRef] [Google Scholar]
- Joshi, S., Martinez, P., Chowdhury, S., et al. 2016, A&A, 590, A116 [NASA ADS] [CrossRef] [EDP Sciences] [Google Scholar]
- Koch, D. G., Borucki, W. J., Basri, G., et al. 2010, ApJ, 713, L79 [NASA ADS] [CrossRef] [Google Scholar]
- Kochukhov, O. 2017, A&A, 597, A58 [NASA ADS] [CrossRef] [EDP Sciences] [Google Scholar]
- Kochukhov, O., & Bagnulo, S. 2006, A&A, 450, 763 [NASA ADS] [CrossRef] [EDP Sciences] [Google Scholar]
- Kochukhov, O., & Wade, G. A. 2016, A&A, 586, A30 [NASA ADS] [CrossRef] [EDP Sciences] [Google Scholar]
- Kochukhov, O., Landstreet, J. D., Ryabchikova, T., Weiss, W. W., & Kupka, F. 2002, MNRAS, 337, L1 [NASA ADS] [CrossRef] [Google Scholar]
- Kochukhov, O., Lüftinger, T., Neiner, C., Alecian, E., & MiMeS Collaboration 2014, A&A, 565, A83 [NASA ADS] [CrossRef] [EDP Sciences] [Google Scholar]
- Kochukhov, O., Rusomarov, N., Valenti, J. A., et al. 2015, A&A, 574, A79 [NASA ADS] [CrossRef] [EDP Sciences] [Google Scholar]
- Koen, C., & Eyer, L. 2002, MNRAS, 331, 45 [NASA ADS] [CrossRef] [Google Scholar]
- Krtička, J., Mikulášek, Z., Henry, G. W., Kurfürst, P., & Karlický, M. 2017, MNRAS, 464, 933 [NASA ADS] [CrossRef] [Google Scholar]
- Kurtz, D. W. 1978a, IBVS, 1436, 1 [NASA ADS] [Google Scholar]
- Kurtz, D. W. 1978b, ApJ, 221, 869 [NASA ADS] [CrossRef] [Google Scholar]
- Kurtz, D. W. 1982, MNRAS, 200, 807 [NASA ADS] [CrossRef] [Google Scholar]
- Kurtz, D. W. 1985, MNRAS, 213, 773 [NASA ADS] [CrossRef] [Google Scholar]
- Kurtz, D. W. 1990, ASP Conf. Ser., 11, 275 [NASA ADS] [Google Scholar]
- Kurtz, D. W. 2000, ASP Conf. Ser., 210, 287 [NASA ADS] [Google Scholar]
- Kurtz, D. W., Elkin, V. G., Mathys, G., & van Wyk, F. 2007, MNRAS, 381, 1301 [NASA ADS] [CrossRef] [Google Scholar]
- Kurtz, D. W., Shibahashi, H., Murphy, S. J., Bedding, T. R., & Bowman, D. M. 2015, MNRAS, 450, 3015 [NASA ADS] [CrossRef] [Google Scholar]
- Kurtz, D. W., Bowman, D. M., Ebo, S. J., et al. 2016, MNRAS, 455, 1237 [NASA ADS] [CrossRef] [Google Scholar]
- Landstreet, J. D., Kochukhov, O., Alecian, E., et al. 2017, A&A, 601, A129 [NASA ADS] [CrossRef] [EDP Sciences] [Google Scholar]
- Lecoanet, D., Vasil, G. M., Fuller, J., Cantiello, M., & Burns, K. J. 2017, MNRAS, 466, 2181 [NASA ADS] [CrossRef] [Google Scholar]
- Lund, M. N., Basu, S., Silva Aguirre, V., et al. 2016, MNRAS, 463, 2600 [NASA ADS] [CrossRef] [Google Scholar]
- Maeder, A. 2009, Physics, Formation and Evolution of Rotating Stars (Berlin: Springer-Verlag) [Google Scholar]
- Makaganiuk, V., Kochukhov, O., Piskunov, N., et al. 2011, A&A, 525, A97 [NASA ADS] [CrossRef] [EDP Sciences] [Google Scholar]
- Martinez, P., & Kurtz, D. W. 1994a, MNRAS, 271, 118 [NASA ADS] [CrossRef] [Google Scholar]
- Martinez, P., & Kurtz, D. W. 1994b, MNRAS, 271, 129 [NASA ADS] [CrossRef] [Google Scholar]
- Mason, B. D., Hartkopf, W. I., Urban, S. E., et al. 2002, AJ, 124, 2254 [NASA ADS] [CrossRef] [Google Scholar]
- Mason, B. D., Hartkopf, W. I., Wycoff, G. L., et al. 2004, AJ, 128, 3012 [NASA ADS] [CrossRef] [Google Scholar]
- Mathis, S., & Zahn, J.-P. 2005, A&A, 440, 653 [NASA ADS] [CrossRef] [EDP Sciences] [Google Scholar]
- Mathis, S., Neiner, C., & Tran Minh, N. 2014, A&A, 565, A47 [NASA ADS] [CrossRef] [EDP Sciences] [Google Scholar]
- Mathys, G. 1995, A&A, 293, 733 [NASA ADS] [Google Scholar]
- Mathys, G. 2004, IAU Symp., 215, 270 [Google Scholar]
- Mathys, G. 2015, ASP Conf. Ser., 494, 3 [Google Scholar]
- Mathys, G. 2017, A&A, 601, A14 [NASA ADS] [CrossRef] [EDP Sciences] [Google Scholar]
- Mathys, G., & Hubrig, S. 1997, A&AS, 124, 475 [NASA ADS] [CrossRef] [EDP Sciences] [Google Scholar]
- Mathys, G., Hubrig, S., Landstreet, J. D., Lanz, T., & Manfroid, J. 1997, A&AS, 123, 353 [NASA ADS] [CrossRef] [EDP Sciences] [Google Scholar]
- McCuskey, S. W. 1967, AJ, 72, 1199 [NASA ADS] [CrossRef] [Google Scholar]
- Meynet, G., Ekstrom, S., Maeder, A., et al. 2013, Lect. Notes Phys., 865, 3 [NASA ADS] [CrossRef] [Google Scholar]
- Michaud, G. 1970, ApJ, 160, 641 [NASA ADS] [CrossRef] [Google Scholar]
- Moe, M., & Di Stefano, R. 2017, ApJS, 230, 15 [Google Scholar]
- Montgomery, M. H., & O’Donoghue, D. 1999, Delta Scuti Star Newsletter, 13, 28 [NASA ADS] [Google Scholar]
- Moravveji, E., Aerts, C., Pápics, P. I., Triana, S. A., & Vandoren, B. 2015, A&A, 580, A27 [NASA ADS] [CrossRef] [EDP Sciences] [Google Scholar]
- Moravveji, E., Townsend, R. H. D., Aerts, C., & Mathis, S. 2016, ApJ, 823, 130 [NASA ADS] [CrossRef] [MathSciNet] [Google Scholar]
- Morel, T., Castro, N., Fossati, L., et al. 2015, IAU Symp., 307, 342 [Google Scholar]
- Moss, D. 1992, MNRAS, 257, 593 [NASA ADS] [Google Scholar]
- Munari, U., Henden, A., Frigo, A., et al. 2014, AJ, 148, 81 [NASA ADS] [CrossRef] [Google Scholar]
- Murphy, S. J., Shibahashi, H., & Kurtz, D. W. 2013, MNRAS, 430, 2986 [NASA ADS] [CrossRef] [Google Scholar]
- Neiner, C., & Lampens, P. 2015, MNRAS, 454, L86 [NASA ADS] [CrossRef] [Google Scholar]
- Neiner, C., Alecian, E., Briquet, M., et al. 2012a, A&A, 537, A148 [NASA ADS] [CrossRef] [EDP Sciences] [Google Scholar]
- Neiner, C., Floquet, M., Samadi, R., et al. 2012b, A&A, 546, A47 [NASA ADS] [CrossRef] [EDP Sciences] [Google Scholar]
- Neiner, C., Mathis, S., Alecian, E., et al. 2015, IAU Symp., 305, 61 [Google Scholar]
- Neiner, C., Wade, G. A., Marsden, S. C., & Blazère, A. 2017, Proc. Polish Astron. Soc., 5, 86 [Google Scholar]
- North, P., Ginestet, N., Carquillat, J.-M., Carrier, F., & Udry, S. 1998, CAOSP, 27, 179 [Google Scholar]
- Oksala, M. E., Neiner, C., Georgy, C., et al. 2017, IAU Symp., 329, 141 [NASA ADS] [Google Scholar]
- Pamyatnykh, A. A. 1999, Acta Astron., 49, 119 [Google Scholar]
- Pamyatnykh, A. A. 2000, ASP Conf. Ser., 210, 215 [NASA ADS] [Google Scholar]
- Pápics, P. I., Briquet, M., Baglin, A., et al. 2012, A&A, 542, A55 [NASA ADS] [CrossRef] [EDP Sciences] [Google Scholar]
- Pápics, P. I., Tkachenko, A., Aerts, C., et al. 2015, ApJ, 803, L25 [Google Scholar]
- Pápics, P. I., Tkachenko, A., Van Reeth, T., et al. 2017, A&A, 598, A74 [NASA ADS] [CrossRef] [EDP Sciences] [Google Scholar]
- Paunzen, E., Wraight, K. T., Fossati, L., et al. 2013, MNRAS, 429, 119 [NASA ADS] [CrossRef] [Google Scholar]
- Power, J. 2007, Master’s Thesis, Queen’s University, Canada [Google Scholar]
- Power, J., Wade, G. A., Hanes, D. A., Aurier, M., & Silvester, J. 2007, in Physics of Magnetic Stars, eds. I. I. Romanyuk, D. O. Kudryavtsev, O. M. Neizvestnaya, & V. M. Shapoval, 89 [Google Scholar]
- Press, W. H. 1981, ApJ, 245, 286 [NASA ADS] [CrossRef] [Google Scholar]
- Preston, G. W. 1974, ARA&A, 12, 257 [NASA ADS] [CrossRef] [MathSciNet] [Google Scholar]
- Rauer, H., Catala, C., Aerts, C., et al. 2014, Exp. Astron., 38, 249 [NASA ADS] [CrossRef] [Google Scholar]
- Renson, P., & Manfroid, J. 2009, A&A, 498, 961 [NASA ADS] [CrossRef] [EDP Sciences] [Google Scholar]
- Ricker, G. R., Winn, J. N., Vanderspek, R., et al. 2015, JATIS, 1, 014003 [Google Scholar]
- Rodríguez, E., & Breger, M. 2001, A&A, 366, 178 [NASA ADS] [CrossRef] [EDP Sciences] [Google Scholar]
- Rogers, T. M. 2015, ApJ, 815, L30 [NASA ADS] [CrossRef] [Google Scholar]
- Rogers, T. M., Lin, D. N. C., McElwaine, J. N., & Lau, H. H. B. 2013, ApJ, 772, 21 [NASA ADS] [CrossRef] [Google Scholar]
- Roman, N. G., Morgan, W. W., & Eggen, O. J. 1948, ApJ, 107, 107 [NASA ADS] [CrossRef] [Google Scholar]
- Romanyuk, I. I., & Kudryavtsev, D. O. 2008, Astrophys. Bull., 63, 139 [NASA ADS] [CrossRef] [Google Scholar]
- Romanyuk, I. I., Semenko, E. A., & Kudryavtsev, D. O. 2014, Astrophys. Bull., 69, 427 [NASA ADS] [CrossRef] [Google Scholar]
- Romanyuk, I. I., Semenko, E. A., & Kudryavtsev, D. O. 2015, Astrophys. Bull., 70, 444 [NASA ADS] [CrossRef] [Google Scholar]
- Saio, H. 2005, MNRAS, 360, 1022 [NASA ADS] [CrossRef] [Google Scholar]
- Saio, H. 2014, IAU Symp., 301, 197 [Google Scholar]
- Sargent, W. L. W. 1964, ARA&A, 2, 297 [NASA ADS] [CrossRef] [Google Scholar]
- Schöller, M., Correia, S., Hubrig, S., & Kurtz, D. W. 2012, A&A, 545, A38 [NASA ADS] [CrossRef] [EDP Sciences] [Google Scholar]
- Seabold, S., & Perktold, J. 2010, in 9th Python in Science Conference [Google Scholar]
- Shibahashi, H., & Aerts, C. 2000, ApJ, 531, L143 [NASA ADS] [CrossRef] [Google Scholar]
- Shibahashi, H., & Takata, M. 1993, PASJ, 45, 617 [NASA ADS] [Google Scholar]
- Shultz, M. E., Wade, G. A., Rivinius, T., et al. 2018, MNRAS, 475, 5144 [NASA ADS] [Google Scholar]
- Sikora, J., Wade, G. A., & Power, J. 2018, Contributions of the Astronomical Observatory Skalnate Pleso, 48, 87 [Google Scholar]
- Simón-Díaz, S., Aerts, C., Urbaneja, M. A., et al. 2018, A&A, 612, A40 [NASA ADS] [CrossRef] [EDP Sciences] [Google Scholar]
- Smalley, B., Southworth, J., Pintado, O. I., et al. 2014, A&A, 564, A69 [NASA ADS] [CrossRef] [EDP Sciences] [Google Scholar]
- Smalley, B., Niemczura, E., Murphy, S. J., et al. 2015, MNRAS, 452, 3334 [NASA ADS] [CrossRef] [Google Scholar]
- Smith, M. A. 1971a, A&A, 11, 325 [NASA ADS] [Google Scholar]
- Smith, M. A. 1971b, AJ, 76, 896 [NASA ADS] [CrossRef] [Google Scholar]
- Smith, M. A. 1973, ApJS, 25, 277 [Google Scholar]
- Smith, K. C. 1996, Ap&SS, 237, 77 [NASA ADS] [CrossRef] [Google Scholar]
- Stello, D., Vanderburg, A., Casagrande, L., et al. 2016, ApJ, 832, 133 [NASA ADS] [CrossRef] [Google Scholar]
- Stȩpień, K. 2000, A&A, 353, 227 [NASA ADS] [Google Scholar]
- Stibbs, D. W. N. 1950, MNRAS, 110, 395 [NASA ADS] [CrossRef] [Google Scholar]
- Takata, M., & Shibahashi, H. 1995, PASJ, 47, 219 [NASA ADS] [Google Scholar]
- Thompson, I. B., Brown, D. N., & Landstreet, J. D. 1987, ApJS, 64, 219 [NASA ADS] [CrossRef] [Google Scholar]
- Thoul, A., Degroote, P., Catala, C., et al. 2013, A&A, 551, A12 [NASA ADS] [CrossRef] [EDP Sciences] [Google Scholar]
- Titus, J., & Morgan, W. W. 1940, ApJ, 92, 256 [NASA ADS] [CrossRef] [Google Scholar]
- Turcotte, S., Richer, J., Michaud, G., & Christensen-Dalsgaard, J. 2000, A&A, 360, 603 [NASA ADS] [Google Scholar]
- Van Reeth, T., Tkachenko, A., Aerts, C., et al. 2015, ApJS, 218, 27 [NASA ADS] [CrossRef] [Google Scholar]
- Vauclair, S., Hardorp, J., & Peterson, D. M. 1979, ApJ, 227, 526 [NASA ADS] [CrossRef] [Google Scholar]
- Villebrun, F., Alecian, E., Bouvier, J., Hussain, G., & Folsom, C. P. 2016, in SF2A-2016: Proceedings of the Annual Meeting of the French Society of Astronomy and Astrophysics, eds. C. Reylé, J. Richard, L. Cambrésy, et al., 199 [Google Scholar]
- Wade, G. A., Neiner, C., Alecian, E., et al. 2016, MNRAS, 456, 2 [NASA ADS] [CrossRef] [Google Scholar]
- Waelkens, C. 1991, A&A, 246, 453 [NASA ADS] [Google Scholar]
- Watson, C. L., Henden, A. A., & Price, A. 2006, Soc. Astron. Sci. Ann. Symp., 25, 47 [NASA ADS] [Google Scholar]
- White, T. R., Pope, B. J. S., Antoci, V., et al. 2017, MNRAS, 471, 2882 [NASA ADS] [CrossRef] [Google Scholar]
- Wolff, S. C. 1968, PASP, 80, 281 [NASA ADS] [CrossRef] [Google Scholar]
- Wolff, S. C. 1983, The A-type stars: problems and perspectives, NASA SP-463 [Google Scholar]
- Wraight, K. T., Fossati, L., Netopil, M., et al. 2012, MNRAS, 420, 757 [NASA ADS] [CrossRef] [Google Scholar]
- Xiong, D. R., Deng, L., Zhang, C., & Wang, K. 2016, MNRAS, 457, 3163 [NASA ADS] [CrossRef] [Google Scholar]
- Zahn, J.-P. 2011, IAU Symp., 272, 14 [Google Scholar]
- Zorec, J., & Royer, F. 2012, A&A, 537, A120 [NASA ADS] [CrossRef] [EDP Sciences] [Google Scholar]
Appendix A
CP stars with rotational modulation
In this section, the light curves and amplitude spectra of stars with rotational modulation caused by surface abundance inhomogeneities are provided.
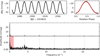 |
Fig. A.10. Rotational modulation in EPIC 215431167 (HD 174146); same layout shown as in Fig. 3. |
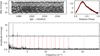 |
Fig. A.11. Rotational modulation in EPIC 215584931 (HD 172480); same layout shown as in Fig. 3. |
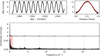 |
Fig. A.12. Rotational modulation in EPIC 215876375 (HD 184343); same layout shown as in Fig. 3. |
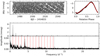 |
Fig. A.13. Rotational modulation in EPIC 216005035 (HD 182459); same layout shown as in Fig. 3. |
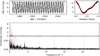 |
Fig. A.14. Rotational modulation in EPIC 217323447 (HD 180303); same layout shown as in Fig. 3. |
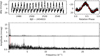 |
Fig. A.15. Rotational modulation in EPIC 218676652 (HD 173406); same layout shown as in Fig. 3. |
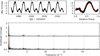 |
Fig. A.16. Rotational modulation in EPIC 218818457 (HD 176330); same layout shown as in Fig. 3. |
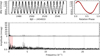 |
Fig. A.17. Rotational modulation in EPIC 219198038 (HD 177013); same layout shown as in Fig. 3. |
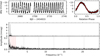 |
Fig. A.18. Rotational modulation in EPIC 224206658 (HD 165972); same layout shown as in Fig. 3. |
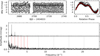 |
Fig. A.19. Rotational modulation in EPIC 226097699 (HD 166190); same layout shown as in Fig. 3. |
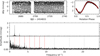 |
Fig. A.20. Rotational modulation in EPIC 226241087 (HD 164224); same layout shown as in Fig. 3. |
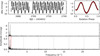 |
Fig. A.21. Rotational modulation in EPIC 227108971 (HD 164190); same layout shown as in Fig. 3. |
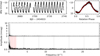 |
Fig. A.22. Rotational modulation in EPIC 227373493 (HD 166804); same layout shown as in Fig. 3. |
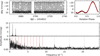 |
Fig. A.23. Rotational modulation in EPIC 227825246 (HD 164085); same layout shown as in Fig. 3. |
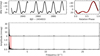 |
Fig. A.24. Rotational modulation in EPIC 232147357 (HD 153192); same layout shown as in Fig. 3. |
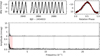 |
Fig. A.25. Rotational modulation in EPIC 232176043 (HD 152834); same layout shown as in Fig. 3. |
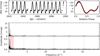 |
Fig. A.26. Rotational modulation in EPIC 232284277 (HD 155127); same layout shown as in Fig. 3. |
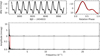 |
Fig. A.27. Rotational modulation in EPIC 247729177 (HD 284639); same layout shown as in Fig. 3. |
Appendix B
Candidate pulsating CP stars with rotational modulation
In this section, the light curves and amplitude spectra of stars that have measured rotational modulation caused by surface abundance inhomogeneities, but also have additional variability indicative of pulsations, are provided.
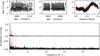 |
Fig. B.1. Rotational modulation and additional variability indicative of stellar pulsations in EPIC 203749199 (HD 152366); same layout shown as in Fig. 3. |
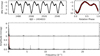 |
Fig. B.2. Rotational modulation and additional variability indicative of stellar pulsations in EPIC 216956748 (HD 181810); same layout shown as in Fig. 3. |
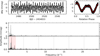 |
Fig. B.3. Rotational modulation and additional variability indicative of stellar pulsations in EPIC 217437213 (HD 177016); same layout shown as in Fig. 3. |
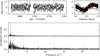 |
Fig. B.4. Rotational modulation and additional variability indicative of stellar pulsations in EPIC 223573464 (HD 161851); same layout shown as in Fig. 3. |
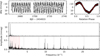 |
Fig. B.5. Rotational modulation and additional variability indicative of stellar pulsations in EPIC 225191577 (HD 164068); same layout shown as in Fig. 3. |
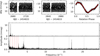 |
Fig. B.6. Rotational modulation and additional variability indicative of stellar pulsations in EPIC 225990054 (HD 158596); same layout shown as in Fig. 3. |
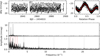 |
Fig. B.7. Rotational modulation and additional variability indicative of stellar pulsations in EPIC 227231984 (HD 158336); same layout shown as in Fig. 3. |
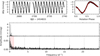 |
Fig. B.8. Rotational modulation and additional variability indicative of stellar pulsations in EPIC 227305488 (HD 166542); same layout shown as in Fig. 3. |
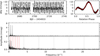 |
Fig. B.9. Rotational modulation and additional variability indicative of stellar pulsations in EPIC 228293755 (HD 165945); same layout shown as in Fig. 3. |
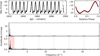 |
Fig. B.10. Rotational modulation and additional variability indicative of stellar pulsations in EPIC 230753303 (HD 153997); same layout shown as in Fig. 3. |
Appendix C
Pulsating CP stars that lack rotational modulation
In this section, the light curves and amplitude spectra of stars that have variability indicative of pulsations, yet lack rotational modulation, are provided.
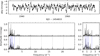 |
Fig. C.1. Summary figure for EPIC 202060145. Top panel: detrended K2 light curve. Bottom left panel: amplitude spectrum calculated up to the K2 LC Nyquist frequency of 24.47 d−1; the residual amplitude spectrum is calculated after pulsation mode frequencies (shown as solid blue lines) have been removed. We note the change in ordinate scale. The dashed grey lines indicate multiples of the K2 thruster firing frequency. Bottom right panel: zoom-in of the low-frequency range. |
All Tables
Fifty-six CP stars in our sample with B- and V-mag values from SIMBAD and spectral type from Renson & Manfroid (2009).
Properties of the 12 CP stars for which rotation periods could not be extracted using K2 observations.
Properties of the CP stars for which variability was detected using K2 observations.
All Figures
|
Fig. 1. K2 light curve and amplitude spectrum for EPIC 206026652 (HD 215766) are given in the top and bottom panels, respectively. The vertical dashed grey lines indicate the location of integer multiples of the K2 thruster firing frequency of νthrus = 4.08 d−1. |
| In the text | |
|
Fig. 2. K2 light curve and amplitude spectrum for EPIC 214503319 (HD 177765) are given in the top and bottom panels, respectively. The vertical dashed grey lines indicate the location of integer multiples of the K2 thruster firing frequency of νthrus = 4.08 d−1. HD 177765 is a confirmed roAp star, and a Nyquist alias of its high-frequency pulsation modes can be seen at 11.760 ± 0.002 d−1, indicated by the solid green line. |
| In the text | |
|
Fig. 3. Rotational modulation in EPIC 201667495 (HD 107000). The detrended K2 light curve is shown in the top left panel. Bottom panel: amplitude spectrum calculated up to the K2 LC Nyquist frequency of 24.47 d−1; the lower part shows the residual amplitude spectrum calculated after the rotational modulation signal was removed for comparison. We note the change in ordinate scale. The vertical red lines indicate the location of the extracted rotation frequency and of its significant harmonics, which were used to construct the rotational modulation frequency model. The vertical dashed grey lines indicate the location of integer multiples of the K2 thruster firing frequency of νthrus = 4.08 d−1. The phase-folded light curve using the derived rotation period is shown in the top right panel with black circles indicating the K2 observations and the red line indicating the rotational modulation frequency model. |
| In the text | |
|
Fig. 4. Distribution of rotation periods for all 38 CP stars for which a rotation period is determined is shown in black. The distribution for the subset of candidate pulsating CP stars is shown in red, and those that have confirmed large-scale magnetic fields are shown in blue. |
| In the text | |
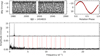 |
Fig. A.1. Rotational modulation in EPIC 201777342 (HD 97859); same layout shown as in Fig. 3. |
| In the text | |
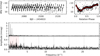 |
Fig. A.2. Rotational modulation in EPIC 203092367 (HD 150035); same layout shown as in Fig. 3. |
| In the text | |
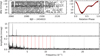 |
Fig. A.3. Rotational modulation in EPIC 203814494 (HD 142990); same layout shown as in Fig. 3. |
| In the text | |
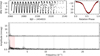 |
Fig. A.4. Rotational modulation in EPIC 204964091 (HD 147010); same layout shown as in Fig. 3. |
| In the text | |
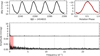 |
Fig. A.5. Rotational modulation in EPIC 210964459 (HD 26571); same layout shown as in Fig. 3. |
| In the text | |
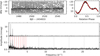 |
Fig. A.6. Rotational modulation in EPIC 213786701 (HD 173657); same layout shown as in Fig. 3. |
| In the text | |
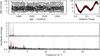 |
Fig. A.7. Rotational modulation in EPIC 214197027 (HD 173857); same layout shown as in Fig. 3. |
| In the text | |
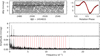 |
Fig. A.8. Rotational modulation in EPIC 214775703 (HD 178786); same layout shown as in Fig. 3. |
| In the text | |
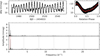 |
Fig. A.9. Rotational modulation in EPIC 215357858 (HD 174356); same layout shown as in Fig. 3. |
| In the text | |
|
Fig. A.10. Rotational modulation in EPIC 215431167 (HD 174146); same layout shown as in Fig. 3. |
| In the text | |
|
Fig. A.11. Rotational modulation in EPIC 215584931 (HD 172480); same layout shown as in Fig. 3. |
| In the text | |
|
Fig. A.12. Rotational modulation in EPIC 215876375 (HD 184343); same layout shown as in Fig. 3. |
| In the text | |
|
Fig. A.13. Rotational modulation in EPIC 216005035 (HD 182459); same layout shown as in Fig. 3. |
| In the text | |
|
Fig. A.14. Rotational modulation in EPIC 217323447 (HD 180303); same layout shown as in Fig. 3. |
| In the text | |
|
Fig. A.15. Rotational modulation in EPIC 218676652 (HD 173406); same layout shown as in Fig. 3. |
| In the text | |
|
Fig. A.16. Rotational modulation in EPIC 218818457 (HD 176330); same layout shown as in Fig. 3. |
| In the text | |
|
Fig. A.17. Rotational modulation in EPIC 219198038 (HD 177013); same layout shown as in Fig. 3. |
| In the text | |
|
Fig. A.18. Rotational modulation in EPIC 224206658 (HD 165972); same layout shown as in Fig. 3. |
| In the text | |
|
Fig. A.19. Rotational modulation in EPIC 226097699 (HD 166190); same layout shown as in Fig. 3. |
| In the text | |
|
Fig. A.20. Rotational modulation in EPIC 226241087 (HD 164224); same layout shown as in Fig. 3. |
| In the text | |
|
Fig. A.21. Rotational modulation in EPIC 227108971 (HD 164190); same layout shown as in Fig. 3. |
| In the text | |
|
Fig. A.22. Rotational modulation in EPIC 227373493 (HD 166804); same layout shown as in Fig. 3. |
| In the text | |
|
Fig. A.23. Rotational modulation in EPIC 227825246 (HD 164085); same layout shown as in Fig. 3. |
| In the text | |
|
Fig. A.24. Rotational modulation in EPIC 232147357 (HD 153192); same layout shown as in Fig. 3. |
| In the text | |
|
Fig. A.25. Rotational modulation in EPIC 232176043 (HD 152834); same layout shown as in Fig. 3. |
| In the text | |
|
Fig. A.26. Rotational modulation in EPIC 232284277 (HD 155127); same layout shown as in Fig. 3. |
| In the text | |
|
Fig. A.27. Rotational modulation in EPIC 247729177 (HD 284639); same layout shown as in Fig. 3. |
| In the text | |
|
Fig. B.1. Rotational modulation and additional variability indicative of stellar pulsations in EPIC 203749199 (HD 152366); same layout shown as in Fig. 3. |
| In the text | |
|
Fig. B.2. Rotational modulation and additional variability indicative of stellar pulsations in EPIC 216956748 (HD 181810); same layout shown as in Fig. 3. |
| In the text | |
|
Fig. B.3. Rotational modulation and additional variability indicative of stellar pulsations in EPIC 217437213 (HD 177016); same layout shown as in Fig. 3. |
| In the text | |
|
Fig. B.4. Rotational modulation and additional variability indicative of stellar pulsations in EPIC 223573464 (HD 161851); same layout shown as in Fig. 3. |
| In the text | |
|
Fig. B.5. Rotational modulation and additional variability indicative of stellar pulsations in EPIC 225191577 (HD 164068); same layout shown as in Fig. 3. |
| In the text | |
|
Fig. B.6. Rotational modulation and additional variability indicative of stellar pulsations in EPIC 225990054 (HD 158596); same layout shown as in Fig. 3. |
| In the text | |
|
Fig. B.7. Rotational modulation and additional variability indicative of stellar pulsations in EPIC 227231984 (HD 158336); same layout shown as in Fig. 3. |
| In the text | |
|
Fig. B.8. Rotational modulation and additional variability indicative of stellar pulsations in EPIC 227305488 (HD 166542); same layout shown as in Fig. 3. |
| In the text | |
|
Fig. B.9. Rotational modulation and additional variability indicative of stellar pulsations in EPIC 228293755 (HD 165945); same layout shown as in Fig. 3. |
| In the text | |
|
Fig. B.10. Rotational modulation and additional variability indicative of stellar pulsations in EPIC 230753303 (HD 153997); same layout shown as in Fig. 3. |
| In the text | |
|
Fig. C.1. Summary figure for EPIC 202060145. Top panel: detrended K2 light curve. Bottom left panel: amplitude spectrum calculated up to the K2 LC Nyquist frequency of 24.47 d−1; the residual amplitude spectrum is calculated after pulsation mode frequencies (shown as solid blue lines) have been removed. We note the change in ordinate scale. The dashed grey lines indicate multiples of the K2 thruster firing frequency. Bottom right panel: zoom-in of the low-frequency range. |
| In the text | |
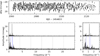 |
Fig. C.2. Summary figure for EPIC 203917770 (HD 145792); similar layout shown as in Fig. C.1. |
| In the text | |
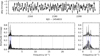 |
Fig. C.3. Summary figure for EPIC 206120416 (HD 210424); similar layout shown as in Fig. C.1. |
| In the text | |
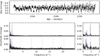 |
Fig. C.4. Summary figure for EPIC 206326769 (HD 211838); similar layout shown as in Fig. C.1. |
| In the text | |
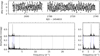 |
Fig. C.5. Summary figure for EPIC 224947037 (HD 162814); similar layout shown as in Fig. C.1. |
| In the text | |
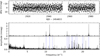 |
Fig. C.6. Summary figure for EPIC 246152326 (HD 220556); similar layout shown as in Fig. C.1. |
| In the text | |
Current usage metrics show cumulative count of Article Views (full-text article views including HTML views, PDF and ePub downloads, according to the available data) and Abstracts Views on Vision4Press platform.
Data correspond to usage on the plateform after 2015. The current usage metrics is available 48-96 hours after online publication and is updated daily on week days.
Initial download of the metrics may take a while.