Fig. 3.
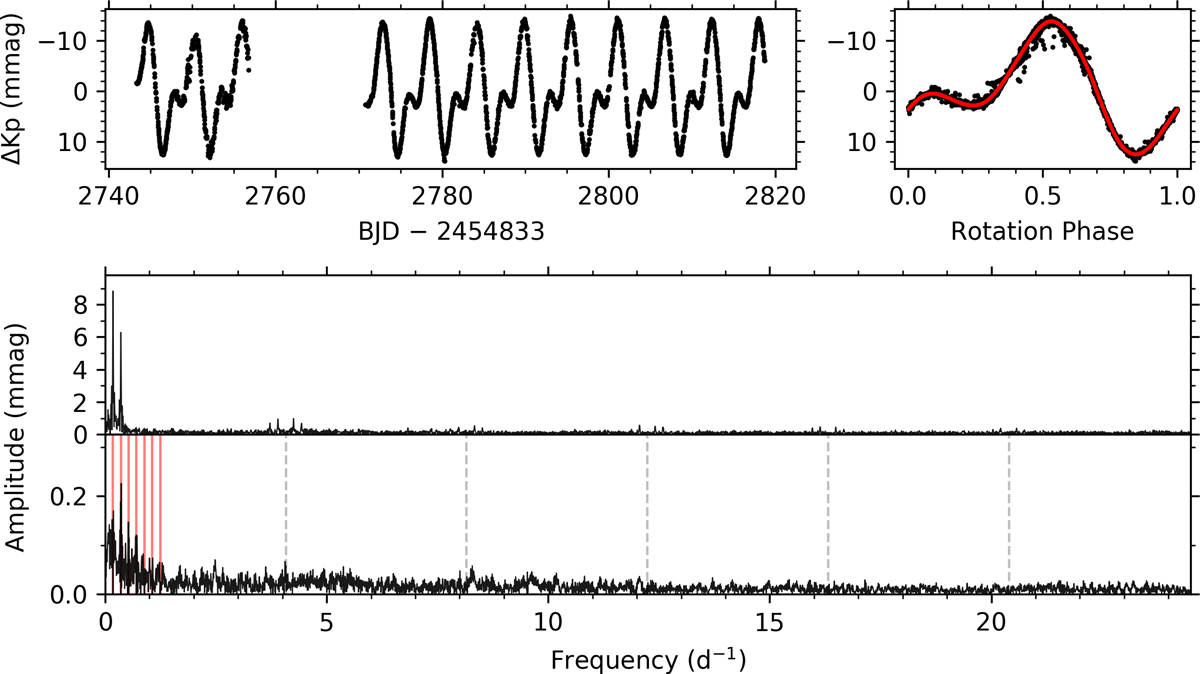
Rotational modulation in EPIC 201667495 (HD 107000). The detrended K2 light curve is shown in the top left panel. Bottom panel: amplitude spectrum calculated up to the K2 LC Nyquist frequency of 24.47 d−1; the lower part shows the residual amplitude spectrum calculated after the rotational modulation signal was removed for comparison. We note the change in ordinate scale. The vertical red lines indicate the location of the extracted rotation frequency and of its significant harmonics, which were used to construct the rotational modulation frequency model. The vertical dashed grey lines indicate the location of integer multiples of the K2 thruster firing frequency of νthrus = 4.08 d−1. The phase-folded light curve using the derived rotation period is shown in the top right panel with black circles indicating the K2 observations and the red line indicating the rotational modulation frequency model.
Current usage metrics show cumulative count of Article Views (full-text article views including HTML views, PDF and ePub downloads, according to the available data) and Abstracts Views on Vision4Press platform.
Data correspond to usage on the plateform after 2015. The current usage metrics is available 48-96 hours after online publication and is updated daily on week days.
Initial download of the metrics may take a while.