Fig. C.1.
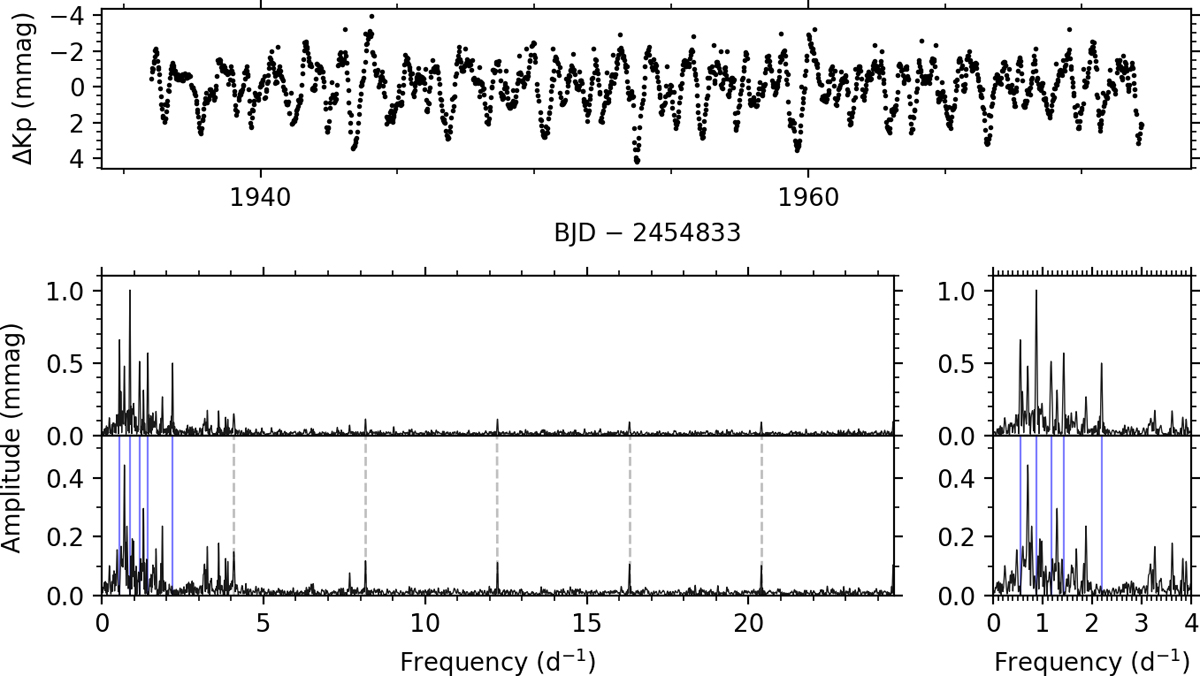
Summary figure for EPIC 202060145. Top panel: detrended K2 light curve. Bottom left panel: amplitude spectrum calculated up to the K2 LC Nyquist frequency of 24.47 d−1; the residual amplitude spectrum is calculated after pulsation mode frequencies (shown as solid blue lines) have been removed. We note the change in ordinate scale. The dashed grey lines indicate multiples of the K2 thruster firing frequency. Bottom right panel: zoom-in of the low-frequency range.
Current usage metrics show cumulative count of Article Views (full-text article views including HTML views, PDF and ePub downloads, according to the available data) and Abstracts Views on Vision4Press platform.
Data correspond to usage on the plateform after 2015. The current usage metrics is available 48-96 hours after online publication and is updated daily on week days.
Initial download of the metrics may take a while.