| Issue |
A&A
Volume 616, August 2018
|
|
|---|---|---|
| Article Number | A150 | |
| Number of page(s) | 11 | |
| Section | Atomic, molecular, and nuclear data | |
| DOI | https://doi.org/10.1051/0004-6361/201833003 | |
| Published online | 05 September 2018 | |
HNCO-based synthesis of formamide in planetary atmospheres⋆
1
J. Heyrovský Institute of Physical Chemistry, Academy of Sciences of the Czech Republic, Dolejškova 3, 18223, Prague 8, Czech Republic
2
Charles University in Prague Faculty of Science, Department of Physical and Macromolecular Chemistry, Albertov 2030, 12840, Prague 2, Czech Republic
3
Institute of Physics, Academy of Sciences of the Czech Republic, Na Slovance 2, 18221, Prague 8, Czech Republic
4
Institute of Biophysics of the Czech Academy of Sciences, Krˇalovopolskˇa 135, 61265, Brno, Czech Republic
e-mail: This email address is being protected from spambots. You need JavaScript enabled to view it.
5
CNRS, IPAG, Univ. Grenoble Alpes, 38000, Grenoble, France
Received:
12
March
2018
Accepted:
2
June
2018
Abstract
Time-resolved Fourier transform infrared emission spectroscopy, Fourier transform absorption infrared spectroscopy, and high-resolution UV–ViS emission spectroscopy have been used to characterize the chemistry of isocyanic acid (HNCO) under glow discharge conditions in planetary atmospheres. HNCO mixtures (i.e., composed of di-hydrogen or ammonia) have been investigated in order to unveil the possible reaction pathways leading to the synthesis of the key prebiotic molecule formamide (HCONH2), upon planetary atmospheres containing isocyanic acid in presence of di-hydrogen and, separately, of ammonia. In addition, ab initio molecular dynamics simulations coupled with a modern metadynamics technique have been performed in order to identify the most likely chemical pathways connecting HNCO to formamide. It turned out that the direct hydrogenation of HNCO is thermodynamically favored. Incidentally, the experimental results – supplied by a simplified kinetic model – also proved the favorability of the reaction HNCO + H2 → HCONH2 which, moreover, spontaneously takes place in unbiased ab initio molecular dynamics simulations carried out under the effect of intense electric fields.
Key words: astrochemistry / astrobiology / planets and satellites: atmospheres / ISM: molecules
Data associated to Figs. 2 and 3 are only available at the CDS via anonymous ftp to cdsarc.u-strasbg.fr (130.79.128.5) or via http://cdsarc.u-strasbg.fr/viz-bin/qcat?J/A+A/616/A150
© ESO 2018
1. Introduction
Formamide-based chemistry is a broadly discussed scenario relating to the origin of biomolecules (Saladino et al. 2004, 2012b; Ferus et al. 2011b, 2012, 2014, 2017b; Saitta & Saija 2014; Pino et al. 2015; Šponer et al. 2016a,b; Adam et al. 2018; Becker et al. 2018; Benner et al. 2012). Besides the traditional HCN- and reducing-atmospheres based biomolecules synthesis (Ferris et al. 1974; Yuasa et al. 1984; Levy et al. 1999; Sutherland 2016; Civiš et al. 2017), the current evidence shows that the formamide molecule did not necessary play role of merely starting parent prebiotic precursor, but also it could serve as an intermediate compound in prebiotic synthesis (Ferus et al. 2017b). In fact, it has been demonstrated that it acted either as substrate or as intermediate in a series of complex reactions starting from very reactive small radicals and leading to a broad palette of biomolecules, for example, all the canonical nucleobases of the genetic code, ribose and other sugars, amino acids or even fatty acids (Saladino et al. 2011, 2015; Ferus et al. 2015b).
Since the discovery of its millimeter rotational line spectrum in the Galactic interstellar medium (Rubin et al. 1971), formamide has been searched for – and detected – in various astrophysical environments exposed to a wide range of physical conditions, both in the Milky Way and in other galaxies (Muller et al. 2013). Recent studies have reported the presence of formamide in star forming regions (Bisschop et al. 2007; Kahane et al. 2013). A systematic study of sun-like protostars (Taquet et al. 2015) showed that formamide was present only toward the sources, with a rich content in Complex Organic Molecules (COMs) in the central inner regions around the protostar. This result was confirmed by high-angular observations of these objects (Taquet et al. 2015). Importantly, formamide was not detected down in the cold prestellar gas down to abundances below 10−12 with respect to H2. An intriguing result was the detection of formamide in protostellar shock regions (Mendoza et al. 2014; Codella et al. 2017) with an abundance on the order of 10−8 relatively to H2, ranging among the highest ever reported for that species. In our solar system, formamide was detected toward a few comets such as Hale–Bopp (Bockelee-Morvan et al. 2000) or, more recently, 67P/Churyumov-Gerasimenko (Goesmann et al. 2015).
During the last decade, various chemical processes depending on the physical and chemical conditions encountered in several astrophysical environments have been discussed as possible sources of the formamide species, such as, for example, HCN hydrolysis (Saladino et al. 2012b; Bada et al. 2016; Šponer et al. 2016b), ammonium-formate dehydration (Šponer et al. 2016a) or direct synthesis from CO and NH3 atmosphere (Ferus et al. 2017b). In many cases, however, the proposed formation pathways are poorly constrained both experimentally and theoretically (Taquet et al. 2015). Recently, the rate coefficient parameters for the gas phase reaction NH2 + H2CO → HCONH2 + H have been computed (Barone et al. 2015). High angular resolution observations of formamide in the millimeter range showed that this reaction could successfully account for the rotational line emission from protostellar shock regions (Codella et al. 2017).
On the one hand, many studies are motivated by the fact that formamide can be regarded as one of the precursors of nucleobases and other biomolecules (Miyakawa et al. 2002; Saladino et al. 2005; Saladino et al. 2008, 2009, 2010, 2015; Brucato et al. 2006; Senanayake & Idriss 2006; Cloutier et al. 2007; Costanzo et al. 2007; Ferus et al. 2012; Hudson et al. 2012; Saladino et al. 2012a; Šponer et al. 2012; Adande et al. 2013; Wang et al. 2013; Ferus et al. 2014, 2015b). On the other hand, the larger abundance of isocyanic acid (HNCO) – being at least three times more abundant than formamide – makes it a good candidate as a precursor of the simplest amide and thus of more complex species. Similarly to formamide, isocyanic acid is ubiquitous in Galactic and extragalactic interstellar media (Nguyen-Q-Rieu et al. 1991). It was firstly detected in the massive star forming region SgrB2 (Snyder & Buhl 1972). Since then, its rotational transitions were found prominent in the molecular clouds of the Galactic Center (Kuan & Snyder 1996), in massive (Churchwell et al. 1986; Blake et al. 1987; Bisschop et al. 2007) as well as in solar-type star forming regions (Mendoza et al. 2014; Taquet et al. 2015). Isocyanic acid was also detected in diffuse clouds (Turner et al. 1999) and in cold, dense, prestellar cores such as TMC1 or L1544 (Jackson et al. 1972; Taquet et al. 2015). The HNCO abundances reported for the interstellar medium are typically a few 10−9 relatively to H2, whereas they are lower in diffuse clouds (i.e., on the order of 10−10; see, e.g., Turner et al. 1999). HNCO exhibits several isomers with a singlet ground electronic state: cyanic acid (HOCN), fulminic acid (HCNO), formonitrile oxide (HCNO) and carboxime (HONC). There is no obvious common precursor to these isomers and their chemical pathways are likely different. Therefore, it was proposed that the determination of their relative abundances could bring some constraints on the chemistry of these species (Marcelino et al. 2010). In a systematic study on isocyanic acid and on formamide in star forming regions (Taquet et al. 2015), a tight and almost linear correlation between the abundances of both species, with a ratio HNCO/HCONH2 of about ten, across six orders of magnitude in luminosity has been obtained. This finding suggests that HNCO and HCONH2 are chemically related in the interstellar medium, in other words, they share a common precursor or one forms from the other. Ices with similar features may have been present in the early solar system as well as in present objects such as the coma of most comets (Mumma & Charnley 2011). The recent measurements of the Rosetta space mission show that HNCO is, however, less abundant than HCONH2 by a factor of a few (Goesmann et al. 2015).
Both photochemistry and discharge plasma chemistry of isocyanic acid have been the subject of several previous studies (Liu et al. 2000; Zhao et al. 2002; Raunier et al. 2003a,b; Zhang et al. 2005; Wang et al. 2007; Rodriguez-Fernandez et al. 2010; Mispelaer et al. 2012; Barth et al. 2013; Yu et al. 2013) which showed that the simplest photochemical dissociation pathway leads to the formation of •H and •NCO. In contrast with other methods (e.g., laser ablation), the discharge plasma approach is of particular relevance because the physical-chemical conditions are far from equilibrium (Ferus et al. 2011a,c, 2015a; Civiš et al. 2012), adherently to disparate processes occurring under natural circumstances. However, these conditions are caused by a complex interplay of macroscopic and microscopic factors and a complete understanding of the plasma discharge catalytic effects is still lacking.
Titan and Enceladus – exotic moons of Saturn – show environments in which a peculiar chemistry may take place. In fact, in Titan's atmosphere subjected to the Saturn's magnetosphere, as well as to solar UV and cosmic rays irradiation, production of HCN-based molecules can easily occur (Raulin & Owen 1998). Cooper et al. (2009) suggest that Enceladus, being highly irradiated by the Saturn's magnetospheric electrons and thus subjected to a direct source of chemical energy from radiolytic gas production, exhibits episodic ejections of water vapor, carbon dioxide, and various hydrocarbons. The hydrocarbons do not survive to the transport through the plasma environment and the oxygen ions from Enceladus' water molecules become the dominant ionic species in the outer magnetosphere. Furthermore, Cassini discovered that the oxygen ions coming from Enceladus bombard Titan's upper atmosphere (Hartle et al. 2006) and heavy cations and anions exist in sizable abundances within the latter environment (Coates et al. 2007). Space radiation effects in both moons, coupled with the Saturn's magnetosphere, could cause a series of events potentially leading to prebiotic chemical evolution. Among the others, the laboratory simulation of atmospheric discharges in the early Earth's atmosphere or in recent Saturn's and Titan's atmosphere, and a simulation of plasma are of particular interest (Hébrard et al. 2012; Hoerst et al. 2012; Civiš et al. 2017; Ferus et al. 2017a).
Here we report a study of the synthesis of formamide from HNCO under conditions that are adherent with those encountered in astrophysical media. Albeit HNCO is denoted as a typical product of the formamide decay (Kakumoto et al. 1985; Liu et al. 2000; Gorb et al. 2005; Kang & Kim 2006; Antol et al. 2008; Eckert-Maksić et al. 2010; Nguyen et al. 2011; Ferus et al. 2011b, 2014), the current study intends to experimentally prove that the reversible reaction pathway (i.e., connecting HNCO to formamide) is possible. Moreover, by means of ab initio molecular dynamics simulations coupled with state-of-the-art metadynamics techniques such a chemical conversion has been characterized at the atomistic and thermodynamical level, whereas several spectroscopic measurements have been performed in order to identify the chemistry underlying HNCO mixtures under glow discharge conditions.
2. Methods
Several spectroscopic measurements have been performed to identify the chemistry underlying HNCO, HNCO + H2, and HNCO + NH3 mixtures under glow discharge conditions. High-resolution Fourier transform infrared absorption spectroscopy has been employed in order to monitor the stable gas phase products, particularly formamide as a product of reverse reactions of HNCO decomposition. Emission spectra are examined by UV–ViS and time resolved FTIR spectroscopy. The results have been compared with ab initio molecular dynamics and metadynamics simulations in order to propose an adequate reaction scheme.
2.1. High resolution absorption FT spectroscopy
In order to detect the terminal gaseous products, we used absorption spectroscopy. After the exposure of the HNCO mixtures to the pulsed discharge, the products were concentrated in a liquid nitrogen trap and evaporated into a multipass White cell with a 30 m optical path length. Such a cell was connected to the Bruker spectrometer IFS 125 HR (Bruker, Germany). Two hundred scans were collected in order to achieve an optimal signal-to-noise ratio. In parallel, we also conducted the experiments in continuous regime. During the measurements, the gas-phase products were detected via the determination of the absorption in the infrared range 750–4250 cm−1, while the resolution of the spectrometer was 0.02 cm−1. Hence, the whole middle infrared range was included.
2.2. High-resolution UV–Vis and FTIR emission spectroscopy
The detection of highly-excited atomic, radical, or ionic products in the range of UV and ViS spectra was also covered by high resolution emission spectroscopy. During the discharge process itself, an optical cable with a built-in mirror was used to record the emission from the discharge cell by the high-resolution UV–ViS spectrometer Echelle ESA 4000. Such an apparatus allowed us to measure the emission spectra in the interval 200–800 nm, that is, from the middle ultraviolet range to the beginning of the near infrared region with spectral resolution ranging from 0.005 nm (200 nm) to 0.019 nm (780 nm). Continuous direct current (DC) discharge was applied whereas the emission from the discharge cell was transferred into the Echelle spectrometer via an optical fiber glass cable.
In parallel, TRS-FT spectroscopy was performed in order to characterize the physical conditions in plasma and detect unstable dissociation fragments in the infrared spectral range. The main advantage of TRS-FT is that the spectra can be obtained over a wide interval of wavenumbers. The continuous scanning principle was the basis for the data acquisition by a modified Bruker IFS 120 (Bruker, Germany). The method is described in our previous papers (Civiš et al. 2006, 2012; Ferus et al. 2011c). Specific measurements of HNCO discharges resulted in 30 reciprocally time-shifted interferograms shifted by 2 μs. These interferograms were converted by using Fourier transformation to time resolved spectra of the 15 μs discharge and following afterglow.
2.3. Experimental conditions
Spectra of the plasma from a positive column discharge in the HNCO, HNCO + H2 and HNCO + NH3 in He carrier gas mixtures were recorded in emission mode using the Echelle ESA 4000 spectrometer, Bruker IFS 120 HR interferometer and, in absorption mode, by using high resolution Bruker IFS 125 interferometer. The experimental set-up is schematically depicted in Fig. 1. Isocyanic acid was prepared before the experiment by the thermolysis of cyanuric acid and a consecutive freezing of the product in liquid nitrogen (Ferus et al. 2014). In order to study the reactivity of HNCO with di-hydrogen and ammonia, we used high-purity H2 (Linde Gas 6.0) and NH3 (Linde Gas, 3.8). The positive column discharge tube (25 cm long with an inner diameter of 12 mm) was covered with a glass outer jacket and equipped with CaF2 windows (see Fig. 1). The pulse discharge was induced by a high-voltage transistor switch (HTS 81, Behlke electronic GmbH, Frankfurt, Germany) between the stainless steel anode and the grounded cathode. The voltage drop across the discharge was 2000 V and the electric current was 85–130 mA. The discharge plasma was cooled by water in the outer jacket of the cell. The time durations of the discharge were 15 μs. The scanner velocity of FTS was set to produce a 10 kHz HeNe laser fringe frequency allowing time range of 100 μs. The discharge pulse was triggered at each second maximum of the digitalized boxcar signal of sinusoidal 10 kHz HeNe laser interference. The recorded spectral range was 200–750 nm in UV–ViS, 1800–6000 cm−1 in emission IR and 750–4500 cm−1 in IR absorption mode. The initial pressure of HNCO was 0.25–0.5 Torr, and the optimal pressure of the carrier gas and hydrogen or ammonia was determined to be 3 Torr (~2 Torr of H2 or NH3 and ~1 Torr of the inert). The pressure was measured with a Baratron gauge placed near the cathode of the cell.
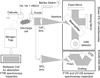 |
Fig. 1. Schematic diagram of the emission FTIR time resolved Bruker IFS 120, Echelle UV–ViS and absorption FTIR Bruker IFS 125 spectroscopic set-up for inspection of the HNCO glow discharges. |
2.4. Ab initio calculations
All the gas-phase chemical reactions of the conversion of HNCO into formamide were simulated using the Born–Oppenheimer molecular dynamics approach combined with enhanced-sampling metadynamics (MetD) adaptive-bias potential technique (Laio & Parrinello 2002; Pietrucci & Saitta 2015). The simulations were carried out using the software suite QuantumESPRESSO (Giannozzi et al. 2009) for electronic structure and ab initio molecular dynamics (AIMD) simulations in conjunction with PLUMED-1.3 (Bonomi et al. 2009), a patch which allows for accurate MetD simulations. Because of the AIMD planewaves-based approach, cubic supercells of side equal to 10.6 Å have been built in order to reproduce the gas-phase behavior of the chemical reactions. The temperature was kept fixed by means of the velocity rescaling method at values around an average of 63 K. The latter temperature, along with parallel simulations performed at temperatures equal to 10 K and 40 K, respectively, has been chosen in order to mimic thermodynamic conditions common in cold interstellar media. As usual, the dynamics of ions was simulated classically using the Verlet algorithm.
A cutoff energy of 35 Rydberg (Ry) for the wavefunctions and a cutoff energy of 280 Ry for the charge density have been set whereas a timestep of 0.24 fs has been adopted. With such cutoff values, the investigated reactions are described in a reliable way since the core electronic structure interaction is being depicted through ultrasoft pseudopotentials (USPP). All reactions not involving radicals were studied by means of the Perdew–Burke–Ernzherof (PBE) exchange and correlation functional (Perdew et al. 1996), belonging to the generalized gradient approximation (GGA) class of density functional theory. The remaining reactions were described by hybrid version of PBE (i.e., PBE0) with a 25% fraction of exact exchange.
The MetD formalism adopted here employs the matrices of coordination numbers with the aim to define a given molecular state and, as usual for the path-CV MetD (Branduardi et al. 2007), exploits two collective variables (CV), S, and Z, on which the two dimensional free-energy surface is constructed. The former variable represents the progress along the chemical transformation whereas the latter the distance from the predefined (idealized) pathway. In our case, however, only the reactants and the products basins have been chosen to define the chemical path. This way, no additional bias on the chemical route undertaken by the system is introduced. During the calculations, the following parameters have been adopted for the coordination function (see Eq. (3) of Pietrucci & Saitta 2015): N = 6, M = 12,  for S, S′ = O, C, N, 1.5 Å for S = O, C, N, S′ = H, and 1.4 Å for S = S′ = H. The parameter λ has been set such that λD(Rk, Rk,k′) ~ 2.3. The MetD potential was composed of Gaussians with widths σs = 0.02 and σz = 0.10 and height 6 kcal mol−1 deposed every 24 fs. In all the simulations, we restricted the maximum values explored by employing a semi-parabolic wall potential (Besker & Gervasio 2012).
The Car–Parrinello (Car & Parrinello 1985) approach, as implemented in the software package QuantumESPRESSO, has been used for unbiased (without the MetD assistance) condensed phase simulation carried out on a mixture of HNCO and H2 exposed to the action of an electric field. The static and homogeneous electric field has been oriented along a given direction (corresponding to the z-axis). The implementation of an external field in density functional theory (DFT)-based codes can be achieved by exploiting the modern theory of polarization and Berry's phases. Our sample contained 32 HNCO and 50 H2 molecules (i.e., 228 atoms) arranged in a cubic cell with side parameter a = 12.36 Å. As usual, the structure was replicated in space by using periodic boundary conditions. In order to simulate thermodynamic conditions comparable to those found in the pulse discharge experiments – but still keeping the electrons close to the electronic Born–Oppenheimer potential energy surface – we carried out these AIMD simulations at the nominal temperatures of 400 K and 600 K. We gradually increased the intensity of the electric field with a step increment of about 0.05 V Å−1 from zero up to a maximum of 0.55 V Å−1. The dynamics of the zero-field cases have been executed for 10 ps whereas, for every other value of the field strength, we ran the dynamics for at least 2 ps, thus cumulating total simulations of about 40 ps.
The fictitious electronic mass was set to a value of 300 au, with a cutoff energy of 35 Ry and a cutoff energy for the charge density of 280 Ry, which allowed us to adopt a timestep of 0.12 fs. With such cutoff values, the sample is described in a reliable way since the core electronic interaction is being depicted through USPP. PBE functional has been chosen in order to treat the exchange and correlation effects. The dynamics of ions was simulated classically within a constant number, volume and temperature (NVT) ensemble, using the Verlet algorithm and a Nosé–Hoover thermostat set at a frequency of 13.5 THz.
3. Results and discussion
3.1. HNCO dissociation: stable and unstable fragments
The spectra of the products recorded in the absorption infrared and in the emission UV–ViS spectral ranges reveal the most relevant species formed during the HNCO dissociation. The absorption spectra of the stable products are shown in Fig. 2 and the emission spectra in the UV–ViS spectral range are depicted in Fig. 3. The transition bands and atomic emission lines have been assigned using the commonly available data accessible via the database High-Resolution Transmission Molecular Absorption Database HITRAN (Rothman et al. 2013) and the database of the National Institute of Standards and Technology NIST (Kramida et al. 2015). Moreover, the data were compared with those available in some papers previously published in our laboratory (Civis et al. 2008, 2011, 2016; Okabe 1970; Camacho et al. 2008; Nemes et al. 2000).
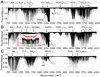 |
Fig. 2. Absorption spectra of the discharge products formed in HNCO + He (panel A), HNCO + H2 (panel B), and HNCO + NH3 (panel C) mixtures. In panel B, the formamide carbonyl v4 band observed in the mixture of HNCO + H2 is enlarged in the red frame for clarity and compared with 10 ppm of vapors (Rothman et al. 2013). |
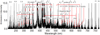 |
Fig. 3. UV–Vis emission spectra of the glow discharge in mixture of HNCO with hydrogen. In optical emission spectra, other discharge mixture exhibited similar palette of species differing only in emission intensity. Assignments adopted from Okabe (1970), Civis et al. (2008, 2016), Zizak (2000), Camacho et al. (2008) and Nemes et al. (2000). |
In all the three studied mixtures (i.e., 0.25 Torr of HNCO in 2 Torr of He carrier gas, 0.25 Torr of HNCO mixed with 2 Torr of H2 and, separately, with 2 Torr of NH3) the discharge process has produced a large amount of carbon monoxide exhibiting a moiety of absorption as well as emission vibration bands. Very strong bands stemming also from HCN and from the CN radical have been recorded. In addition, bands ascribed to NH3, CO2 and N2O have been found. Several atomic transitions (C I, C II, N I, N II, O I, O II, Hα, Hβ) are also visible in the UV–ViS and IR emission spectral ranges. Emission spectra in the IR region exhibit only bands of CN, CO2, CO and HCN already recorded by a combination of UV–ViS emission spectroscopy and IR absorption spectroscopy. Additionally, emission bands of highly excited states of carbon monoxide, a very important product of HNCO atmospheric and/or discharge chemistry were detected in the UV–ViS spectra, together with the N2 1st positive B3Π–A3Σ band which stands for the formation of di-nitrogen (in its excited state) in accordance with the proposed reaction chain.
In addition to the general features described above, we identify the signature of the formamide rovibrational band v4 in the IR spectrum of the stable products formed in the HNCO + H2 mixture exposed to electric glow discharge, as indicated in Fig. 2, panel B. As can be observed in Fig. 2, panels A and C, such signatures are found neither in pure HNCO (panel A) nor in the HNCO + NH3 mixture (panel C).
Under glow-discharge conditions, the absorption measurements clearly show that formamide is synthesized in detectable amount of 10 ppm in the HNCO + H2 mixture, both in Ar and in N2 atmospheres. The value was estimated by comparing the transmittance of the formamide absorption bands with respect to those of HNCO for which the initial amount was known. Using our simplified chemical kinetic model described in the Appendix, we have also estimated both the expectable amount of residual HNCO mixture in the sample and its mixing ratio relative to formamide.
In the mixture of HNCO + NH3, the strongest v4 carbonyl vibration band of formamide is not observed. The absorption spectra of the HNCO + H2 mixture have been examined at several partial pressures of both reagents (1–5 Torr) and also for variable discharge currents (from 100 to 350 mA). In all the spectra, the v4 transition of formamide has been detected together with significant amount of CO, CO2, H2O, HCN, N2O, and NH3 (formed as a product in the reaction chain). These findings strongly suggest that the formation of formamide is likely related to the direct reaction between HNCO and H2 as no detectable amount of formamide was present in any of the investigated HNCO-ammonia mixtures whereas, in those composed of HNCO and di-hydrogen, at least the most significant absorption band of formamide was observed in all the samples.
Based on the spectroscopic measurements of the CO bands in the infrared range, we also determined the plasma temperature and the electron density. The details of the calculations are supplied in the Appendix.
3.2. Formamide free-energy surfaces (synthesis from HNCO)
The formamide decomposition pathways and their products have been theoretically investigated by Nguyen et al. (2011). Three main routes were identified: dehydrogenation, dehydration, and decarbonylation. HNCO appears as a typical product of formamide dehydrogenation, along with water and hydrogen cyanide – in the dehydration pathway – or ammonia and carbon monoxide in the decarbonylation pathway. The qualitative spectroscopic observations presented here show that the backward reaction is also possible under the glow discharge conditions of our experiments. Below, we show by means of ab initio calculations and MetD that the formation of formamide from HNCO + H2 is thermodynamically and kinetically favored with respect to its potential synthesis from HNCO + NH3 or from HNCO + •NH2 mixtures. Moreover, we show the thermodynamic reasons behind the lack of formamide observation in cold interstellar regions.
The possible reaction pathways connecting isocyanic acid and formamide have been explored by means of AIMD and MetD (Laio & Parrinello 2002; Pietrucci & Saitta 2015) techniques. One of the most likely (and simple) reaction channels is represented by a backward reaction of the formamide dehydrogenation:
 (1)
(1)
where the one-step hydrogenation mechanism of isocyanic acid is driven by di-hydrogen. This way, a gaseous mixture of HNCO and H2 has been simulated by means of AIMD and MetD approaches in order to reproduce the conversion of the numerical sample into formamide in a biased way. These methods are able to reveal, inter alia, the relevant (meta)stable basins connecting the reactants and the product and, at the same time, to re-construct the underlying free-energy surface of the process. We remark that our simulations do not introduce any information about the specific reaction pathway(s) undertaken by the system. Three different series of simulations were performed at three different temperatures T = 63 K, 40 K, 10 K, respectively. The results, however, show only negligible variations. This reaction has been also theoretically investigated for temperatures typical of glow discharge under electric field (see Sect. 3.3).
The free-energy landscape reveals two free-energy basins in the low-dimensionality space characterized by the used pathcollective variables enforcing the conversion of HNCO and H2 into formamide, as shown in Fig. 4. In particular, only the basins ascribed to the reactants and the product are present. As expected, this implies that all the remaining possible permutations of covalent bonds re-arrangements are energetically unfavored. More importantly, the basin related to formamide reveals that this species is more stable than the reactants by 15 kcal mol−1, in good agreement with the available data obtained from highlevel CCSD(T)/CBS + ZPE potential energy quantum chemical calculations, i.e., 15.7 kcal mol−1 (Nguyen et al. 2011). Notwithstanding its exergonicity, the reaction requires an energy supply of 60 kcal mol−1 in order to proceed, as visible from the freeenergy difference between the reactants basin and the region separating the two minima (i.e., the first-order saddle point of the free-energy surface). This value is again in fairly good agreement with the available data stemming from static quantum chemistry calculations, i.e., 63.1 kcal mol−1 (Nguyen et al. 2011). Besides these thermodynamic considerations, the employed technique (Pietrucci & Saitta 2015; Cassone et al. 2017b) fully characterizes the reaction pathway. This way, the mechanistic picture of the hydrogenation process of isocyanic acid – leading thus to the formamide synthesis – has been identified, as shown in Fig. 5.
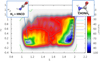 |
Fig. 4. Free-energy landscape of the synthesis of formamide from isocyanic acid and di-hydrogen at T = 63 K. The free-energy landscape is shown in the space spanned by the Collective Variables S and Z. The former variable represents the progress along the chemical transformation (i.e., the geometrical evolution of the system from the reactants toward the products) whereas the latter the distance from an ideal pathway. |
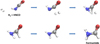 |
Fig. 5. Reaction pathway revealed by ab initio molecular dynamics simulations coupled with metadynamics that characterizes the transformation of a gas phase HNCO + H2 mixture into formamide. A dissociative mechanism of di-hydrogen (upper panel) leads to the simultaneous hydrogenation of the nitrogen and carbon atoms and thus to the formamide synthesis (bottom panel). |
The transition state and barrier height of reaction (1) studied by Nguyen et al. (2011) are very similar to our results at T = 63 K, considering the different treatment of temperature and the different quantum-mechanical approximations. This similarity is mainly due to the fact that the sampled temperature is low. In fact, when temperature regimes approaching those typically found in laser shock wave simulating asteroid impact plasma are considered (i.e., 4500 K), the stability of formamide (the reaction product of the above-mentioned reaction) is expected to decrease with respect to that of the simpler reactants mainly because of entropic reasons (Ferus et al. 2017b). It has recently been shown, indeed, that under those conditions, formamide can be exploited as a key intermediate and parent compound of the synthesis of RNA nucleobases (Ferus et al. 2017b).
Observationally, we should bear in mind that HCONH2 was detected only in hot, eventually shocked, environments, at temperatures above 60 K. In fact, it is not detected in cold interstellar gas, unlike HNCO. This finding is adherent to the observed free-energy barrier, shown in Fig. 4, where a non-negligible amount of 60 kcal mol−1 has to be invested in order to trigger the reaction.
Additionally to the simple reaction just described, also mixtures of HNCO with ammonia and, separately, with the amino radical •NH2 have been simulated by means of the same approach. In particular, the following reactions have been reproduced:
 (2)
(2)
 (3)
(3)
Because of the involvement of radical species, the hybrid exchange and correlation functional PBE0 (with a 25% fraction of exact exchange) has been employed. However, these reaction channels are clearly less favored, being in fact characterized by a free-energy activation barrier larger than 90 kcal mol−1, as shown in Figs. A.1 and A.2. This latter barrier is higher than that of reaction (1) and also than that found for the conversion of ammonia and carbon monoxide into formamide determined at the CCSD(T)/CBS + ZPE level, i.e., 74.3 kcal mol−1, Nguyen et al. (2011). Moreover, the process described by reaction (2) passes through an additional stability basin besides the two trivial ones corresponding to the reactants and the products. In particular, urea is spontaneously formed during the chemical transformation of HNCO and ammonia. This unbiased result thus suggests a key role played by urea. Additionally, this amide has not only been unexpectedly synthesized, but also its respective basin appears to be more stable (having lower free energy) than that of the reaction products of (2) which are very unstable, as shown in Fig. A.1.
To summarize, our calculations show that the formation of formamide from the reaction between HNCO and NH3 appears thermodynamically more difficult than from HNCO and H2, in agreement with our experimental results. However, the sizable free-energy barrier of the conversion of HNCO + H2 into formamide – recorded at 63 K and in absence of electric field – justifies the lack of HCONH2 observations in cold interstellar media.
3.3. Formamide synthesis from unbiased simulations under electric field
As indicated by our spectroscopic data, the theoretical results predicting the formation of formamide via reaction (1) rather than via reactions (2) and (3) are in good agreement with the experimental results. In fact, when HNCO + H2 samples have been exposed to electrical discharge, the carbonyl v4 band of formamide has been repeatedly observed; however, formamide has never been detected in any experiment conducted starting from the HNCO + NH3 mixture.
As briefly pointed out in the previous section, all the gasphase simulations have been performed at the nominal temperature of 63 K by means of the MetD assistance and without any external electrical perturbation. Although the simulations were instrumental for the thermodynamic and mechanistic characterization of the reaction pathways, they have been biased by the MetD approach. In order to perform a fully unbiased simulation of the simplest mixture (i.e., HNCO and H2) through a pure AIMD approach, such a numerical sample has been exposed to static electric fields of increasing strengths. In many cases, such a technique has led to the discovery of novel chemical reactions (Cassone et al. 2017b,c) or, for instance, to the atomistic characterization of the Miller-Urey experiments (Saitta & Saija 2014). As in the latter case, the employment of condensed-phase numerical samples allows for a more realistic reproduction – within a pure AIMD approach – of the experimental results stemming from electrical or plasma discharge. In addition, performing such an unbiased computation would allow for the characterization of the reaction channels undertaken by the mixture of HNCO and H2 under electric field.
As is well-known, the application of an external electric field to an H-bonded condensed-phase mixture leads, above a given threshold, to correlated proton transfers (Saitta et al. 2012; Stuve 2012). For instance, the recorded threshold for such an event is 0.25 V Å−1. Although this field strength may appear somewhat prohibitive, nowadays it is well-established that higher field intensities (i.e., 3 V Å−1) are locally present around solvated ions (Cassone et al. 2017a) or generated by dipole fluctuations (Geissler et al. 2011), or even at the proximity of apolar surfaces (Laporte et al. 2015). At the dissociation threshold, the first proton transfer events can uniquely occur from the nitrogen atom of an HNCO molecule to the oxygen atom of another HNCO molecule, as indicated in the following reaction: (4)
(4)
This way, above the dissociation threshold, the system is characterized also by the presence of the cyanate anions (NCO−), the hydrogen cyanate cations (HNCOH+), and the hydrogen cyanate molecules (NCOH), whereas the di-hydrogen molecules are in practice insensitive to the application of the external electric field at this regime.
However, for a field intensity of 0.40 V Å−1, the first nontrivial chemical reactions occur. Indeed, if a hydrogen cyanate cation is oriented with its excess proton toward the amine group of an HNCO molecule, prevalently along the field direction (Fig. 6a), an ultra-fast proton transfer from the oxygen to the nitrogen atom can take place (Fig. 6b). Because of the excess of di-hydrogen in the system, the newly formed H2NCO+ (aminomethanone cation) can be surrounded by such a molecule (Fig. 6b) which, in turn, subjected to the combined action of the external field and of intense local charges can dissociate by donating 1 H+ and 2 e− to H2NCO+, and one proton to a nearby hydrogen cyanate (Fig. 6c). This way, a formamide molecule is formed whereas the just created hydrogen cyanate cation will lose its excess proton in favor of the solvent (Fig. 6d). By means of this cooperative process, formamide molecules have been synthesized in a sample originally composed by HNCO and H2. The fact that, even under such thermodynamic conditions (i.e., about one order of magnitude colder than those present in the experiments) the spontaneous formation of formamide from HNCO + H2 mixtures has been detected, further indicate that the synthesis of the simplest amide under pulse discharge could in principle occur also at lower temperatures.
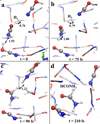 |
Fig. 6. Formamide synthesis in a mixture of HNCO and H2 under the effect of an electric field strength of 0.40 V Å−1. The field direction coincides with the blue arrow at the bottom of panel a. Red, silver, blue, and white colorings refer to oxygen, carbon, nitrogen, and hydrogen atoms, respectively. Some distances (in Å) have been shown in order to better follow the overall mechanism. In panel a, a proton transfer is going to be triggered between a hydrogen cyanate cation and HNCO. This process leads to the transient formation of a H2NCO+ (panel b). Nearby to this latter species, a di-hydrogen molecule dissociates in the fs time-scale by donating one proton and two electrons to H2NCO+ and one proton to a neighbor hydrogen cyanate (panel c). This way, in a hundred of fs, a formamide molecule is formed (panel c) whereas the newly created hydrogen cyanate cation releases its excess proton in favor of the solvent (panel d). Hence, in 210 fs the system locally composed of one hydrogen cyanate cation, one isocyanic acid molecule, one di-hydrogen, and one hydrogen cyanate molecule (panel a) evolves into two isocyanic acid molecules and one molecule of formamide. |
Other species such as carbamate, carbamoyl isocyanate, cyanuric-containing polymers, and a transient CN-containing cyclic compound, have also been synthesized at stronger intensities (i.e., above 0.50 V Å−1). However, formamide is the unique species that a mixture composed of the simplest molecule having the most common atoms found in biochemistry and di-hydrogen is capable to produce for field strengths that normally would lead to trivial proton transfers in similar systems. Additionally, formamide is often employed as an intermediate for the subsequent field-induced polymerization. These latter findings indicate, once again, that there exist uncountable ways to synthesize formamide under disparate chemical and thermodynamic circumstances and that this molecule acts as a key intermediate for the chemical complexification of even a very simple molecular system.
4. Conclusions
In this paper, the glow electric-discharge-induced chemistry of isocyanic acid and its possible conversion to formamide in environment of model planetary atmospheres containing either H2 or NH3 mixed with HNCO have been experimentally investigated. In addition, state-of-the-art computational techniques – where first-principles molecular dynamics and metadynamics approaches have been used in a complementary fashion – have been employed to describe the possible reaction pathways of formation of formamide from HNCO mixed, separately, with H2 and NH3 and exposed to glow electric discharges.
In our experiments, formamide has only been detected in the HNCO mixture containing di-hydrogen upon glow discharge exposure. This finding has been supported by ab initio molecular dynamics simulations coupled with enhanced sampling techniques that allowed us to evaluate the free-energy surfaces characterizing distinct chemical reactions connecting HNCO and formamide. In fact, those biased ab initio simulations have shown that the most favored reaction route for the formamide synthesis is represented by the direct hydrogenation of HNCO. On the other hand, from the latter calculations a free-energy barrier of 60 kcal mol−1 has been determined under low temperatures and in absence of any electrical perturbation. These findings are thus able to account for the lack of formamide observations in cold interstellar regions.
Even more interestingly, unbiased first-principles simulations (i.e., performed without the metadynamics assistance), executed at higher temperatures and by applying intense static electric fields on a mixture of HNCO and H2, prove that the simplest chemical route undertaken by such a system under discharge conditions is represented by the formamide synthesis. In fact, the latter molecule is spontaneously formed for field intensities of 0.40 V Å−1, a threshold which is lower than that necessary for the in silico reproduction of the Miller-Urey experiments.
By synergistically exploiting experimental, computational, and theoretical approaches, we have thus identified a novel plausible prebiotic route for the synthesis of formamide – a key prebiotic species – from ubiquitarious molecules such as HNCO and H2.
Acknowledgments
This work is a part of a research series funded by the Czech Science Foundation (grants no. 17-05076S and 17-04844S), by the programme of Regional Cooperation between the Regions and the Institutes of the Czech Academy of Sciences in 2018 (project no. R200401801) and by the STS Missions programme within the COST Actions CM11401 and TD1308.
References
- Adam, Z. R., Hongo, Y., Cleaves II, H. J., et al. 2018, Sci. Rep., 8, 265 [Google Scholar]
- Adande, G. R., Woolf, N. J., & Ziurys, L. M. 2013, Astrobiology, 13, 439 [NASA ADS] [CrossRef] [Google Scholar]
- Antol, I., Vazdar, M., Barbatti, M., Eckert-Maksic, M. 2008, Chem. Phys., 349, 308 [CrossRef] [Google Scholar]
- Bada, J. L., Chalmers, J. H., & Cleaves II, H. J. 2016, Phys. Chem. Chem. Phys., 18, 20085 [CrossRef] [Google Scholar]
- Barone, V., Latouche, C., Skouteris, D., et al. 2015, MNRAS, 453, L31 [Google Scholar]
- Barth, M. C., Cochran, A. K., Fiddler, M. N., et al. 2013, J. Geophys. Res., 118, 8688 [Google Scholar]
- Becker, S., Schneider, C., Okamura, H., et al. 2018, Nat. Commun. 9, 163 [NASA ADS] [CrossRef] [Google Scholar]
- Benner, S. A., Kim, H.-J., Carrigan, M. A., et al. 2012, Acc. Chem. Res., 45, 2025 [CrossRef] [Google Scholar]
- Besker, N., & Gervasio, F. L. 2012, in Using Metadynamics and Path Collective Variables to Study Ligand Binding and Induced Conformational Transitions. Computational Drug Discovery and Design, Book Series: Methods in Molecular Biology, 819, 501 [Google Scholar]
- Bisschop, S. E., Jorgensen, J. K., van Dishoeck, E. F., & de Wachter, E. B. M. 2007, A&A, 465, 913 [NASA ADS] [CrossRef] [EDP Sciences] [Google Scholar]
- Blake, G. A., Sutton, E. C., Masson, C. R., & Phillips, T. G. 1987, ApJ, 315, 621 [NASA ADS] [CrossRef] [Google Scholar]
- Bockelee-Morvan, D., Lis, D. C., Wink, J. E., et al. 2000, A&A, 353, 1101 [NASA ADS] [Google Scholar]
- Bonomi, M., Branduardi, D., Bussi, G., et al. 2009, Comput. Phys. Commun., 180, 1961 [NASA ADS] [CrossRef] [Google Scholar]
- Branduardi, D., Gervasio, F. L., & Parrinello M. 2007, J. Chem. Phys., 126, 054103 [NASA ADS] [CrossRef] [PubMed] [Google Scholar]
- Brucato, J. R., Baratta, G. A., & Strazzulla, G. 2006, A&A, 455, 395 [NASA ADS] [CrossRef] [EDP Sciences] [Google Scholar]
- Camacho, J. J., Diaz, L., Santos, M., et al. 2008, J. Phys. D-Appl. Phys., 41, 10 [Google Scholar]
- Car, R., & Parrinello, M. 1985, Phys. Rev. Lett., 55, 2471 [NASA ADS] [CrossRef] [PubMed] [Google Scholar]
- Cassone, G., Creazzo, F., Giaquinta, P. V., et al. 2017a, Phys. Chem. Chem. Phys., 19, 20420 [CrossRef] [Google Scholar]
- Cassone, G., Pietrucci, F., Saija, F., et al. 2017b, Chem. Sci., 25, 1 [Google Scholar]
- Cassone, G., Pietrucci, F., & Saija, F., et al. 2017c, Sci. Rep., 7, 6901 [NASA ADS] [CrossRef] [Google Scholar]
- Churchwell, E., Wood, D., Myers, P. C., & Myers, R. V. 1986, ApJ, 305, 405 [NASA ADS] [CrossRef] [Google Scholar]
- Civiš, S., Kubat, P., Nishida, S., Kawaguchi, K. 2006, Chem. Phys. Lett., 418, 448 [NASA ADS] [CrossRef] [Google Scholar]
- Civis, S., Babankova, D., & Cihelkat, J., et al. 2008, J. Phys. Chem. A, 112, 7162 [CrossRef] [Google Scholar]
- Civis, M., Civis, S., Sovova, K., et al. 2011, Anal. Chem., 83, 1069 [CrossRef] [Google Scholar]
- Civiš, S., Kubelik, P., & Ferus, M. 2012, J. Phys. Chem. A, 116, 3137 [CrossRef] [Google Scholar]
- Civis, S., Ferus, M., Knizek, A., et al. 2016, Phys. Chem. Chem. Phys., 18, 27317 [CrossRef] [Google Scholar]
- Civiš, S., Knížek, A., Ivanek, O., et al. 2017, Nat. Astron., 1, 721 [NASA ADS] [CrossRef] [Google Scholar]
- Cloutier, P., Sicard-Roselli, C., Escher, E., & Sanche, L. 2007, J. Phys. Chem. B, 111, 1620 [CrossRef] [PubMed] [Google Scholar]
- Coates, A. J., Crary, F. J., Lewis, G. R., et al. 2007, Discovery of Heavy Negative ions in Titan's Ionosphere, 34, 6 [Google Scholar]
- Codella, C., Ceccarelli, C., Caselli, P., et al. 2017, A&A, 605, L3 [Google Scholar]
- Cooper, J. F., Cooper, P. D., Sittler, E. C., et al. 2009, Planet Space Sci., 57, 1607 [NASA ADS] [CrossRef] [Google Scholar]
- Costanzo, G., Saladino, R., Crestini, C., et al. 2007, BMC Evol. Biol., 7, S1 [CrossRef] [Google Scholar]
- Eckert-Maksić, M., Antol, I., Vazdar, M., et al. 2010, in Formamide as the Model Compound for Photodissociation Studies of the Peptide Bond, eds. P. Paneth, & A. Dybala-Defratyka (Springer Netherlands), Kinetics and Dynamics Challenges and Advances in Computational Chemistry and Physics, 77 [Google Scholar]
- Ferris, J. P., Wos, J. D., Nooner, D. W., et al. 1974, J. Mol. Evol., 3, 225 [NASA ADS] [CrossRef] [Google Scholar]
- Ferus, M., Civiš, S., Kubelik, P., et al. 2011a, Plasma Chem. Plasma Process., 31, 417 [CrossRef] [Google Scholar]
- Ferus, M., Kubelik, P., & Civiš, S. 2011b, J. Phys. Chem. A, 115, 12132 [CrossRef] [Google Scholar]
- Ferus, M., Kubelik, P., Kawaguchi, K., et al. 2011c, J. Phys. Chem. A, 115, 1885 [CrossRef] [Google Scholar]
- Ferus, M., Civiš, S., Mladek, A., et al. 2012, J. Am. Chem. Soc., 134, 20788 [CrossRef] [Google Scholar]
- Ferus, M., Michalčíková, R., Shestivská, V., et al. 2014, J. Phys. Chem., 118, 719 [Google Scholar]
- Ferus, M., Knizek, A., Sponer, J. E., et al. 2015a, Chem. List, 109, 406 [Google Scholar]
- Ferus, M., Nesvorný, D., Šponer, J., et al. 2015b, Proc. Natl. Acad. Sci., 112, 657 [Google Scholar]
- Ferus, M., Kubelík, P., Knížek, A., et al. 2017a, Sci. Rep. 7, 6275 [NASA ADS] [CrossRef] [Google Scholar]
- Ferus, M., Pietrucci, F., Saitta A. M., et al. 2017b, Proc. Natl. Acad. Sci., 114, 4306 [Google Scholar]
- Geissler, P. L., Dellago, C., Chandler, D., et al. 2001, Science, 291, 2121 [NASA ADS] [CrossRef] [Google Scholar]
- Giannozzi, P., Baroni, S., Bonini, N., et al. 2009, J. Phys. Condens. Matter., 21, 395502 [Google Scholar]
- Goesmann, F., Rosenbauer, H., Bredehoeft, J. H., et al. 2015, Science, 349 [Google Scholar]
- Gorb, L., Asensio, A., Tunon, I., & Ruiz-Lopez, M. F. 2005, Chem. Eur. J. 11, 6743 [CrossRef] [Google Scholar]
- Hartle, R. E., Sittler, Jr., E. C., Neubauer F. M., et al. 2006, in Preliminary interpretation of Titan Plasma Interaction as Observed by the Cassini Plasma Spectrometer: Comparisons with Voyager 1, 33, 1 [Google Scholar]
- Hébrard, E., Dobrijevic, M., Loison, J., et al. 2012, A&A, 541, A21 [NASA ADS] [CrossRef] [EDP Sciences] [Google Scholar]
- Hoerst, S. M., Yelle, R. V., Buch, A., et al. 2012, Astrobiology, 12, 809 [NASA ADS] [CrossRef] [Google Scholar]
- Hudson, J. S., Eberle, J. F., Vachhani, R. H., et al. 2012, Angew. Chemie. – Int. Ed., 51, 5134 [CrossRef] [Google Scholar]
- Jackson, D. A., Berg, P., & Symons, R. H. 1972, Proc. Natl. Acad. Sci. USA, 69, 2904 [NASA ADS] [CrossRef] [Google Scholar]
- Kahane, C., Ceccarelli, C., Faure, A., & Caux, E. 2013, ApJ, 763, L38 [Google Scholar]
- Kakumoto, T., Saito, K., & Ikamura, A. 1985, J. Phys. Chem., 89, 2286 [CrossRef] [Google Scholar]
- Kang, T. Y., & Kim, H. L. 2006, Chem. Phys. Lett., 431, 24 [NASA ADS] [CrossRef] [Google Scholar]
- Kramida, A., Ralchenko, Y., Reader, J., & NIST ASD Team 2015, NIST Atomic Spectra Database ver. 5.3 (Gaithersburg, MD: National Institute of Standards and Technology) [Google Scholar]
- Kuan, Y. J., & Snyder, L. E. 1996, ApJ, 470, 981 [NASA ADS] [CrossRef] [Google Scholar]
- Laio, A., & Parrinello, M. 2002, Proc. Natl. Acad. Sci., 99, 12562 [Google Scholar]
- Laporte, S., Finocchi, F., Paulatto, L., et al. 2015, Phys. Chem. Chem. Phys., 17, 20382 [CrossRef] [Google Scholar]
- Levy, M., Miller, S. L., Oro, J. 1999, J. Mol. Evol., 49, 165 [NASA ADS] [CrossRef] [Google Scholar]
- Liu, D., Fang, W. H., & Fu, X. Y. 2000, Chem. Phys. Lett., 318, 291 [NASA ADS] [CrossRef] [Google Scholar]
- Marcelino, N., Bruenken, S., Cernicharo, J., et al. 2010, A&A, 516, A105 [NASA ADS] [CrossRef] [EDP Sciences] [Google Scholar]
- Mendoza, E., Lefloch, B., Lopez-Sepulcre, A., et al. 2014, MNRAS, 445, 151 [NASA ADS] [CrossRef] [MathSciNet] [Google Scholar]
- Mispelaer, F., Theule, P., Duvernay, F., et al. 2012, A&A, 540, A40 [NASA ADS] [CrossRef] [EDP Sciences] [Google Scholar]
- Miyakawa, S., Cleaves, H. J., & Miller, S. L. 2002, Orig. Life Evol. Biosph., 32, 195 [NASA ADS] [CrossRef] [Google Scholar]
- Muller, S., Beelen, A., Black, J. H., et al. 2013, A&A, 551, A109 [NASA ADS] [CrossRef] [EDP Sciences] [Google Scholar]
- Mumma, M. J., & Charnley, S. B. 2011, in The Chemical Composition of Comets-Emerging Taxonomies and Natal Heritage, eds. S. M. Faber, & E. VanDishoeck, Annual Review of Astronomy and Astrophysics, 471 [NASA ADS] [CrossRef] [Google Scholar]
- Nemes, L., Mohai, M., Donko, Z., & Bertoti, I. 2000, Spectrochim. Acta Part A – Mol. Biomol. Spectrosc., 56, 761 [NASA ADS] [CrossRef] [Google Scholar]
- Nguyen-Q-Rieu, H. C., Jackson, J. M., & Mauersberger, R. 1991, A&A, 241, L33 [NASA ADS] [Google Scholar]
- Nguyen V. S., Abbott, H. L., Dawley, M. M., et al. 2011, J. Phys. Chem. A, 115, 841 [CrossRef] [Google Scholar]
- Okabe, H. 1970, J. Chem. Phys., 53, 3507 [NASA ADS] [CrossRef] [Google Scholar]
- Perdew, J. P., Burke, K., & Ernzerhof, M. 1996, Phys. Rev. Lett., 77, 3865 [Google Scholar]
- Pietrucci, F., & Saitta, A. M. 2015, Proc. Natl. Acad. Sci. USA, 112, 15030 [NASA ADS] [CrossRef] [Google Scholar]
- Pino, S., Sponer, J. E., Costanzo, G., et al. 2015, Life, 5, 372 [CrossRef] [Google Scholar]
- Raulin, F., & Owen, T. 1998, Org. Chem. Exobiol. Titan, 377 [Google Scholar]
- Raunier, S., Chiavassa, T., Marinelli, F., et al. 2003a, J. Phys. Chem. A, 107, 9335 [CrossRef] [Google Scholar]
- Raunier, S., Chiavassa, T., Marinelli, F., et al. 2003b, Chem. Phys. Lett., 368, 594 [NASA ADS] [CrossRef] [Google Scholar]
- Rodriguez-Fernandez, N. J., Tafalla, M., Gueth, F., & Bachiller, R. 2010, A&A, 516, A98 [NASA ADS] [CrossRef] [EDP Sciences] [Google Scholar]
- Rothman, L. S., Gordon, I. E., Babikov, Y et al. 2013, J. Quant. Spectr. Rad. Transf., 130, 4 [Google Scholar]
- Rubin, R. H., Swenson, G. W., Benson, R. C., et al. 1971, ApJ, 169, L39 [NASA ADS] [CrossRef] [Google Scholar]
- Saitta, A. M., & Saijam, F. 2014, Proc. Natl. Acad. Sci. USA, 111, 13768 [NASA ADS] [CrossRef] [Google Scholar]
- Saitta, A. M., Saija, F., & Giaquinta, P. V. 2012, Phys. Rev. Lett., 108, 207801 [NASA ADS] [CrossRef] [Google Scholar]
- Saladino, R., Crestini, C., Costanzo, G., & DiMauro, E. 2004, Curr. Org. Chem., 8, 1425 [CrossRef] [Google Scholar]
- Saladino, R., Crestini, C., Neri, V., et al., 2005, Chembiochem., 6, 1368 [CrossRef] [Google Scholar]
- Saladino, R., Neri, V., Crestini, C., et al. 2008, J. Am. Chem. Soc., 130, 15512 [CrossRef] [Google Scholar]
- Saladino, R., Crestini, C., Ciciriello, F., et al. 2009, Res. Microbiol., 160, 441 [CrossRef] [Google Scholar]
- Saladino, R., Neri, V., Crestini, C., et al. 2010, J. Mol. Evol., 71, 100 [NASA ADS] [CrossRef] [Google Scholar]
- Saladino, R., Crestini, C., Cossetti, C., et al. 2011, Orig. Life Evol. Biosph., 41, 437 [NASA ADS] [CrossRef] [Google Scholar]
- Saladino, R., Botta, G., Pino, S., et al. 2012a, Chem. Soc. Rev., 41, 5526 [CrossRef] [Google Scholar]
- Saladino, R., Crestini, C., Pino, S., et al. 2012b, Phys. Life Rev. 9, 84 [NASA ADS] [CrossRef] [Google Scholar]
- Saladino, R., Carota, E., Botta, G., et al. 2015, Proc. Natl. Acad. Sci., 112, E2746 [Google Scholar]
- Senanayake, S. D., & Idriss, H. 2006, Proc. Natl. Acad. Sci. USA, 103, 1194 [NASA ADS] [CrossRef] [Google Scholar]
- Snyder, L. E., & Buhl, D. 1972, ApJ, 177, 619 [NASA ADS] [CrossRef] [Google Scholar]
- Šponer, J. E., Mladek, A., Sponer, J., Fuentes-Cabrera, M. 2012, J. Phys. Chem. A, 116, 720 [CrossRef] [Google Scholar]
- Šponer, J. E., Sponer, J., Novakova, O., et al. 2016a, Chem. Eur. J., 22, 3572 [CrossRef] [Google Scholar]
- Šponer, J. E., Szabla, R., Góra, R. W., et al. 2016b, Phys. Chem. Chem. Phys., 18, 20047 [CrossRef] [Google Scholar]
- Stuve, E. M. 2012, Chem. Phys. Lett., 1, 519 [Google Scholar]
- Sutherland, J. D. 2016, Angew. Chemie. – Int. Ed., 55, 104 [Google Scholar]
- Taquet, V., Lopez-Sepulcre, A., Ceccarelli, C., et al. 2015, ApJ, 804, 29 [Google Scholar]
- Turner, B. E., Terzieva, R., & Herbst, E. 1999, ApJ, 518, 699 [NASA ADS] [CrossRef] [Google Scholar]
- Wang, H., Liu, S.-L,. Liu, J., et al. 2007, Ch. J. Chem. Phys., 20, 388 [CrossRef] [Google Scholar]
- Wang, J., Gu, J., Nguyen, M. T., et al. 2013, J. Phys. Chem. B, 117, 9333 [CrossRef] [Google Scholar]
- Yu, S., Su, S., Dorenkamp, Y., et al. 2013, J. Phys. Chem. A., 117, 11673 [CrossRef] [Google Scholar]
- Yuasa, S., Flory, D., Basile, B., & Oró, J. 1984, J. Mol. Evol. J. Mol. Evol., 21, 76 [NASA ADS] [CrossRef] [Google Scholar]
- Zhang, X. Z., Zhen, Z., Liu, X. H. 2005, Sci. Ch. Ser. B-Chem., 48, 279 [CrossRef] [Google Scholar]
- Zhao, L., Liu, K., Dai, N. Z., & Li, Z. H. 2002, Acta Chim. Sin. 60, 600 [Google Scholar]
- Zizak, G. 2000, in Flame Emission Spectroscopy: Fundamentals and Applications. Lect Given ICS Train Course Lase Diagnostics Combust Process, 1. [Google Scholar]
Appendix A:
A.1. Discharge plasma characterization
The conditions present in glow discharges have been estimated by evaluating the carbon monoxide emission bands in the infrared spectral range. Temperature is one of the most important features of the plasma for defining the conditions for the kinetic model. In general, temperature describes the energetic distribution of the particles in the system. For its evaluation, the system is assumed to be at a local thermodynamic equilibrium and therefore to follow the Boltzmann distribution law. Of course, the system is characterized by a set of various temperatures: the electron excitation temperature (Tel), the vibrational temperature (Tv), the rotational temperature (Tρ), and the kinetic temperature (Tσ). Once the global equilibrium is reached, all the temperatures must be equal. In the case of LTE but non-isothermal plasma, as observed in the case of glow discharges, the following relation holds: (A.1)
(A.1)
The rotation temperature is usually considered to be the closest to the kinetic temperature, which is a key parameter for the determination of the reaction rate constants. The possibility of obtaining information regarding the temperature is one of the major advantages of the exploited experimental method. In this study, the vibrational temperature Tv has been directly obtained from a simple rotation-vibration spectrum by plotting the relation from Civiš et al. (2012). In the case of pure electronic transitions, the vibrational number v has to be replaced by the Franck–Condon factor. The temperature is then obtained from the following relationship (A.2)
(A.2)
where kB is the Boltzmann constant. To this aim, carbon dioxide emission has been used. The energy terms and the vibrational quantum numbers accessible in the HITRAN database (Rothman et al. 2013) have been used. The vibrational temperature has been determined for the emission spectra of all the mixtures. It turns out that its mean value converged at 2500 K since the vibrational transitions showed similar energy distribution profiles. The rotational temperature was calculated by using the parametrized equations describing the rotational distribution. For this calculation, the Boltzmann plane has been used, which is equivalent to the general description of a set of discrete pure rotational-vibrational transitions (A.3)
(A.3)
where S is the Hönl-London factor. Similarly to the vibrational temperature, the values of the rotation temperature estimated for all the discharges are similar and its average value falls at 610 K. The excitation temperature is a crucial plasma physics quantity. It describes indeed the real temperature of the system. Again, by using the Boltzmann plane, the excitation temperature has evaluated through the following equation (A.4)
(A.4)
where C is a constant that includes the concentration of the investigated species having electronic transition at the frequency vij and the Einstein's A coefficient from the gi-times degenerated upper energy level. In our particular case, Tel has been estimated by using the emission lines of singly-ionized atomic nitrogen N II which were detected in all the UV–ViS emission spectra in a sufficient amount. The numerical values varied by approximately 10 000 K, while the lowest excitation temperature has been observed in the spectra of isocyanic acid mixed with di-hydrogen in argon gas atmosphere and the highest one in the spectra of the mixture HNCO + NH3 in helium atmosphere. The increase of the excitation temperature within the nitrogen-containing mixtures in comparison with pure HNCO and HNCO with di-hydrogen in argon gas medium might have been caused by the additional presence of excited nitrogen atoms generated during the discharge but also by the different profiles of the emission intensity of the species observed in the UV–ViS spectra caused by the variations in the chemical processes.
The electron density has also been obtained using the fit of the bright atomic lines which can be, at our conditions, approximated by a Lorentzian distribution. This way, the spectral line broadening observed within the full width at half-maximum (FWHM) can be seen as the result of the interaction of the investigated atomic states with free electrons. Using the tabulated Stark width parameters, the electron density can be directly calculated, as listed in Table A.1.
Discharge parameters estimated from the 1−0 and the second harmonic 2−0 CO bands for each sample mixture.
A.2. Ab initio molecular dynamics and metadynamics simulations
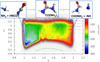 |
Fig. A.1. Free-energy landscape of the synthesis of formamide and •NH from isocyanic acid and ammonia at T = 63 K (i.e., reaction (2) of the main text). During the chemical conversion of the reactants into the products the system spontaneously explores a (meta)stability basin ascribed to the urea molecule (CO(NH2)2) at (S, Z) ~ (1.8, 1.0). Incidentally, this basin is more stable than that related to the expected products (i.e., formamide and •NH). |
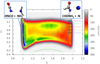 |
Fig. A.2. Free-energy landscape of the synthesis of formamide and •N from isocyanic acid and the amino radical •NH2 at T = 63 K (i.e., reaction (3) of the main text). As it is visible from the respective basins, the reactants are clearly more stable than the products. |
All Tables
Discharge parameters estimated from the 1−0 and the second harmonic 2−0 CO bands for each sample mixture.
All Figures
|
Fig. 1. Schematic diagram of the emission FTIR time resolved Bruker IFS 120, Echelle UV–ViS and absorption FTIR Bruker IFS 125 spectroscopic set-up for inspection of the HNCO glow discharges. |
| In the text | |
|
Fig. 2. Absorption spectra of the discharge products formed in HNCO + He (panel A), HNCO + H2 (panel B), and HNCO + NH3 (panel C) mixtures. In panel B, the formamide carbonyl v4 band observed in the mixture of HNCO + H2 is enlarged in the red frame for clarity and compared with 10 ppm of vapors (Rothman et al. 2013). |
| In the text | |
|
Fig. 3. UV–Vis emission spectra of the glow discharge in mixture of HNCO with hydrogen. In optical emission spectra, other discharge mixture exhibited similar palette of species differing only in emission intensity. Assignments adopted from Okabe (1970), Civis et al. (2008, 2016), Zizak (2000), Camacho et al. (2008) and Nemes et al. (2000). |
| In the text | |
|
Fig. 4. Free-energy landscape of the synthesis of formamide from isocyanic acid and di-hydrogen at T = 63 K. The free-energy landscape is shown in the space spanned by the Collective Variables S and Z. The former variable represents the progress along the chemical transformation (i.e., the geometrical evolution of the system from the reactants toward the products) whereas the latter the distance from an ideal pathway. |
| In the text | |
|
Fig. 5. Reaction pathway revealed by ab initio molecular dynamics simulations coupled with metadynamics that characterizes the transformation of a gas phase HNCO + H2 mixture into formamide. A dissociative mechanism of di-hydrogen (upper panel) leads to the simultaneous hydrogenation of the nitrogen and carbon atoms and thus to the formamide synthesis (bottom panel). |
| In the text | |
|
Fig. 6. Formamide synthesis in a mixture of HNCO and H2 under the effect of an electric field strength of 0.40 V Å−1. The field direction coincides with the blue arrow at the bottom of panel a. Red, silver, blue, and white colorings refer to oxygen, carbon, nitrogen, and hydrogen atoms, respectively. Some distances (in Å) have been shown in order to better follow the overall mechanism. In panel a, a proton transfer is going to be triggered between a hydrogen cyanate cation and HNCO. This process leads to the transient formation of a H2NCO+ (panel b). Nearby to this latter species, a di-hydrogen molecule dissociates in the fs time-scale by donating one proton and two electrons to H2NCO+ and one proton to a neighbor hydrogen cyanate (panel c). This way, in a hundred of fs, a formamide molecule is formed (panel c) whereas the newly created hydrogen cyanate cation releases its excess proton in favor of the solvent (panel d). Hence, in 210 fs the system locally composed of one hydrogen cyanate cation, one isocyanic acid molecule, one di-hydrogen, and one hydrogen cyanate molecule (panel a) evolves into two isocyanic acid molecules and one molecule of formamide. |
| In the text | |
|
Fig. A.1. Free-energy landscape of the synthesis of formamide and •NH from isocyanic acid and ammonia at T = 63 K (i.e., reaction (2) of the main text). During the chemical conversion of the reactants into the products the system spontaneously explores a (meta)stability basin ascribed to the urea molecule (CO(NH2)2) at (S, Z) ~ (1.8, 1.0). Incidentally, this basin is more stable than that related to the expected products (i.e., formamide and •NH). |
| In the text | |
|
Fig. A.2. Free-energy landscape of the synthesis of formamide and •N from isocyanic acid and the amino radical •NH2 at T = 63 K (i.e., reaction (3) of the main text). As it is visible from the respective basins, the reactants are clearly more stable than the products. |
| In the text | |
Current usage metrics show cumulative count of Article Views (full-text article views including HTML views, PDF and ePub downloads, according to the available data) and Abstracts Views on Vision4Press platform.
Data correspond to usage on the plateform after 2015. The current usage metrics is available 48-96 hours after online publication and is updated daily on week days.
Initial download of the metrics may take a while.