| Issue |
A&A
Volume 616, August 2018
|
|
|---|---|---|
| Article Number | A154 | |
| Number of page(s) | 12 | |
| Section | Stellar atmospheres | |
| DOI | https://doi.org/10.1051/0004-6361/201731541 | |
| Published online | 06 September 2018 | |
Magnetic activity evolution on Sun-like stars
European Space Agency, ESTEC – Postbus 299, 2200 AG, Noordwijk, The Netherlands
e-mail: This email address is being protected from spambots. You need JavaScript enabled to view it.
Received:
10
July
2017
Accepted:
27
May
2018
Abstract
Context. Characterising the time evolution of magnetic activity on Sun-like stars is important not only for stellar physics but also for determining the environment in which planets evolve.
Aims. In recent decades, many surveys of open clusters have produced extensive rotation periods measurements on Sun-like stars of different ages. The present study uses this information with the aim to improve the description of their magnetic activity evolution.
Methods. I present a method that infers the long-term evolution of Ca II chromospheric (R′HK) and X-ray coronal (LX) emission on solar mass stars by combining a best fit parametric model of their rotation evolution with empirical rotation-activity relationships.
Results. The inferred scenario reproduces the high chromospheric and coronal emission levels around R′HK ≈ 10−4 and LX ≈ 1030 erg s−1 that are observed on pre-main sequence (PMS) stars. At the end of the PMS contraction phase around the age of ~30 Myr, the slowest rotating stars experience a rapid transition of their magnetic activity to more moderate levels around R′HK ≈ 4 × 10⁻⁵ and L5 ≈ 1029 erg s−1. This transition occurs later on more rapidly rotating stars, up to an age of ~600 Myr for the fastest rotators. After this brief episode of large magnetic activity decay, the average chromospheric and coronal emission levels of solar-mass stars decrease steadily converging towards similar values (R′HK ≈ 10−5 and LX ≈ 1027 erg s−1) by the age of the Sun.
Conclusion. The study suggests that solar mass stars in open clusters with ages between ~30 and ~600 Myr exhibit bimodal distributions of their R′HK chromospheric activity indices and coronal X-ray to bolometric luminosity ratios that can be traced back to their rotation evolution. This conclusion is consistent with available measurements of activity indices from Sun-like stars in nearby open clusters.
Key words: open clusters and associations: general / stars: activity / stars: chromospheres / stars: coronae / stars: solar-type / Sun: evolution
© ESO 2018
1. Introduction
Characterising the evolution of magnetic activity on Sun-like stars is important not only for stellar physics, but also for understanding the environment in which planets evolve. Magnetic Activity can have a strong impact on the long-term evolution of planetary atmospheres (e.g. Kulikov et al. 2007; Lammer et al. 2008; Forget & Leconte 2014).
The evolution of magnetic activity in cool stars has been the subject of many studies. Some of them have taken benefit of the homogeneous, co-eval stellar population of open clusters for calibrating empirical age-activity relationships (e.g. Nunez & Agueros 2016). Other studies focus on magnetic activity signatures from individual stars of different ages (Güdel 2007; Gondoin et al. 2012; Booth et al. 2017). Such signatures include the emission reversal in the core of the Ca II H & K lines (see Hall 2008 and reference therein) and the coronal X-ray emission (e.g. Schrijver & Zwaan 2000; Pevtsov et al. 2003).
Skumanich (1972) initially reported that a comparison of the Ca II emission luminosity for the Pleiades, Ursa Major, and Hyades stars and the Sun indicates an emission decay which varies as the inverse square root of the age. More recently, Pace & Pasquini (2004) argue that the decay of the chromospheric activity between 500 Myr and 2 Gyrs is similar but steeper than the inverse square root of time. Mamajek & Hillenbrand (2008) derive an improved activity-age calibration for solar-type dwarfs between the age of the Hyades and that of the Sun by combining cluster activity data with modern cluster age estimates.
Regarding the coronal X-ray emission, the current picture (see Güdel 2007 and references therein) is that solar mass stars enter the main sequence in a saturation regime with little evolution of their X-ray and UV luminosity. At ages up to 200 Myr, the stars coronae drop out of the saturation regime and their X-ray luminosity decays as t−1.5 where t is the stellar age (Maggio et al. 1987; Güdel et al. 1997).
These relationships between chromospheric or coronal activity indicators and ages provide a simple description of the long-term evolution of magnetic activity on Sun-like stars. However, they do not account for the wide spread of activity levels that are observed in young clusters among solar mass stars of similar ages. Neither do they take into account the rotation history of individual stars that play a role in the evolution of their activity level (Gondoin 2012, 2013).
The dependence on stellar mass, age and rotation renders a direct measurement of the magnetic activity evolution difficult. In addition, the long-term evolutionary trend of activity indicators is blurred by the short-time variability of magnetic phenomena that includes the evolution of active regions and activity cycles.
The determination of an average magnetic activity level at different ages thus requires observations of large numbers of coeval stars. Such samples are found in open clusters but their observations generally lead to incomplete measurements. Those are limited by the low brightnesses of activity indicators in weakly or moderately active stars and by the large distances of clusters. Moreover, few clusters are older than 600 Myr. An alternative approach is to measure activity indices on a large number of field stars but their ages are seldom known to sufficient accuracy.
In order to overcome these difficulties, the present study intends to characterise the long-term evolution of magnetic activity on Sun-like stars indirectly. The approach consists of combining a best fit parametric model of their rotation evolution with rotation-activity relationships.
Stellar activity is closely related to rotation and its interplay with convection. Pallavicini et al. (1981) first found a correlation between the X-ray luminosities and projected rotational velocities of G to M stars including giants and binary stars. Mangeney & Praderie (1984) suggested that the convection-rotation interaction is better represented by an effective Rossby number that measures the efficiency of rotation in inducing helicity and differential rotation (Durney & Latour 1978). This stellar-mass dependent parameter has been used to minimise the scatter due to mass in many studies of correlations between rotation and activity. Empirical rotation-activity relationships have been obtained for stars with different masses, rotation periods, and activity levels. They provides reliable estimates of the chromospheric emission in the core of the Ca II H & K lines (e.g. Mamajek & Hillenbrand 2008) and of the X-ray to bolometric luminosity ratio (e.g. Pizzolato et al. 2003; Wright et al. 2011).
In the past decade, photometric surveys of open clusters (see e.g. Affer et al. 2013; Delorme et al. 2011; Hartman et al. 2009, 2010; Henderson & Stassun 2012; Irwin et al. 2008, 2009; Meibom et al. 2009, 2011) have produced extensive rotation period measurements on Sun-like stars of different ages. These results have been used to test angular momentum evolution models (e.g., MacGregor & Charbonneau 1995; Krishnamurthi et al. 1997; Allain 1998; Denissenkov et al. 2010; Reiners & Mohanty 2012; Gallet & Bouvier 2013). These models reproduce the spin-up during pre-main sequence contraction followed by a rapid spin-down during early evolution on the main sequence. They describe the narrowing of the dispersion of rotation periods among solar-type stars as these reach the age of the Hyades. A recent model (Gondoin 2017) also produces a bimodal distribution of stellar rotation that is observed in young open clusters (e.g., Barnes 2003; Meibom et al. 2009, 2011).
The present study uses those recent results to gain a new insights into the long-term evolution of magnetic activity on Sun-like stars. Section 2 describes the derivation of the best fit parameters of a rotation evolution model using measurements of stellar rotation periods in open clusters of various ages. Section 3 combines this best fit model with rotation-activity relationships to calculate the long-term evolution of chromospheric and coronal activity indices. Section 4 compares the derived description of the magnetic activity evolution on Sun-like stars with measurements of activity indicators in open clusters. The results are summarised in Sect. 5.
2. Rotation evolution model
A parametric model of rotation evolution on Sun-like stars can be obtained by combining the so-called double zone model (see e.g MacGregor & Brenner 1991; Keppens et al. 1995; Allain 1998; Spada et al. 2011; Oglethorpe & Garaud 2013) with the one dimensional model of Weber & Davis 1967 that quantifies the torque Tw exerted by the wind on the star. Gondoin (2017) described such a combined model with four free parameters, namely (i) the initial angular rotation velocity of the star after dispersion of its circumstellar disk, (ii) the mass loss rate Ṁsat of the stellar wind at fast rotation, (iii) the Alfven radius RA,0 at a given rotation rate or Rossby number, and (iv) the coupling timescale τcp between the radiative core and the convective envelope of the star that are assumed to rotate rigidly.
The free parameters of the model can be constrained if one assumes that the distributions of rotation periods among Sun-like stars in open clusters of various ages result from the evolution of one initial distribution of rotation periods after dispersion of circumstellar disks. This assumption is justified by the fact that Sun-like stars in the Pleiades, M50, and M35 that have similar ages also show similar distributions of rotation periods. Rotation period measurements in the 5 Myr-old open cluster NGC 2362 by Irwin et al. (2008) provides such an initial distribution. For 0.7–1.1 M⊙ stars, it can be approximated to a normal distribution of rotation periods truncated below 0.3 days with a maximum around 7 days (see top left panel of Fig. 4 in Gondoin 2017).
To retrieve the best fit parameters of the model, I calculated the evolution of this initial distribution with 979 stars applying the rotation evolution model to each individual stars. The obtained distributions of rotation periods at subsequent ages were compared with measured histograms of rotation periods among 0.9–1.1 M⊙ stars in various open clusters. I then adjusted the model parameters, namely Ṁsat, RA,0, and τcp, and iterated untill a best fit was obtained.
This method was initially applied by Gondoin (2017) using the Pleiades, M50, M35, M37 open clusters and the Sun for reference comparisons. These open clusters show a broad range of rotation periods but are of a reasonable size for establishing rotation period distributions with large enough statistical significance. In the present study, I used, instead of the solar rotation rate, rotation periods measurements in NGC 6811 (Meibom et al. 2011),NGC 6819 (Meibom et al. 2015), and M67 (Barnes et al. 2016). Since these old clusters show narrow distributions of rotation periods, a few stellar members with known masses and rotation periods are sufficient to constrain the rotation of solar mass stars at the corresponding ages.
The clusters ages, numbers of sample stars per mass interval, and references to the parent surveys that I used for the derivation of the best fit model parameters are given in Table 1. Regarding NGC 6811, Sandquist et al. (2016) find a preferred age of1 ± 0.05 Gyr from colour-magnitude diagrams. This value is consistent with the age (1.05 ± 0.14 Gyr) derived from the mass-radius combination for the primary star of a partially eclipsing long-period binary but smaller than that from the secondary star (1.21 ± 0.2 Gyr).
For NGC 6819, Bedin et al. (2015) present an age of 2.25 ± 0.20 Gyr using the faint end of the white dwarf cooling sequence (Kalirai et al. 2009). This result is compatible with the 2.21 ± 0.3 Gyr age of the colour-magnitude diagram found by Brewer et al. (2016). Using all measured eclipsing binary star masses and radii, these authors constrain the age of NGC 6819to 2.38 ± 0.27 Gyr.
Depending on the assumed chemistry, the derived age of M67 varies from 3.6 to 4.6 Gyr (VandenBerg et al. 2004). Comparisons of the theoretical isochrones of Girardi et al. (2002) and Dotter et al. (2008)to the 2MASS colour-magnitude diagram of M67 suggest ages of 3.5 and 4.0 Gyr, respectively (Sarajedini et al. 2009).
Using τcp = 30 Myr and Ṁsat = 300Ṁ⊙ with an average solar mass loss rate Ṁ⊙ = 2.5 × 10⁻¹⁴ M⊙ yr−1 for a solar mass star (Wang 1998), I find that RA,0 = 8 R⊙ at the solar rotation period P⊙ = 26.09 day) leads to rotation periods in the range 24–30 days at an age of 4.0 Gyrs for initial rotation periods ranging from 0.6 to 30 days at 5 Myr. This range of rotation periods at 4.0 Gyr is consistent with the values observed in M67 (Barnes et al. 2016).
A modification of RA,0 changes significantly the position of the maximum of the slow rotator distribution for mid-age and old clusters. The value RA, 0 = 8 R⊙ provides the best fit to the measured distributions of rotation periods in the Pleiades, M50, M35, M37, NGC 6811, and NGC 6819. It is comparable to the value RA, ⊙ = 7 R⊙ derived by Gondoin (2017) from the solar rotation rate.
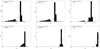 |
Fig. 1. Simulated evolution of a normal rotation period distribution of solar mass stars compared with measured rotation period histograms of 0.9–1.1 M⊙ stars in the Pleiades (112 Myr), M50 and M35 (130 Myr), M37 (550 Myr), NGC 6811 (1050 Myr), NGC 6819 (2380 Myr), and M67 (4000 Myr). |
The core-envelope coupling timescale is also well constrained. A reduction of τcp below the 30 Myr best fit value shifts the fast rotator sequences of intermediate age clusters (Pleiades, M50, and M35) towards a higher rotation rate without affecting the slow rotator sequences. On old clusters (M37, NGC 6811, NGC 6819, and M67), a reduction of τcp shifts the slow rotator sequences towards an even slower rotation.
A reduction of the mass loss rate parameter, Ṁsat, leads to a decrease of the rotation period cut-off at fast rotation, meaning that the fast rotators on the fast rotating sequence tend to rotate more rapidly. A reduction of Ṁsat has no effect on the location of the maximum of the distribution of the slow rotator sequence but extends the tail of the slow rotator sequences in old clusters towards a higher rotation rate. There are, however, not enough stars in the measured rotation period histograms of old clusters to use this effect to constrain Ṁsat. A value Ṁsat included between 200 Ṁ⊙ and 300 Ṁ⊙ provide a reasonable fit to the distributions of rotation periods in the Pleiades, M50, and M35.
Figure 1 compares the simulated histograms of rotation periods derived from the best fit model (see Table 2) with rotation period distributions of 0.9–1.1 M⊙ stars in the reference open clusters (see Table 1). Since M50 and M35 have similar ages and similar rotation period distributions, their rotation period histograms were concatenated. The numbers of stars in the simulated histograms are scaled to the numbers of stars in the measured histograms. The calculated distributions reproduce reasonably well the main characteristics of the measured histograms including the bimodal distribution of stellar rotation in young open clusters.
Figure 2 shows the evolution of the angular rotation velocity of 1.0 M⊙ stars with initial rotation periods of 1, 2, 3, 6, 10, and 20 days at an age of 5 Myr calculated with the best fit model (see parameters listed in Table 2). It shows the spin-up phase during pre-main sequence contraction followed by a spin-down near the ZAMS and during further evolution on the main sequence. The Model reproduces the dispersion of rotation periods among solar-type stars in young open clusters and the narrowing of their distribution beyond an age of about 600 Myr.
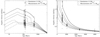 |
Fig. 2. Simulated angular velocity evolutions of 1.0 M⊙ stars with initial rotation periods at 5 Myr of 1 (upper curve), 2, 3, 6, 10, and 20 days (lower curve). Left: the simulated angular velocity curves in log-log scale are compared with rotation measurements of 0.9–1.1 M⊙ stars (black crosses) in the Pleiades (112 Myr; Hartman et al. 2010), M50 (130 Myr; Irwin et al. 2009), M35 (133 Myr; Meibom et al. 2009), and M37 (550 Myr; Hartman et al. 2009). Right: the simulated angular velocity curves in linear scale are compared with rotation measurements of 0.9–1.1 M⊙ stars (black crosses) in M37, NGC 6811 (1.05 Gyrs; Meibom et al. 2011), NGC 6819 (2.38 Gyrs; Meibom et al. 2015), and M67 (4.0 Gyrs; Barnes et al. 2016). |
The rotation evolution model is based on observational indications by Wood et al. 2005 2014 that the mass-loss rate of Sun-like stars increases as a power law of their X-ray surface flux till a limit beyond which it remains constant to a value that is a free parameter in the model. Taking into account that the X-ray surface flux of cool stars is a function of their Rossby number (Pizzolato et al. 2003; Wright et al. 2011), the best fit parameters of the evolution model indicate a brief episode of large-angular-momentum loss among Sun-like stars with Rossby numbers in the range 0.13–0.3 (see Fig. 2 in Gondoin 2017). During stellar contraction on the main sequence, this episode of enhanced rotational braking would limit the spin-up of stars with rotation rates that are initially moderate. For main-sequence stars that are initially fast rotators, a strong deceleration of stellar rotation is induced much later, which explains the bimodal distribution of stellar rotation observed in young clusters with ages between 20–30 and approximately 600 Myr (Barnes 2003; Meibom et al. 2011).
The rotation evolution model produces a sharper bimodality than observed in the measured rotation periods histograms of open clusters aged between 30 and 600 Myr (see Fig. 1). One reason is that the spread in mass of the sample stars is not taken into account in the simulation (see Gondoin 2017). Also, different clusters have evolved from initial rotation period distributions that were not fully identical to the one assumed in the model. In addition, the angular redistribution model and in particular the parameterisation of the torque as a function of only three parameters (Weber & Davis 1967), that is, the mass loss rate, Alfven radius and angular velocity of the rotating star, is a simplification (e.g. Belcher & MacGregor 1976) specially for fast rotators in the early phase of stellar evolution. Describing the braking torque induced by the MHD plasma outflow from a rotating star with an evolving magnetic field geometry is intrinsically a three-dimensional problem. As a consequence, the simulated distribution of activity indicators in open clusters are also sharper than observed (see Figs. 5 and 6).
Open clusters with age determinations and measured rotation period distributions used for deriving the best fit parameters of the parametric model of rotation evolution.
Best-fit parameters used in the rotation evolution model of a 1.0 M⊙ star.
3. Simulated evolution of activity indices
3.1. Magnetic activity on the early main sequence
The emission reversals in the cores of the Ca II H & KFraunhofer lines are a well-known sign of departures from radiative equilibrium that require additional mechanisms of heating, generally termed activity (Hall 2008 and reference therein). A major contributor to chromospheric and coronal activity is the evolution and variability of magnetic fields via heating by Alfven waves or transport of mechanical energy along magnetic flux tubes into the outer atmosphere of cool stars.
Chromospheric activity has been traditionally characterised by the R′HK index, defined as the ratio of the emission in the core of the Ca II H & K lines to the total bolometric emission of the star (Noyes et al. 1984). This index can be expressed as follows (e.g. Martinez-Arnaiz et al. 2010):
 (1)
(1)
where F′H and F′K are the emission fluxes in the cores of the Ca II H & K lines and σ is the Stefan–Boltzmann constant.
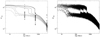 |
Fig. 3. simulated evolutions of the average Ca II R′HK indices of 1.0 M⊙main-sequence stars. The different curves correspond to initial rotation periods of 1, 2, 3, 6, 10 and 20 days at an age of 5 Myr. The curve symbols are identical to those used in the corresponding angular velocity curves of Fig. 2. The simulations of the chromospheric activity evolution are compared with measurements of the R′HK index (see Mamajek & Hillenbrand 2008 and reference therein) on 0.9–1.1 M⊙ stars in the Pleiades (125 Myr), the Hyades (625 Myr) and M67 (4200 Myr). Right: simulated evolutions of the Ca II R′HK indices including their estimated dispersion around average values derived from stellar rotation due to the short-term variability of the magnetic activity. |
Mamajek & Hillenbrand (2008) derived a unique relationship between the chromospheric activity index R′HK of main-sequence stars and their Rossby number Ro
 (2)
(2)
This formula uses the convective turnover time relation as a function of B–V colour of Noyes et al. (1984) based on the finding (Montesinos et al. 2001) that it produces the tightest correlation between activity and Rossby number when compared to stellar models using mixing-length theory and full turbulence spectrum treatment of convection.
Using the best fit model of rotation evolution described in Table 2 and Fig. 2, I calculated the time evolution of the Rossby numbers of 1.0 M⊙ main-sequence stars assuming different initial periods of rotation after circumstellar disk dispersion and a constant convective turnover time of 14.45 days. This empirical estimate by Wright et al. (2011; see their Fig. 7) is in good agreement with that of Noyes et al. (1984). The evolution of the R′HK index was then calculated using Eq. (2).
The results are shown in the left graph of Fig. 3 for initial rotation periods ranging from 1 to 20 days at an age of 5 Myr. The simulated curves are compared with R′HK measurements on 0.9–1.1 M⊙ stars in the Pleiades (~130 Myr), the Hyades (~625 Myr), and M67(~4000 Myr) compiled by Mamajek & Hillenbrand (2008; see reference therein). They reproduce the broad distribution of Ca II emission among young Sun-like stars in the Pleiades, the decay of the chromospheric emission in the intermediate age Hyades (~625 Myr), and the even lower chromospheric activity of solar mass stars in the old M67 cluster.
Coronal X-ray emission is another important magnetic activity diagnostic for cool stars. The relationship between the coronal radiative flux density and the average surface magnetic flux density has been shown to be nearly linear for solar active regions as well as for entire stars (e.g. Fisher et al. 1998; Schrijver & Zwaan 2000) over 12 orders of magnitude in absolute magnetic flux (Pevtsov et al. 2003).
The X-ray emission from late-type stars in open clusters exhibits two kinds of dependences on stellar rotation (e.g. Patten & Simon 1996; Randich 2000; Feigelson et al. 2003). Fast rotators with a Rossby number smaller than ~0.13 show a relatively constant X-ray to bolometric luminosity ratio at the so-called LX/Lbol) ≈ 10−3 saturation level. Slower rotators with a larger Rossby number show a decline of their X-ray emission with decreasing rotation rate.
This behaviour can be parameterised as follows:
 (3)
(3)
with log(LX,⊙/L⊙)=−6.24 (Judge et al. 2003). In this equation, LX is the stellar X-ray luminosity, Lbol the bolometric luminosity and Rocrit the Rossby number value below which the saturation of X-ray emission occurs. RX, sat = 0.74 × 10⁻³ is the saturation level of the X-ray to bolometric luminosity ratio measured in the ROSAT 0.1–2.4 keV energy band. Pizzolato et al. (2003) found a power index β = −2 while Wright et al. (2011) argued that a value β = −2.70 ± 0.13 provides a better fit to the Sun's X-ray luminosity.
By combining Eq. (3) with the best fit model of rotation evolution assuming a convective turnover time of 14.45 days, I calculated the X-ray luminosity evolution of 1.0 M⊙ main-sequence stars with initial rotation periods ranging from 1 to 20 days at an age of 5 Myr. The results are plotted in the left graph of Fig. 4. They are compared with X-ray luminosity measurements of 0.9–1.1 M⊙ stars in α Per (85 Myr), the Pleiades (125 Myr), Praesepe (600 Myr), and the Hyades (625 Myr) that have been compiled by Wright et al. (2011; see reference therein).
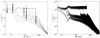 |
Fig. 4. Left: simulated evolutions of the average X-ray luminosity of 1.0 M⊙ main-sequence stars. The Different curves correspond to initial rotation periods of 1,2, 3, 6, 10, and 20 days at an age of 5 Myr. The curve symbols areidentical to those used in the corresponding angular velocity curves of Fig. 2. The simulations of the X-ray activity evolution are compared with X-ray luminosity measurements of 0.8–1.2 M⊙ stars in NGC2362 (5 Myr), h Per (13 Myr), α Per (85 Myr), the Pleiades (125 Myr), Praesepe (600 Myr), and the Hyades (625 Myr). Right: simulated evolutions of the X-ray luminosities including their estimated dispersion around average values derived from stellar rotation due to the short-term variability of the magnetic activity. |
Figure 4 (left graph) shows that the simulated evolution of X-ray luminosity on solar-mass stars is similar to that of their R′HK index. Between the ages of ~50 and ~600 Myr, both magnetic activity indicators show a large dispersion. Fast rotators on the early main-sequence exhibit a very similar and large magnetic activity level at R′HK ≈ 10−4 and LX/Lbol ≈ 10−3. In contrast, the slow rotators on the early main-sequence show moderate activity levels around log(R′HK) ≈ −4.4 and L5 ≈ 1029 erg s−1. Beyond an age of about600 Myr, the magnetic activity levels of both populations decay converging towards similar values by the age of the Sun.
3.2. Magnetic activity on the pre-main sequence
Since the rotation-activity relationships (see Eqs. (2) and (3)) have been established empirically considering only the colour or mass dependence of the convective turnover time but ignoring any stellar age dependent effect, they are a priori only applicable to main-sequence (MS) stars. However, pre-main sequence (PMS) stars are also magnetically active, producing strong magnetic fields and intense coronal emission (e.g. Preibisch & Feigelson 2005; Gondoin 2006; Donati et al. 2012; Vidotto et al. 2014).
In the past decade, photometric and X-ray surveys of young open clusters have produced rotation period and X-ray luminosity measurements on pre-main sequence stars of different ages. Some studies have investigated the properties of coronal activity among PMS stars within cluster younger than ~3 Myr. A large fraction of these very young stars is accreting material from circumstellar disks producing poor correlations between their X-ray and bolometric luminosities or stellar masses and a large scatter (e.g., Stassun et al. 2004; Briggs et al. 2007). Nevertheless, the X-ray luminosity of non-accreting T Tauri stars has been found to show well-defined correlation with their bolometric luminosity similarly to rapidly rotating MS stars (Preibisch & Feigelson 2005).
A few studies have also investigated the relationship between X-ray activity and rotation among PMS stars older than ~3 Myr that have cleared most of their circumstellar disks but have not yet reached the ZAMS. In a search for correlations between X-ray emission and rotation among PMS stars in the h Per open cluster that is 13 Myr old, Argiroffi et al. (2016) conclude that solar-like members of this cluster show different activity regimes, analogous to those observed among MS stars.
Jeffries et al. (2006) also finds that a small sample of 38 Myr old stars in NGC 2547 follows the X-ray to bolometric luminosity versus Rossby number relationship observed by Pizzolato et al. (2003) among a range of solar-type stars from the field, the Pleiades and other open clusters. Their study estimates the rotation periods of the sample stars from their projected rotation velocities. Irwin et al. (2008) reproduce the X-ray to bolometric luminosity versus Rossby number correlation found by Jeffries et al. (2006) using rotation period measurements derived from a photometric survey of NGC 2547.
These results suggest that PMS and MS stars follow the same rotation-activity relationships. I thus calculated the evolution of the chromospheric activity index and X-ray to bolometric luminosity ratio on the pre-main sequence by combining the best fit models of rotation evolution (see Table 2 and Fig. 2) with the rotation-activity relationships given by Eqs. (2) and (3).
The convective turnover time that had been assumed to be constant for MS stars was replaced by an age dependent function emulating the convective turnover time evolution of a solar mass star calculated by Landin et al. (2010). This convective turnover time is age dependent on the pre-main sequence. It converges towards an almost constant value on the main sequence close to the 14.45 days derived empirically by Wright et al. (2011) for a solar mass star.
The decay of the convective turnover time during PMS evolution has a significant effect on the Rossby number. Since both the rotation period and the convective turnover time decrease as PMS stars contract towards the main sequence, the Rossby number of a solar mass star remains small till an age of ~30 Myr. During The contraction phase, only the small fraction of stars with initially long periods of rotation (P0 ≳ 20 dat 5 Myr) have Rossby numbers greater than the critical value Ro ≈ 0.13 above which activity is correlated with rotation. Applying the rotation-activity relationships to PMS stars thus results in most of these stars operating in a rotation-independent regime of magnetic activity.
This behaviour is illustrated in the left-hand graphs of Figs. 3 and 4. Most stars younger than about 30 Myr operate at high levels of chromospheric and coronal activity with R′HK ≈ 10−4 and LX/Lbol ≈ 10−3, respectively. These simulation results are consistent with measured X-ray luminosities of 0.9–1.1 M⊙ stars in NGC 2362 (Damiani et al. 2006)and h Per (Argiroffi et al. 2016) that are 5 and 13 Myr old, respectively.
3.3 Short-term variability of magnetic activity
The left-hand plots of Figs. 3 and 4 describe the effect of stellar rotation on the long-term evolution of chromospheric and coronal emission on solar mass stars. While stellar rotation evolves slowly with time, magnetic activity varies on much shorter timescales. The physical mechanisms producing such variability include changes in the filling factor of active regions, growth and decay of individual emitting regions, and activity cycles.
The detection of activity cycles in lower main-sequence stars is one of the main results of a monitoring programme of their Ca II emission carried out at the Mount Wilson and Las Campanas observatories (Wilson 1978; Baliunas & Vaughan 1985). By exploring the variation in the photometric bands centred in the Ca II H and K lines on timescales of years, it has been found (Baliunas et al. 1995) that young Sun-like stars tend to vary irregularly, rather than in a smooth cycle like that of the Sun. In contrast, older more slowly rotating stars have weaker average activity levels, often with regular, cyclic variation superimposed. The timescales of these cycles range from a few years to more than a decade.
Using chromospheric time series of stars with spectral type F5 to K7 observed between 1984 and 1995, Radick et al. (1998) explored the relation between chromospheric variability and average activity level. These authors found that chromospheric variations can be fairly well related by power laws to average chromospheric activity levels for their entire sample of stars that spanned a range of chromospheric activity indices between −5.05 and −4.15. An estimate of the cyclic chromospheric RMS variation (see Fig. 5 in Radick et al. 1998) is given by:
 (4)
(4)
I used Eq. (4) to estimate the dispersion of the R′HK indices due to the short-term variability of magnetic activity around the average ⟨ R′HK⟩ values derived from the long-term evolution of stellar rotation. The Results are shown in the right plot of Fig. 3 for solar mass stars with initial rotation periods of 1, 2, 3, 6, 10, and 20 days at an age of 5 Myr.
The Einstein IPC and ROSAT PSPC, taken roughly a decade apart, have provided valuable information on the variability of X-ray stellar activity in the Pleiades and the Hyades. Temporal analyses of Pleiades X-ray data, using single ROSAT observations, have been made by Schmitt et al. (1993), Stauffer et al. (1994), Micela et al. (1996). Micela et al. (1996) found that most of the Pleiades stars show variability within a factor two-three, both on six months and, using Einstein observations, on ten years timescales. A few stars with evidence of larger variations show large flares on shorter time scales. Gagne et al. (1995) found that on one year timescales, approximately 25% of the late-type Pleiades stars are variable by more than a factor of two, while they found only a marginal evidence for increased variability on the ten-year time scale. Regarding the Hyades, Stern et al. (1995) found that more than 90% of the stars common to the Einstein IPC and ROSAT PSPC surveys show variability of less than a factor of two.
Based on these observations, I estimated that stellar X-ray luminosities vary on short timescale by a factor of three in the Pleiades at a 99% confidence level and by a factor of two in the Hyades at a 95% confidence level. Assuming a normal distribution of the instantaneous X-ray luminosity around the average X-ray activity level ⟨LX⟩ at a given age, the standard deviation of the coronal X-ray luminosity at these ages would thus be:
 (5)
(5)
Figure 4 (right plot) show the simulated evolution of the X-ray luminosity of 1.0 M⊙ main-sequence stars with initial rotation periods of 1, 2, 3, 6, 10 and 20 days at an age of 5 Myr. The dispersion of the points around the average curves illustrates the effect of the short-term variability of the magnetic activity (described by Eq. (5)) on its long-term evolution derived from stellar rotation.
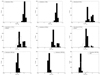 |
Fig. 5. Simulated R′HKindex distributions of solar mass stars in open clusters with ages of 5, 13, 85, 112, 240, 625, 1000, 2400, and 4000 Myr. The results are compared with measured R′HK histograms of0.9–1.1 M⊙ stars in the Pleiades, the Hyades, and M67 scaled to the 979 stars used in the simulation. The short-term variability of the magnetic activity is described by a normal distribution of the short-term CaII chromospheric emission with a variance of 0.327 × ⟨ R′HK ⟩1.15 around the average chromospheric emission ⟨ R′HK⟩ derived from a parametric model of rotation evolution for solar mass stars. |
The right-hand plots in Figs. 3 and 4 suggest that, before ~20 Myr and beyond ~600 Myr, the difference of activity levels resulting from the spread in stellar rotation rates is blurred due to the short-term variability. Between those ages on the contrary, two populations of very active and moderately active stars should remain distinguishable despite the short-term variability of their magnetic activity. The large spread of magnetic activity among solar-mass stars in open clusters with those ages is larger than the short-term variability of individual stars. It is essentially due to the bimodality of their rotation period distribution.
4. Comparison with activity indices measurements
Section 2 estimated the distribution of rotation periods among Sun-like stars in open clusters older than ~5 Myr by applying a best fit model of rotation evolution to an initial distribution of stellar rotation periods after circumstellar disk dispersion. At 5 Myr, this initial distribution can be approximated by a normal distribution truncated below 0.3 days with a maximum around seven days (Gondoin 2017). The distribution of activity indices among Sun-like stars in any open cluster older than 5 Myr can thus be inferred by applying the rotation-activity relationships to these calculated distributions of rotation periods.
I applied this method to calculate the R′HK indices and X-ray to bolometric luminosity ratios of solar mass stars in open clusters with ages of 5, 13, 85, 112, 240, 625, 1000, 2400, and 4000 Myr. To simulate the short-term variability of the magnetic activity, the results were convoluted with normal distribution of activity indices using the standard deviations provided by Eqs. (5) and (6). The obtained histograms of R′HK and LX/Lbol indices are plotted in Figs. 5 and 6, respectively.
Figure 5 shows that solar mass stars on the pre-main sequence are distributed around a maximum of chromospheric activity at log (R′HK) ≈ −4.0. During the early main-sequence evolution, this single-peak distribution evolves into a bimodal distribution around log (R′HK) ≈ −4.4 and log (R′HK) ≈ −4.0. By the age of the Hyades, the high activity peak of the bimodal distribution has almost entirely disappeared. The remaining peak then drifts from moderate activity levels around log (R′HK) ≈ −4.5 at an age of 1 Gyr to low activity levels around log (R′HK) ≈ −4.9 at 4 Gyr.
Figure 5 compares the simulated distributions with measured histograms of chromospheric activity indices among 0.9–1.1 M⊙ stars in the Pleiades (Duncan et al. 1991; Soderblom et al. 1993; White et al. 2007), the Hyades (Duncan et al. 1991; Paulson et al. 2002; White et al. 2007), and M67 (Giampapa et al. 2006) compiled by Mamajek & Hillenbrand (2008). The total number of stars in the measured histograms of the Pleiades (22 stars), the Hyades (49 stars), and M67 (69 stars) are scaled to the number of Monte-Carlo simulations (979). Despite the limited number of measurements, Fig. 5 suggests that solar mass stars in the Pleiades that are 112 Myr old indeed group into two distinct activity levels around log (R′HK) ≈ −4.5 to −4.2 and log (R′HK) ≈ −4.1 to −3.8 (see plot in the left-hand column middle row of Fig. 5). In contrast, the distribution of measured activity indices in the Hyades that are 625 Myr old shows a single peak around log(R′HK) ≈ −4.5. The measured R′HK histogram of M67 that is ~4 Gyr also shows a single peak but at a lower chromospheric activity level −5.1 < log(R′HK) < −4.6 (see plot in the right-hand column lower row of Fig. 5). The measurements thus look consistent with the simulated distributions. However, the number of 0.9–1.1 M⊙ stars in the measured R′HK histograms, especially in that of the Pleiades, are too small to draw a definitive conclusion.
Figure 6 shows that the calculated distributions of X-ray to bolometric luminosity ratios among solar mass stars in open clusters are similar to their calculated R′HK index distributions shown in Fig. 5. Indeed, the simulations indicate that PMS stars emit X-rays at the saturation level around LX/Lbol ≈ 10−3. On the early main-sequence, this single peak distribution evolve into a bimodal distribution around log(LX/Lbol) ≈ −3.0and log(LX/Lbol) ≈ −4.1. By the age of Praesaepe and the Hyades, the high activity peak of the bimodal distribution has almost entirely disappeared. The remaining single-peak distribution then drift from moderate activity levels around log(LX/Lbol) ≈ −5.0 at an age of 1 Gyr to low activity levels around log(LX/Lbol) ≈ −6.1 at 4 Gyr.
Figure 6 also compares the simulated histograms with measured LX/Lbol histograms of 0.9–1.1 M⊙ stars in NGC 2362, h Per, α Per, the Pleiades, the Hyades and Praesaepe. The open cluster NGC 2362 is5 Myr old (Moitinho et al. 2001). Its small and uniform reddening offers a unique opportunity of studying a population of pre-main-sequence star just after dispersion of their circumstellar disks. According to Dahm & Hillenbrand (2007), the upper limit for the fraction of stars hosting primordial, optically thick disks in NGC 2362 peaks near 10.7 ± 4% for stars with masses between 0.6 and 1.05 M⊙. From Hα emission-line strengths, these authors estimated an upper limit for the accretion fraction at 5%, with most suspected accretors associated with primordial, optically thick disks identified with Spitzer.
Damiani et al. (2006) study the stellar population of this very young cluster using a deep X-ray observation with the ACIS-I camera on board the Chandra satellite. They detect 387 X-ray sources down to an X-ray luminosity of 1029 erg s−1 in the 0.2–4 keV energy band, and identified most of them with star-like objects. I assumed similar X-ray luminosities in the ROSAT energy band since, for APEC models with plasma temperatures kT between 0.5 and 2 keV, the conversion factor from the 0.2–4 keV to the 0.1–2.4 keV energy band vary between 1.1 and 0.9. The majority (88%) of the optically identified X-ray sources were found to be low-mass pre-main-sequence stars, with minimal field-object contamination. I correlated these X-ray sources with the list of 271 cluster members derived by Irwin et al. (2008) from a photometric survey of NGC 2362. The cross-correlation provided 21 stars with masses between 0.9 and 1.1 M⊙. From the masses provided by Irwin et al. (2008), I estimated their bolometric luminosities using the 5 Myr isochrone of the Landin et al. (2010) evolutionary models and derive their X-ray to bolometric luminosity ratios used in the NGC 2362 histogram of Fig. 6 (upper left graph).
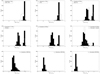 |
Fig. 6. Simulated LX/Lbol ratio distributions of solar mass stars in open clusters with ages of 5,13, 85, 112, 240, 625, 1000, 2400, and 4000 Myr. The results are compared with measured LX/Lbol histograms of 0.9–1.1 M⊙ stars in NGC 2362, h Per, α Per, the Pleiades, Praesaepe and the Hyades scaled to the 979 stars used in the simulation. The short-term variability of the magnetic activity is described by a normal distribution of the short-term X-ray emission with a variance of ⟨ LX⟩/6 around the average X-ray luminosity ⟨ LX⟩ derived from aparametric model of rotation evolution for solar mass stars. |
The open cluster h Per (NGC 869) is the westernmost member of the Perseus double cluster whose age has been estimated to be 13 Myr (Mayne & Naylor 2008). By This age, the disk accretion process has ceased on all stars that freely evolve towards the ZAMS. Argiroffi et al. (2016) derive the X-ray fluxes in the 0.5–8.0 keV energy range of the objects detected in a deep Chandra observation of h Per. They correlate the X-ray sources with the catalogue of Moraux et al. (2013), which contains 586 h Per members, 541 of which fall within the Chandra field of view. They collect a final catalogue that contains 169 h Per members detected in X-ray with measured masses estimated by Moraux et al. (2013). They derive the X-ray luminosities from the distance of the cluster assuming an optically thin X-ray emitting plasma at a temperature of 10 MK with an heavy element abundance of 0.2 in solar units. Argiroffi et al. (2016) derive the effective temperatures of these stars from spectroscopic (Currie et al. 2010) or photometric observations according to Kenyon & Hartmann (1995). They calculate the bolometric luminosities from the absolute V magnitude using the Kenyon & Hartmann (1995) bolometric corrections corresponding to the evaluated effective temperatures. I selected the 33 stars that have masses between 0.9 and 1.1 solar masses in the Argiroffi et al. (2016)catalogue of h Per members with measured X-luminosities. Their X-ray luminosities were converted to the ROSAT 0.1–2.4 keV energy band using a conversion factor of 1.5 for a 10 MK optically thin emitting plasma with an heavy element abundance of 0.2 in solar units. From these data, I derived the X-ray to bolometric luminosity ratios used in the h Per histogram of Fig. 6 (upper row, middle column).
Figure 6 also compares the simulated distributions of X-ray to bolometric luminosity ratios withLX/Lbol histograms of 0.9–1.1 M⊙ MS stars in the Pleiades, α Per, and the Hyades stars. These data converted to the ROSAT 0.1–2.4 keV energy band were derived by Wright et al. (2011) from Einstein and ROSAT observations reported by Micela et al. (1990, 1996); Stauffer et al. (1994), Stern et al. (1994, 1995) and from XMM - Newton observations by Briggs & Pye 2003 discarding all upper limits. A few stars from the Praesepe cluster were added to the Hyades Distribution using X-ray luminosities from Randich & Schmitt (1995) and Franciosini et al. (2003). The total number of stars in the measuredLX/Lbol histograms of NGC 2362 (21 stars), h Per (33 stars), α Per (19 stars), the Pleiades (34 stars), and the Praesaepe/Hyades (18 stars) are scaled to the number of Monte-Carlo simulations (979).
Figure 6 shows that PMS stars in NGC2362 and h Per have X-ray to bolometric luminosity ratios close to the so-called saturation level of X-ray emission at LX/Lbol ≈ 10−3 (see plot in the left and middle columns, upper row of Fig. 6). Two peaks are observed in the measured distribution of X-ray luminosities in α Per and the Pleiades (see plots in the right-hand column upper row, and left-hand column middle row of Fig. 6). The measured distribution of X-ray to bolometric luminosity ratio in Praesaepe and the Hyades shows a strong peak at LX/Lbol ≈ 1−2.5 &× 10−5 with very few stars having higher X-ray luminosities (see plot in the right-hand column middle row of Fig. 6). These measurements are consistent with the simulated distributions of X-ray to bolometric luminosity ratio in those open clusters. They provide additional evidences of the onset and disappearance of a bimodal distribution of activity levels in intermediate-age open clusters. However, the number of measurements, specially in theLX/Lbol histograms of α Per and the Pleiades, are too small to draw a definitive conclusion.
5. Summary
In this study, a scenario of magnetic activity evolution on Sun-like stars is inferred by combining a parametric model of their rotation evolution with empirical rotation-activity relationships. The best fit parameters of the rotation model are obtained by comparing measured and simulated distributions of rotation periods in open clusters of various ages assuming that they result from the evolution of a same initial distribution. The study uses rotation periods measurements of 0.9–1.1 M⊙ stars in NGC2362 (~5 Myr), the Pleiades (~112 Myr), M50(~130 Myr), M35 (~133 Myr), M37 (~550 Myr), NGC6811 (~1.0 Gyr), NGC6819 (~2.4 Gyr), and M67 (~4.0 Gyr). It assumes that PMS and MS stars follow the same relationships between Rossby number and chromospheric or coronal emission. An age-dependent estimate of the local convective turnover time is used in the calculation of the Rossby number.
The inferred scenario of magnetic activity evolution (see Figs. 3 and 4) reproduces the high levels of chromospheric and coronal emission (R′HK ≈ 10−4 and LX ≈ 1030 erg s−1, respectively) observed on solar mass stars during their early pre-main sequence evolution. It indicates that, at the end of the PMS contraction phase around the age of ~30 Myr, the slowest rotating stars experience a rapid transition to moderate activity levels around R′HK ≈ 4 &× 10−5 and L5 ≈ 1029 erg s−1. This brief episode of rapid decay of the magnetic activity occurs later on more rapidly rotating stars, up to an age of ~600 Myr for the fastest rotators. After this sharp transition, the average chromospheric and coronal activity indices of all stars decrease steadily converging towards similar values (R′HK ≈ 10−5 and LX ≈ 1027 erg s−1) by the age of the Sun.
This scenario describes the average chromospheric and coronal emission levels that result from the long-term rotation evolution of Sun-like stars. While stellar rotation evolve slowly with time, magnetic activity varies on much shorter timescales due to changes in the filling factor of active regions, growth and decay of individual emitting regions, and activity cycles. The study simulates this short-term variability with normal dispersions of the activity indices around average values derived from the rotation evolution. The RMS dispersions of the activity indices are deduced from long-term observations of the chromospheric and coronal emissions of Sun-like stars in the field, in the Pleiades, and in the Hyades. They suggest that, before an age of ~20 Myr and beyond an age ~600 Myr, the range of activity levels that results from the spread of rotation rates is blurred due to the intrinsic short-term variability of the magnetic activity. In contrast, between the ages of 20 and 600 Myr, two populations of very active and moderately active stars should be clearly distinguishable. The large spread of magnetic activity among solar-mass stars with those ages is predicted to be larger than the short-term variability of their magnetic activity. According to this study, it is essentially due to the bimodality of their rotation period distribution.
The angular momentum loss parameterisation used in the rotational evolution model is based on observational indications by Wood et al. (2005, 2014) that the mass-loss rate of Sun-like stars increases as a power law of their X-ray surface flux till a limit beyond which it remains constant to a value that is a free parameter in the model. The bimodality of stellar activity in the 20–600 Myr age range would result from the occurrence of a brief episode of large angular-momentum loss among Sun-like stars as they evolve through the 0.13–0.3 Rossby number domain as suggested by observations (Gondoin 2012) and reproduced in the best-fit rotation evolution model (Gondoin 2017). This event would occur at the end of the pre-main sequence contraction phase for initially slow rotators and later for initially fast rotators.
Very few studies have suggested alternative scenarios of angular momentum evolution that could explain the bimodal distribution of stellar rotation among Sun-like stars in intermediate-age open clusters. The interaction, between a contracting, pre-main sequence star and a surrounding magnetised accretion disk has been proposed to account for the dichotomy between slowly rotating Classical T Tauri Stars that show evidence for circumstellar disks and the more rapidly rotating Weak-line T Tauri Stars that do not (Bouvier et al. 1993). Using the double-zone model described by MacGregor & Brenner (1991); Keppens et al. (1995) evolve observed distributions of rotation among TTS into distributions of stellar rotation at later ages. Assuming that one fourth of the stars in the initial Maxwellian distribution for rotation periods has a disk for 3 Myr after central core formation, the model generates a bimodal distribution of stellar rotation till the age of the Pleiades (see Fig. 8 in Keppens et al. 1995). However, the authors noted that the large proportion of slow rotators at the ages of α Per, and the Pleiades is not reproduced unless assuming unrealistically that half of the stars have a disk for 10 Myr.
More recently, a sudden change in the coupling between the wind and the large-scale magnetic fields of the stars was proposed in the metastable dynamo model described by Brown (2014). This scenario could also explain the bimodal distribution of stellar rotation in young open cluster but does not seem to be consistent with spectro-polarimetric observations of solar-type stars (Donati & Landstreet 2009). No strong difference was found in a sample of young Sun-like stars (Folsom et al. 2016)between the magnetic geometry of fast rotators (P < 2 days) and that of moderate rotators, which would essentially correspond to the transition between the fast and slow rotation sequence of Barnes (2003). Observations rather indicate a continuous evolution from strong, toroidal, and non-axisymmetric magnetic fields on stars with small Rossby number to a more poloidal and axisymmetric configuration of large-scale magnetic fields on moderate rotators.
In an attempt to test the plausibility of the inferred scenario of magnetic activity evolution, I compared simulated and measured distributions of activity indices among Sun-like stars in open clusters of various ages (see Figs. 5 and 6). The simulations indicate that the chromospheric and coronal activity indices of PMS solar mass stars in very young open clusters are distributed around maxima at log(R′HK) ≈ −4.0 and LX/Lbol ≈ 10−3, respectively. In clusters older than about 30 Myr, this single peak distribution evolve into a bimodal distribution around log(R′HK) ≈ −4.6 and log(R′HK) ≈ −4.0 for the chromospheric activity index and around LX/Lbol ≈ (4–10) × 10−5 and LX/Lbol ≈(4–10) × 10−4 for the coronal emission. By the age of the Hyades, the high activity peak of the bimodal distribution has almost entirely disappeared. The remaining peak of the distribution then drifts from moderate activity levels around log(R′HK) ≈ −4.5 and LX/Lbol ≈ 1−2.5 × 10⁻⁵ at an age of 1 Gyr to low activity levels around log(R′HK) ≈ −4.9 and LX/Lbol ≈ 4−6 × 10⁻⁷ at 4 Gyr. Figures 5 and 6 show that the simulated distributions are similar to measured histograms of activity indices in NGC .2362 (~5 Myr), h Per (~13 Myr), α Per (~85 Myr), the Pleiades (~112 Myr), the Hyades (~625 Myr), and M67 (~4 Gyr) (see Figs. 5 and 6). The currently available observations of activity indices in open clusters are thus consistent with the inferred scenario of magnetic activity evolution. However, the limited number of activity indices measurements on solar mass stars, specially in α Per and the Pleiades, prevents to draw a definitive conclusion.
Further surveys of the chromospheric and coronal emission from Sun-like stars in open clusters are needed, in particular, to confirm that solar mass stars in open clusters with ages between ~30 and ~600 Myr exhibit bimodal distributions of their R′HK chromospheric activity indices and coronal X-ray to bolometric luminosity ratios. A confirmation would corroborate the inferred scenario of magnetic activity evolution and the hypotheses from which it derives. These include the assumptions that (i) similar rotation-activity relationships hold for MS and PMS stars, (ii) a brief episode of large angular momentum loss occurs in the early evolution of Sun-like stars and (iii) the distributions of rotation rates among Sun-like stars in open clusters depend mainly on their age, that is, they derive from similar initial distributions of rotation periods after dispersion of their circumstellar disks.
In the absence of rotation period measurements of solar mass stars in open clusters older than 4 Gyr, the study does not address the evolution of rotation and magnetic activity beyond the age of the Sun. However, observations of field stars (e.g. Pace 2013) show that the emission fluxes F′H and F′K in the cores of the Ca II H & K lines reach a lower limit, the so-called basal chromospheric flux (Schrijver 1987). This empirical limit depends sensitively on effective temperature (Rutten et al. 1991). An empirical formula (Perez Martinez et al. 2014) for the basal Ca II flux as a function of effective temperature gives  for a solar mass stars. According To the present study, solar mass stars reach this chromospheric activity level at ages between 4.5 and 5.5 Gyr, that is, around the age of the Sun. Mamajek & Hillenbrand (2008) reported a 95% range for the solar log (R′HK) index of −4.955 to −4.832 from 1977 to 2008 as estimated from the data of Livingston et al. (2007). the Sun with barely any active region thus compares to the basal chromospheric activity level.
The basal chromospheric flux appears not to be of photospheric nature but rather reflects a residual chromospheric heating. It could result from the dissipation of non-magnetic, but rather mechanical wave energy like acoustic waves (e.g. Perez Martinez et al. 2011 and references therein). This flux could also come from the action of a minimal magnetic activity. Interestingly, recent asteroseismic data from the Kepler spacecraft have revealed a population of field stars more evolved than the Sun rotating more quickly than expected from gyrochronology (van Saders et al. 2016). This indicates that magnetic braking may cease at around solar Rossby number. Magnetic dynamo(s) in Sun-like stars may thus enter another transitional evolutionary phase around the age of the Sun (Metcalfe et al. 2016). A confirmation of this unexpected behaviour also require additional measurements of rotation and magnetic activity indices in the galactic field population and in open clusters older than the Sun (Hawley et al. 2016).
Acknowledgments
I am grateful to the anonymous referee for the helpful comments that allowed me to improve the paper.
References
- Affer, L., Micela, G., Favata, F., et al. 2013, MNRAS, 430, 1433 [NASA ADS] [CrossRef] [Google Scholar]
- Allain, S. 1998, A&A, 333, 629 [NASA ADS] [Google Scholar]
- Argiroffi, C., Caramazza, M., Micela, G., et al. 2016, A&A, 589, A113 [NASA ADS] [CrossRef] [EDP Sciences] [Google Scholar]
- Baliunas, S. L., & Vaughan, A. H. 1985, ARA&A, 23, 379 [NASA ADS] [CrossRef] [Google Scholar]
- Baliunas, S. L., Donahue, R. A., Soon, W. H., et al. 1995, ApJ, 438, 269 [NASA ADS] [CrossRef] [Google Scholar]
- Barnes, S. A. 2003, ApJ, 586, 464 [NASA ADS] [CrossRef] [Google Scholar]
- Barnes, S. A., Weingrill, J., Fritzweski, D., et al. 2016, ApJ, 823, 16 [NASA ADS] [CrossRef] [Google Scholar]
- Bedin, L. R., Salaris, M., Anderson, J., et al. 2015, MNRAS, 448, 1779 [NASA ADS] [CrossRef] [Google Scholar]
- Belcher, J. W., & MacGregor, K. B. 1976, ApJ, 210, 498 [NASA ADS] [CrossRef] [Google Scholar]
- Booth, R. S., Poppenhaeger, K., Watson, C. A., et al. 2017, MNRAS, 471, 1012 [NASA ADS] [CrossRef] [Google Scholar]
- Bouvier, J., Cabrit, S., Fernandez, M., et al. 1993, A&A, 272, 176 [NASA ADS] [Google Scholar]
- Brewer, L. N., Sandquist, E. L., Mathieu, R. D., et al. 2016, ApJ, 151, 66 [NASA ADS] [CrossRef] [Google Scholar]
- Briggs, K. R., & Pye, J. P. 2003, MNRAS, 345, 714 [NASA ADS] [CrossRef] [Google Scholar]
- Briggs, K. R., Güdel, M., Telleschi A., et al. 2007, A&A, 468, 413 [NASA ADS] [CrossRef] [EDP Sciences] [Google Scholar]
- Brown, T. M. 2014, ApJ, 796, 91 [NASA ADS] [CrossRef] [Google Scholar]
- Currie, T., Hernandez, J., Irwin, J., et al. 2010, ApJS, 186, 191 [NASA ADS] [CrossRef] [MathSciNet] [Google Scholar]
- Dahm, S. E. 2015, ApJ, 813, 108 [NASA ADS] [CrossRef] [Google Scholar]
- Dahm, S. E., & Hillenbrand, L. A. 2007, AJ, 133, 2072 [NASA ADS] [CrossRef] [Google Scholar]
- Damiani, F., Micela, G., Sciortino, S., et al. 2006, A&A, 460, 133 [NASA ADS] [CrossRef] [EDP Sciences] [Google Scholar]
- Delorme, P., Collier Cameron, A., Hebb, L., et al. 2011, MNRAS, 413, 2218 [NASA ADS] [CrossRef] [Google Scholar]
- Denissenkov, P. A., Pinsonneault, M., Terndrup, D. M., & Newsham, G. 2010, ApJ, 716, 1269 [NASA ADS] [CrossRef] [Google Scholar]
- Donati, J.-F., & Landstreet, J. D. 2009, ARA&A, 47, 333 [NASA ADS] [CrossRef] [MathSciNet] [Google Scholar]
- Donati, J.-F., Gregory, S. G., Alencar, S. H. P., et al. 2012, MNRAS, 425, 2498 [NASA ADS] [CrossRef] [Google Scholar]
- Dotter, A., Chaboyer, B., Jevremovic, D., et al. 2008, ApJS, 178, 89 [NASA ADS] [CrossRef] [Google Scholar]
- Duncan, D. K., Vaughan, A. H., Wilson, O. C., et al. 1991, ApJS, 76, 383 [NASA ADS] [CrossRef] [Google Scholar]
- Durney, B. R., & Latour, J. 1978, Geophys. Astrophys. Fluid Dyn., 9, 241 [NASA ADS] [CrossRef] [Google Scholar]
- Feigelson, E. D., Gaffney, J. A., Garmire, G., Hillenbrand, L. A., & Townsley, L. 2003, ApJ, 584, 911 [NASA ADS] [CrossRef] [Google Scholar]
- Fisher, G., Longcope, D., Metcalf, T., et al. 1998, ApJ, 508, 885 [NASA ADS] [CrossRef] [Google Scholar]
- Folsom, C. P., Petit, P., Bouvier, J., et al. 2016, MNRAS, 457, 580 [NASA ADS] [CrossRef] [Google Scholar]
- Forget, F., & Leconte, J. 2014, Phil. Trans. R. Soc. A, 372, 84 [NASA ADS] [CrossRef] [Google Scholar]
- Franciosini, E., Randich, S., & Pallavicini, R. 2003, A&A, 405, 551 [NASA ADS] [CrossRef] [EDP Sciences] [Google Scholar]
- Gagne, M., Caillault, J.-P., & Stauffer, J. R. 1995, 450, 217 [Google Scholar]
- Gallet, F., & Bouvier, J. 2013, A&A, 556, A36 [NASA ADS] [CrossRef] [EDP Sciences] [Google Scholar]
- Giampapa, M. S., Hall, J. C., Radick, R. R., & Baliunas, S. L. 1976, ApJ, 651, 444 [NASA ADS] [CrossRef] [Google Scholar]
- Girardi, L., Bertelli, G., Bressan, A., et al. 2002, A&A, 391, 195 [NASA ADS] [CrossRef] [EDP Sciences] [Google Scholar]
- Gondoin, P. 2006, A&A, 454, 595 [NASA ADS] [CrossRef] [EDP Sciences] [Google Scholar]
- Gondoin, P. 2012, A&A, 546, A117 [NASA ADS] [CrossRef] [EDP Sciences] [Google Scholar]
- Gondoin, P. 2013, A&A, 556, A14 [NASA ADS] [CrossRef] [EDP Sciences] [Google Scholar]
- Gondoin, P. 2017, A&A, 599, A122 [NASA ADS] [CrossRef] [EDP Sciences] [Google Scholar]
- Gondoin, P., Gandolfi, D., Fridlund, M., et al. 2012, A&A, 548, A15 [NASA ADS] [CrossRef] [EDP Sciences] [Google Scholar]
- Güdel, M. 2007, Liv. Rev. Sol. Phys., 4, 3 [Google Scholar]
- Güdel, M., Guinan, E. F., & Skinner, S. L. 1997, ApJ, 483, 947 [NASA ADS] [CrossRef] [Google Scholar]
- Hall, J. C. 2008, Liv. Rev. Sol. Phys., 5, 2 [Google Scholar]
- Hartman, J. D., Gaudi, B. S., Holman, M. J., et al. 2008, ApJ, 675, 1233 [NASA ADS] [CrossRef] [Google Scholar]
- Hartman, J. D., Gaudi, B. S., Pinsonneault, M. H., et al. 2009, ApJ, 691, 342 [NASA ADS] [CrossRef] [Google Scholar]
- Hartman, J. D., Bakos, G. A., Kovacs, G., & Noyes, R. W. 2010, MNRAS, 408, 475 [NASA ADS] [CrossRef] [Google Scholar]
- Hawley, S. L., Angus, R., Buzasi, D., et al. 2016, Kavli Workshop Report (see NOAO website: http://www.noao.edu/meetings/lsst-oir-study/) [Google Scholar]
- Henderson, C. B., & Stassun, K. G. 2012, ApJ, 747, 51 [NASA ADS] [CrossRef] [Google Scholar]
- Irwin, J., Hodgkin, S., Aigrain, S., et al. 2008, MNRAS, 384, 675 [NASA ADS] [CrossRef] [Google Scholar]
- Irwin, J., Aigrain, S., Bouvier, J., et al. 2009, MNRAS, 392, 1456 [NASA ADS] [CrossRef] [MathSciNet] [Google Scholar]
- Jeffries, R. D., Evans, P. A., Pye, J. P., & Briggs, K. R. 2006, MNRAS, 367, 781 [NASA ADS] [CrossRef] [MathSciNet] [Google Scholar]
- Judge, P. G., Solomon, S. C., Stanley, C., & Ayres, T. R. 2003, ApJ, 593, 534 [NASA ADS] [CrossRef] [Google Scholar]
- Kalirai, J. S., Fahlman, G. G., Richer, H. B., & Ventura, P. 2003, AJ, 126, 1402 [NASA ADS] [CrossRef] [Google Scholar]
- Kalirai, J. S., Saul, D. D., Richer, H. B., et al. 2009, ApJ, 705, 408 [NASA ADS] [CrossRef] [Google Scholar]
- Kenyon, S. J., & Hartmann, L. 1995, ApJS, 101, 117 [NASA ADS] [CrossRef] [Google Scholar]
- Keppens, R., MacGregor, K. B., & Charbonneau, P. 1995, A&A, 294, 469 [NASA ADS] [Google Scholar]
- Krishnamurthi, A., Pinsonneault, M. H., Barnes, S., & Sofia, S. 1997, ApJ, 480, 303 [NASA ADS] [CrossRef] [Google Scholar]
- Kulikov, Y. N., Lammer, H., Lichtenegger, H. I. M., et al. 2007, Space Sci. Rev., 129, 207 [NASA ADS] [CrossRef] [Google Scholar]
- Lammer, H., Kasting, J. F., Chassefiere, E., et al. 2008, Space Sci. Rev., 139, 399 [NASA ADS] [CrossRef] [Google Scholar]
- Landin, N. R., Mendes, L. T. S., & Vaz, L. P. R. 2010, A&A, 510, A46 [NASA ADS] [CrossRef] [EDP Sciences] [Google Scholar]
- Livingston, W., Wallace, L., White, O. R., & Giampapa, M. S. 2007, ApJ, 657, 1137 [NASA ADS] [CrossRef] [Google Scholar]
- MacGregor, K. B., & Brenner, M. 1991, ApJ, 376, 204 [NASA ADS] [CrossRef] [Google Scholar]
- MacGregor, K. B., & Charbonneau, P. 1995, ASP Conf. Ser., 64, 174 [NASA ADS] [Google Scholar]
- Maggio, A., Sciortino, S., Vaiana, G. S., et al. 1987, ApJ, 315, 687 [NASA ADS] [CrossRef] [Google Scholar]
- Mamajek, E. E., & Hillenbrand, L. A. 2008, ApJ, 687, 1264 [NASA ADS] [CrossRef] [Google Scholar]
- Mangeney, A., & Praderie, F. 1984, A&A, 130, 143 [Google Scholar]
- Martinez-Arnaiz, R., Maldonado, J., Montes, D., Eiroa, C., & Montesinos, B. 2010, A&A, 520, 79 [Google Scholar]
- Mayne, N. J., & Naylor, T. 2008, MNRAS, 386, 261 [NASA ADS] [CrossRef] [Google Scholar]
- McNamara, B. J., Harrison, T. E., McArthur, B. E., & Benedict, G. F. 2011, AJ, 142, 53 [NASA ADS] [CrossRef] [Google Scholar]
- Meibom, S., Mathieu, R. D., & Stassun, K. G. 2009, ApJ, 695, 679 [NASA ADS] [CrossRef] [Google Scholar]
- Meibom, S., Matthieu, R. D., Stassun, K. G., et al. 2011, ApJ, 733, 115 [NASA ADS] [CrossRef] [Google Scholar]
- Meibom, S., Barnes, S. A., Platais, I., et al. 2015, Nature, 517, 589 [NASA ADS] [CrossRef] [PubMed] [Google Scholar]
- Metcalfe, T. S., Egeland, R., & van Saders, J. 2016, ApJ, 826, L2 [Google Scholar]
- Micela, G., Sciortino, S., Vaiana, G. S., et al. 1990, ApJ, 348, 557 [NASA ADS] [CrossRef] [Google Scholar]
- Micela, G., Sciortino, S., Kashyap, V., et al. 1996, ApJS, 102, 75 [NASA ADS] [CrossRef] [Google Scholar]
- Moitinho, A., Alves, J., Huelamo, N., & Lada, C. J. 2001, ApJ, 563, L73 [NASA ADS] [CrossRef] [Google Scholar]
- Montesinos, B., Thomas, J. H., Ventura, P., & Mazzitelli, I. 2001, MNRAS, 326, 877 [NASA ADS] [CrossRef] [Google Scholar]
- Moraux, E., Artemenko, S., Bouvier, J., et al. 2013, A&A, 560, A13 [NASA ADS] [CrossRef] [EDP Sciences] [Google Scholar]
- Noyes, R. W., Hartmann, L. W., Baliunas, S. L., et al. 1984, ApJ, 279, 763 [NASA ADS] [CrossRef] [Google Scholar]
- Nunez, A., & Agueros, M. A. 2016, ApJ, 830, 13 [NASA ADS] [CrossRef] [Google Scholar]
- Oglethorpe, R. L. F., & Garaud, P. 2013, ApJ, 778, 166 [NASA ADS] [CrossRef] [Google Scholar]
- Pace, G. 2013, A&A, 551, L8 [NASA ADS] [CrossRef] [EDP Sciences] [Google Scholar]
- Pace, G., & Pasquini, L. 2004, A&A, 426, 1021 [NASA ADS] [CrossRef] [EDP Sciences] [Google Scholar]
- Pallavicini, R., Golub, L., Rosner, R., et al. 1981, ApJ, 248, 279 [NASA ADS] [CrossRef] [Google Scholar]
- Patten, B. M., & Simon, T. 1996, ApJS, 106, 489 [NASA ADS] [CrossRef] [Google Scholar]
- Paulson, D. B., Saar, S. H., Cochran, W. D., & Hatzes, A. P. 2002, AJ, 124, 572 [NASA ADS] [CrossRef] [Google Scholar]
- Perez Martinez, M. I., Schroder, K.-P., & Cuntz, M. 2011, MNRAS, 414, 418 [NASA ADS] [CrossRef] [Google Scholar]
- Perez Martinez, M. I., Schroder, K.-P., & Hauschildt. 2014, MNRAS, 445, 270 [NASA ADS] [CrossRef] [Google Scholar]
- Pevtsov, A. A., Fisher, G. H., Acton, L. W., et al. 2003, ApJ, 598, 1387 [NASA ADS] [CrossRef] [Google Scholar]
- Pizzolato, N., Maggio, A., Micela, G., Sciortino, S., & Ventura, P. 2003, A&A, 397, 147 [NASA ADS] [CrossRef] [EDP Sciences] [Google Scholar]
- Preibisch, T., & Feigelson, E. D. 2005, ApJS, 160, 390 [NASA ADS] [CrossRef] [Google Scholar]
- Preibisch, T., Yong-Cheol, K., Favata, F., et al. 2005, ApJS, 160, 401 [NASA ADS] [CrossRef] [Google Scholar]
- Radick, R. R., Lockwood, G. W., Skif, B. A., & Baliunas, S. L. 1998, ApJS, 118, 239 [NASA ADS] [CrossRef] [Google Scholar]
- Randich, S. 2000, in Stellar Clusters and Association: Convection, Rotation and Dynamos, ASP Conf. Ser., 198, 401 [NASA ADS] [Google Scholar]
- Randich, S., & Schmitt, J. H. M. M. 1995, A&A, 298, 115 [NASA ADS] [Google Scholar]
- Reiners, A., & Mohanty, S.2012, ApJ, 746, 43 [NASA ADS] [CrossRef] [Google Scholar]
- Rutten, R. G. M., Schrijver, C. J., Lemmens, A. F. P., & Zwaan, C. 1991, A&A, 252, 203 [NASA ADS] [Google Scholar]
- Sandquist, E. L., Jessen-Hansen, J., Shetrone, M. D., et al. 2016, ApJ, 831, 11 [NASA ADS] [CrossRef] [Google Scholar]
- Sarajedini, A., Dotter, A., & Kirkpatrick, A. 2009, ApJ, 698, 1872 [NASA ADS] [CrossRef] [Google Scholar]
- Schmitt, J. H. M. M., Kahabka, P., Stauffer, J., & Piters, A. J. M. 1993, A&A, 277, 114 [NASA ADS] [Google Scholar]
- Schrijver, C. J. 1987, A&A, 172, 111 [NASA ADS] [Google Scholar]
- Schrijver, C. J., & Zwaan, C. 2000, in Solar and Stellar Magnetic Activity (Cambridge: Cambridge University Press) [Google Scholar]
- Skumanich, A. 1972, ApJ, 171, 565 [NASA ADS] [CrossRef] [Google Scholar]
- Soderblom, D. R., Stauffer, J. R., Hudon, J. D., & Jones, B. F. 1993, ApJS, 85, 315 [NASA ADS] [CrossRef] [Google Scholar]
- Spada, F., Lanzafame, A. C., Lanza, A. F., et al. 2011, MNRAS, 416, 447 [NASA ADS] [Google Scholar]
- Stassun, K. G., Ardila, D. R., Barsony, M., et al. 2004, AJ, 127, 3537 [NASA ADS] [CrossRef] [Google Scholar]
- Stauffer, J. R., Caillault, J.-P., Gagne, M., et al. 1994, ApJS, 91, 625 [NASA ADS] [CrossRef] [Google Scholar]
- Stern, R. A., Schmitt, J. H. M. M., Pye, J. P., et al. 1994, ApJ, 427, 808 [NASA ADS] [CrossRef] [Google Scholar]
- Stern, R. A., Schmitt, J. H. M. M., & Kahabka, P. T. 1995, ApJ, 448, 683 [Google Scholar]
- VandenBerg, D. A., Don, A., & Stetson, P. B. 2004, PASP, 116, 997 [NASA ADS] [CrossRef] [Google Scholar]
- van Saders, J. L., Ceillier, T., Metcalfe, T. S., et al. 2016, Nature, 529, 181 [NASA ADS] [CrossRef] [PubMed] [Google Scholar]
- Vidotto, A. A., Gregory, S. G., Jardine, M., et al. 2014, MNRAS, 441, 2361 [NASA ADS] [CrossRef] [Google Scholar]
- Wang, Y.-M. 1998, ASP Conf. Ser., 154, 131 [NASA ADS] [Google Scholar]
- Weber, E. J., & Davis, L., Jr. 1967, ApJ, 148, 217 [NASA ADS] [CrossRef] [Google Scholar]
- White, R. J., Gabor, J. M., & Hillenbrand, L. A. 2007, AJ, 133, 2524 [NASA ADS] [CrossRef] [Google Scholar]
- Wilson, O. C. 1978, ApJ, 226, 379 [NASA ADS] [CrossRef] [Google Scholar]
- Wood, B. E., Müller, H.-R., Zank, G. P., et al. 2005, ApJ, 628, L143 [Google Scholar]
- Wood, B. E., Müller, H.-R., Redfield, S., & Edelaman, E. 2014, ApJ, 781, L33 [NASA ADS] [CrossRef] [Google Scholar]
- Wright, N. J., Drake, J. J., Mamajek, E. E., & Henry, G. W. 2011, ApJ, 743, 48 [NASA ADS] [CrossRef] [Google Scholar]
All Tables
Open clusters with age determinations and measured rotation period distributions used for deriving the best fit parameters of the parametric model of rotation evolution.
All Figures
|
Fig. 1. Simulated evolution of a normal rotation period distribution of solar mass stars compared with measured rotation period histograms of 0.9–1.1 M⊙ stars in the Pleiades (112 Myr), M50 and M35 (130 Myr), M37 (550 Myr), NGC 6811 (1050 Myr), NGC 6819 (2380 Myr), and M67 (4000 Myr). |
| In the text | |
|
Fig. 2. Simulated angular velocity evolutions of 1.0 M⊙ stars with initial rotation periods at 5 Myr of 1 (upper curve), 2, 3, 6, 10, and 20 days (lower curve). Left: the simulated angular velocity curves in log-log scale are compared with rotation measurements of 0.9–1.1 M⊙ stars (black crosses) in the Pleiades (112 Myr; Hartman et al. 2010), M50 (130 Myr; Irwin et al. 2009), M35 (133 Myr; Meibom et al. 2009), and M37 (550 Myr; Hartman et al. 2009). Right: the simulated angular velocity curves in linear scale are compared with rotation measurements of 0.9–1.1 M⊙ stars (black crosses) in M37, NGC 6811 (1.05 Gyrs; Meibom et al. 2011), NGC 6819 (2.38 Gyrs; Meibom et al. 2015), and M67 (4.0 Gyrs; Barnes et al. 2016). |
| In the text | |
|
Fig. 3. simulated evolutions of the average Ca II R′HK indices of 1.0 M⊙main-sequence stars. The different curves correspond to initial rotation periods of 1, 2, 3, 6, 10 and 20 days at an age of 5 Myr. The curve symbols are identical to those used in the corresponding angular velocity curves of Fig. 2. The simulations of the chromospheric activity evolution are compared with measurements of the R′HK index (see Mamajek & Hillenbrand 2008 and reference therein) on 0.9–1.1 M⊙ stars in the Pleiades (125 Myr), the Hyades (625 Myr) and M67 (4200 Myr). Right: simulated evolutions of the Ca II R′HK indices including their estimated dispersion around average values derived from stellar rotation due to the short-term variability of the magnetic activity. |
| In the text | |
|
Fig. 4. Left: simulated evolutions of the average X-ray luminosity of 1.0 M⊙ main-sequence stars. The Different curves correspond to initial rotation periods of 1,2, 3, 6, 10, and 20 days at an age of 5 Myr. The curve symbols areidentical to those used in the corresponding angular velocity curves of Fig. 2. The simulations of the X-ray activity evolution are compared with X-ray luminosity measurements of 0.8–1.2 M⊙ stars in NGC2362 (5 Myr), h Per (13 Myr), α Per (85 Myr), the Pleiades (125 Myr), Praesepe (600 Myr), and the Hyades (625 Myr). Right: simulated evolutions of the X-ray luminosities including their estimated dispersion around average values derived from stellar rotation due to the short-term variability of the magnetic activity. |
| In the text | |
|
Fig. 5. Simulated R′HKindex distributions of solar mass stars in open clusters with ages of 5, 13, 85, 112, 240, 625, 1000, 2400, and 4000 Myr. The results are compared with measured R′HK histograms of0.9–1.1 M⊙ stars in the Pleiades, the Hyades, and M67 scaled to the 979 stars used in the simulation. The short-term variability of the magnetic activity is described by a normal distribution of the short-term CaII chromospheric emission with a variance of 0.327 × ⟨ R′HK ⟩1.15 around the average chromospheric emission ⟨ R′HK⟩ derived from a parametric model of rotation evolution for solar mass stars. |
| In the text | |
|
Fig. 6. Simulated LX/Lbol ratio distributions of solar mass stars in open clusters with ages of 5,13, 85, 112, 240, 625, 1000, 2400, and 4000 Myr. The results are compared with measured LX/Lbol histograms of 0.9–1.1 M⊙ stars in NGC 2362, h Per, α Per, the Pleiades, Praesaepe and the Hyades scaled to the 979 stars used in the simulation. The short-term variability of the magnetic activity is described by a normal distribution of the short-term X-ray emission with a variance of ⟨ LX⟩/6 around the average X-ray luminosity ⟨ LX⟩ derived from aparametric model of rotation evolution for solar mass stars. |
| In the text | |
Current usage metrics show cumulative count of Article Views (full-text article views including HTML views, PDF and ePub downloads, according to the available data) and Abstracts Views on Vision4Press platform.
Data correspond to usage on the plateform after 2015. The current usage metrics is available 48-96 hours after online publication and is updated daily on week days.
Initial download of the metrics may take a while.