Fig. 3.
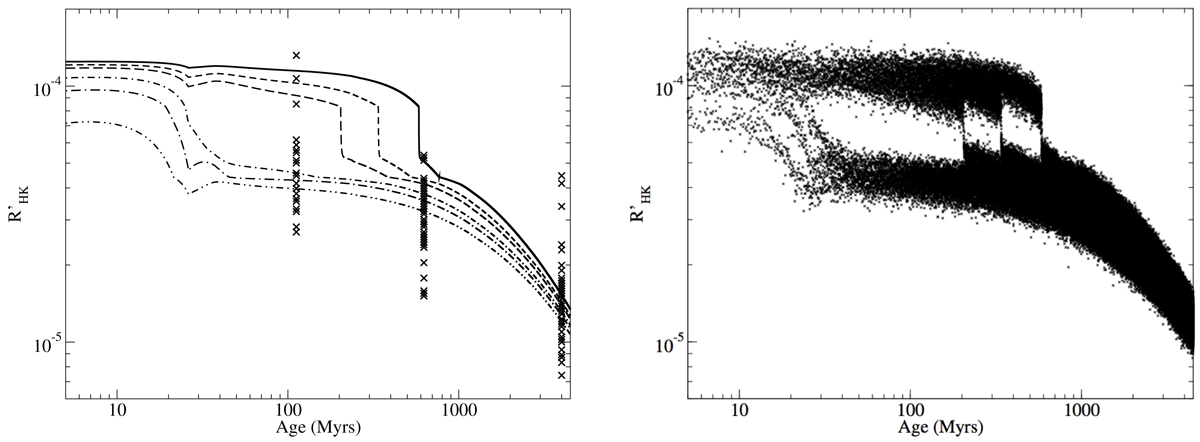
simulated evolutions of the average Ca II R′HK indices of 1.0 M⊙main-sequence stars. The different curves correspond to initial rotation periods of 1, 2, 3, 6, 10 and 20 days at an age of 5 Myr. The curve symbols are identical to those used in the corresponding angular velocity curves of Fig. 2. The simulations of the chromospheric activity evolution are compared with measurements of the R′HK index (see Mamajek & Hillenbrand 2008 and reference therein) on 0.9–1.1 M⊙ stars in the Pleiades (125 Myr), the Hyades (625 Myr) and M67 (4200 Myr). Right: simulated evolutions of the Ca II R′HK indices including their estimated dispersion around average values derived from stellar rotation due to the short-term variability of the magnetic activity.
Current usage metrics show cumulative count of Article Views (full-text article views including HTML views, PDF and ePub downloads, according to the available data) and Abstracts Views on Vision4Press platform.
Data correspond to usage on the plateform after 2015. The current usage metrics is available 48-96 hours after online publication and is updated daily on week days.
Initial download of the metrics may take a while.