Fig. 2.
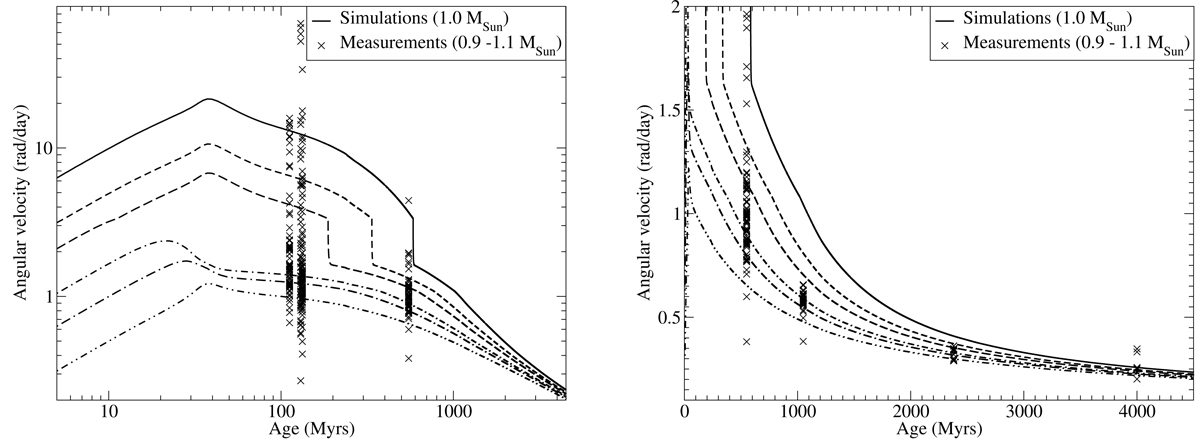
Simulated angular velocity evolutions of 1.0 M⊙ stars with initial rotation periods at 5 Myr of 1 (upper curve), 2, 3, 6, 10, and 20 days (lower curve). Left: the simulated angular velocity curves in log-log scale are compared with rotation measurements of 0.9–1.1 M⊙ stars (black crosses) in the Pleiades (112 Myr; Hartman et al. 2010), M50 (130 Myr; Irwin et al. 2009), M35 (133 Myr; Meibom et al. 2009), and M37 (550 Myr; Hartman et al. 2009). Right: the simulated angular velocity curves in linear scale are compared with rotation measurements of 0.9–1.1 M⊙ stars (black crosses) in M37, NGC 6811 (1.05 Gyrs; Meibom et al. 2011), NGC 6819 (2.38 Gyrs; Meibom et al. 2015), and M67 (4.0 Gyrs; Barnes et al. 2016).
Current usage metrics show cumulative count of Article Views (full-text article views including HTML views, PDF and ePub downloads, according to the available data) and Abstracts Views on Vision4Press platform.
Data correspond to usage on the plateform after 2015. The current usage metrics is available 48-96 hours after online publication and is updated daily on week days.
Initial download of the metrics may take a while.