| Issue |
A&A
Volume 615, July 2018
|
|
|---|---|---|
| Article Number | L10 | |
| Number of page(s) | 5 | |
| Section | Letters to the Editor | |
| DOI | https://doi.org/10.1051/0004-6361/201833381 | |
| Published online | 19 July 2018 | |
Letter to the Editor
Unlocking the secrets of the midplane gas and dust distribution in the young hybrid disc HD 141569
1
School of Physics and Astronomy, University of Leeds, Woodhouse Lane, Leeds LS2 9JT, UK
e-mail: This email address is being protected from spambots. You need JavaScript enabled to view it.
2
Institute of Astronomy, University of Cambridge, Madingley Road, Cambridge CB3 0HA, UK
3
Department of Physics, University of Warwick, Gibbet Hill Road, Coventry CV4 7AL, UK
4
Centre for Exoplanets and Habitability, University of Warwick, Gibbet Hill Road, Coventry CV4 7AL, UK
Received:
6
May
2018
Accepted:
20
June
2018
Abstract
Context. HD 141569 is a pre-main sequence star with a disc uniquely placed between protoplanetary and debris discs, similar to the older “hybrid” type discs.
Aims. This work aims to place the mass and spatial structure of the disc midplane in the context of the debris, hybrid and protoplanetary discs.
Methods. We observed HD 141569 with ALMA in 1.3 mm continuum and 13CO (2-1). This is the first detection and image of the optically thin gas emission from the midplane of this disc.
Results. In continuum emission, we detect a combination of an unresolved central peak and a ring of millimetre emission at 220 ± 10 au, slightly interior to one of the rings discovered in scattered light. The minimum dust mass of the ring is 0.13 ± 0.02 M⊕ while the unresolved millimetre peak at the stellar location is predominantly thermal emission due to a minimum of 1.2 ± 0.2 M⊕ of dust. 13CO is distributed asymmetrically around the stellar position with a peak at 1ʺ̣1 distance and a PA of −33°. The gas is detected as far as 220 ± 10 au, a radial separation the same as that of the mm ring. Assuming optically thin emission and standard ISM abundances, we used our 13CO data to derive the gas mass in the disc of (6.0 ± 0.9) × 10−4M⊙. Comparison to published 12CO data shows that 12CO is optically thick, explaining why estimates based on 12CO underestimated the gas mass.
Key words: protoplanetary disks / planets and satellites: rings / stars: variables: T Tauri, Herbig Ae/Be
© ESO 2018
1. Introduction
Understanding the evolution from protoplanetary to debris discs (Dominik & Dullemond 2002; Wyatt et al. 2015) requires an understanding of their structures. How do the many gaps, dust traps and asymmetries seen in protoplanetary discs evolve into the one or two dusty debris rings, and what is the role of gas in this process? The “hybrid” discs (Péricaud et al. 2017), are believed to probe this step in evolution because of detectable amounts of gas in the disc despite otherwise appearing to have evolved beyond the protoplanetary disc limit in dust mass.
Herbig star HD 141569 hosts the only known hybrid disc amongst pre-main sequence stars to date, a B9-A0 type, 5 Myr old star at a Gaia distance of 111 ± 1 pc (Weinberger et al. 2000; Lindegren et al. 2016)1. The spectral energy distribution (SED) and IR excess luminosity of 0.0084 (Sylvester et al. 1996) were the first indicators of this unique status. HD 141569 has an SED which appears as a scaled-down version of a protoplanetary disc SED, clearly dominated by multiple radial (temperature) components, discerning it from the known debris and hybrid discs, as both these types show, at most, two radial (temperature) components (e.g., 49 Ceti, HD 131835, Roberge et al. 2013; Moór et al. 2015; Kennedy & Wyatt 2014). The dust mass of 0.7 M⊕ (Sandell et al. 2011; Panic et al. 2013) places HD 141569 between the protoplanetary and debris-disc regimes (Wyatt et al. 2015). First detected by Dent et al. (2005), the CO gas extends up to 200 au (Flaherty et al. 2016; White et al. 2016) and is nested inside the two outermost rings detected by Hubble Space Telescope NICMOS at 234 and 388 au (Augereau et al. 1999; Weinberger et al. 1999; Biller et al. 2015). Reported gas masses range between 4.5 × 10⁻⁶M⊙ derived from 12CO (White et al. 2016) and 5 × 10⁻⁴M⊙ derived from SED model fits to Herschel line observations (Thi et al. 2014). None of these estimates employed optically thin CO isotopologue emission, which until now remained undetected in this disc. The estimated gas mass range for HD 141569 is below the typical protoplanetary disc gas masses of 10−3M⊙ to 10−1M⊙ but above the hybrid discs gas masses which are mainly <10−6M⊙ (Péricaud et al. 2017).
Insight into the innermost regions comes from SED fitting, with an inner radius set at 30 au (Marsh et al. 2002), and CO ro-vibrational emission placing gas as close as 11 au from the star (Goto et al. 2006). These regions have recently been imaged with SPHERE on the Very Large Telescope (VLT), detecting a series of concentric, but discontinuous, scattered light “ringlets” at separations of 45, 61 and 89 au (Perrot et al. 2016). Inside these ringlets is a dust disc component within 0ʺ̣2, detected in 8.2 μm imaging with VLT VISIR instrument (Perrot et al. 2016). A central, unresolved component of millimetre continuum emission peaks at the stellar location (Marsh et al. 2002; White et al. 2018). Beyond the gas-rich region are the two scattered light rings at 234 and 388 au, with inclination and PA similar to that of the inner rings seen with SPHERE (Perrot et al. 2016), but showing more complex structures and spirals, possibly due to planets within the disc (Wyatt 2005) or a fly-by (Reche et al. 2009).
In this letter we show to what extent the midplane gas and dust of HD 141569 exhibit protoplanetary and debris disc characteristics, in the context of increasing evidence for a hybrid class of discs.
2. Observations and results
Our ALMA observations in Band 6 were taken on 2016, May 16 (PI Panić, ID 2015.1.01600.S). 39 antennas of 12 m diameter were employed in a configuration providing baseline lengths ranging from 16 m to 640 m. The velocity resolution is 0.166 km s−1 for 13CO and 0.333 km s−1 for C18O, providing optimal sensitivity to the tenuous and previously undetected midplane gas emission. The total effective continuum bandwidth was 4 GHz. The data were flagged and calibrated following the ALMA-pipeline data reduction. Titan was used as the flux calibrator, J1550+0527 and J1733−1304 were used as the bandpass and phase calibrators respectively2. Using CASA 4.7.1, we subtracted the continuum emission in the uv-space. Images were created using the clean algorithm (Rau & Cornwell 2011); as we have no a priori knowledge of the distribution of 13CO or indeed of the dust emission, we adopted natural weighting to prioritise the collection of signal, rather than the increased resolution that could be achieved with other baseline weightings. This produced a synthesized beam size of ʺ̣65 (72 au) for the continuum and 0ʺ̣71 (79 au) for 13CO and C18O.
Rms noise level in the continuum image is 0.11 mJy beam−1, and in the 13CO and C18O channel maps rms was 0.04 and 0.03 Jy km s−1 beam−1 respectively. In the continuum imaging an unresolved point source of 1.7 mJy is detected. 13CO does not show a firm detection in the individual channel maps, but the integrated intensity map over the known range of velocities in which 12CO is seen (Flaherty et al. 2016; White et al. 2016) shows a 6σ detection in 13CO. C18O is not detected >3σ in either the channels or the integrated intensity map.
We perform azimuthal averaging in radial bins of 0″.12 for the 13CO and 1.3 mm maps, and 0ʺ̣15 for 12CO. Neither the strongly asymmetric 13CO nor the unresolved central 1.3 mm emission can provide reliable constraints on the position angle and inclination of the disc, so for deprojection of coordinates we adopt the values of the 12CO disc, PA = −9° and inclination = 55° (White et al. 2016). Figure 1 shows the averaged profiles. At 220 au we detect a thin concentration of millimetre grains concentrated into a ring and detect 13CO(2-1) emission as far as 220 ± 10 au.
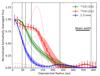 |
Fig. 1. Azimuthally averaged flux profile following the deprojection of coordinates from the 1.3 mm image of HD 141569 (blue), 12CO (green) and 13CO (red). Vertical black lines show the radial locations of rings identified in scattered light. Peak intensities for 1.3 mm continuum, 12CO and 13CO are 1.74 mJy beam−1, 1.06 and 0.25 Jy km s−1 beam−1 respectively. Coloured dotted lines show NW (upper) and SE (lower) cuts of the 12CO and 13CO maps along the position angle of the 13CO peak. The shaded regions show the variation of the profile when changing inclination of the source by ±10°. Error bars are calculated as described in the text, the coloured dashed lines represent the noise level after averaging for each curve. |
To derive uncertainties for the radial flux profiles we azimuthally average emission free-regions of the image that are sufficiently far from the central emission but close enough to have high beam efficiency. The mean value across emission-free regions from different parts of the image gives a flux profile that describes the background noise in the image as a result of the averaging process. This method is more robust than simply taking the variation in an elliptical bin and does not rely on any predefined disc models. The resultant noise curves are shown in Fig. 1. for each tracer, where the outer belt is detected at ~6σ mm in contiguous radial bins (comparing the 1.3 mm curve to the blue dashed noise line), with a peak at 220±10 au.
3. Discussion
3.1. Dust emission
The comparison of the radial profile of 1.3 mm flux with the known disc structures shows that some of the flux in the central unresolved component may be arising from the rings detected by SPHERE (Perrot et al. 2016). We calculated a minimum dust mass for the inner disc by assuming optically thin emission, using  , taking a midplane disc temperature of 20 K, an opacity, κv, corresponding to mm size grains of 1.15 cm2 g−1 (Draine 2006) and a distance to the star, d, of 111 pc. The minimum dust mass for the inner disc is calculated to be (3.6±0.5) × 10−6M⊙ = 1.2 ± 0.2 M⊕. We have assumed in this calculation that all emission is thermal. A maximum opacity has been chosen to derive a minimum dust mass, the uncertainties correspond to a ±15% flux calibration uncertainty applied to all ALMA observations. This mass depends on disc temperature, 20 K is a good assumption for cool material in the midplane and outer disc, increasing the assumed midplane temperature to 50 K would give a mass of 0.04 M⊕.
An alternative explanation for the origin of this flux may be free-free emission, rather than thermal emission originating from rings of dust within the inner disc. In fact, a typical mm contribution from free-free emission in Herbig discs at a similar distance to HD 141569, is a few mJy (e.g., Wright et al. 2015), similar to the 1.7 mJy integrated flux we measure for the unresolved peak. Free-free emission has a characteristic spectral slope of −0.1 for optically thin emission, considerably lower than that of thermal continuum emission in this regime and so its effect may be seen in the spectral index. Protoplanetary discs typically show αmm ≈ 2–3, transition discs tend to show slightly higher values than this (Pinilla et al. 2014), whilst debris discs have αmm ≈ 2.5–3 (MacGregor et al. 2016). ALMA and VLA observations derive a spectral index for the disc of αmm = 1.63 (MacGregor et al. 2016; White et al. 2018), with which our 1.3 mm integrated flux of 1.8 mJy is consistent. αmm calculated between ALMA observations at 870 μm and 2.9 mm also give a steeper, but still relatively low value of 1.81 (White et al. 2018). VLA observations show a significant variability in the continuum flux of the disc, varying by a factor of two to three on timescales of tens of minutes (White et al. 2018). Fluxes measured on integration times shorter than the variability timescale may therefore only offer a snapshot of flux emission. To make a conservative estimate of possible free-free contribution we extrapolated from VLA flux of 54 μJy (MacGregor et al. 2016) using a characteristic spectral slope for optically thin free-free emission; from this estimate the free-free flux at 1.3 mm would be just 3% of the total integrated flux we measure, meaning the flux we detect is predominantly thermal, potentially with small free-free contribution of order 10 s of μJy at most.
In Fig. 1 we see an increase in measured flux which peaks at a deprojected radial separation of 220 ± 10 au. The ring is detected interior to scattered light ring at 234 au (Biller et al. 2015) as is demonstrated by the ellipses in Fig. 2. Taking the flux from the peak of the ring in Fig. 1 and assuming the same temperature and opacity as before, we are able to calculate a minimum dust mass of 0.13 ± 0.02 M⊕, firmly in the debris disc regime <1 M⊕. We can place an upper limit on the outermost scattered light ring at 388 au from our non-detection in the continuum. Making the same assumptions as before, the maximum mass of the outer ring at which it could still avoid detection in azimuthal averaging is ~0.11 ± 0.02 M⊕.
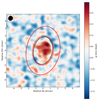 |
Fig. 2. 13CO emission is shown in the colour map and contoured at levels of (3,4,5,6)×σ13, with σ13=0.040 Jy km s−1 beam−1. The red ellipses show the position of the HST rings with parameters from Biller et al. (2015). The black ellipse shows the location of the mm ring detected in the 1.3 mm continuum image. |
The position of the millimetre ring relative to the gas disc hints at potential formation mechanisms. A continuum ring at the edge of the gas disc is a morphology that can be compared with models of a primordial, but depleted gas disc. In this case radiation pressure overcomes radial drift to push dust particles of <100 μm outwards to the edge of the gas disc (Takeuchi & Artymowicz 2001). The ring emission we detect is likely to come from larger grain sizes; millimetre continuum is emitted most efficiently by a narrow range between 1 mm and 1 cm (Takeuchi & Lin 2005). If blow-out from radiation pressure formed the ring, the small grains collecting up at the edge of the gas disc would have to collide and grow into mm-sized grains. This seems unlikely; some small grains will acquire an eccentricity from this process, resulting in collisions that would occur at higher velocity leading to fragmentation rather than grain growth (Takeuchi & Artymowicz 2001, see Fig. 7). Given our results, a more detailed application of this model to HD 141569 is required, but the level of necessary grain growth seems extremely difficult to achieve. An alternative scenario might be the sculpting of grains into a ring as a result of an unseen planet or perhaps a flyby. Two M dwarfs in a binary system are located less than 9ʺ̣0 away from HD 141569 and previous studies of the disc considering a flyby have been able to reproduce global disc features such as the wide gap in the dust and spiral structures (Augereau & Papaloizou 2004; Ardila et al. 2005; Reche et al. 2009). The caveat on this explanation is that the statistical likelihood of such a flyby is still low and the relationship, both present and past, between HD 141569 and the binary is not completely understood (Reche et al. 2009).
3.2. Gas emission
The 13CO emission is strongly asymmetrical (Fig. 2). The emission peak is measured at 6σ13 off centre from the stellar position, located at a vdeprojected separation of 1ʺ̣1 (120 ± 10 au) at a position angle of −33°. Whilst at the same separation towards the south-east direction, emission is measured <2σ13. The emission we detect from 13CO is roughly co-spatial with the scattered light emission of the eccentric dust ring found at a separation of 89 au (Perrot et al. 2016, their Fig. B.3). Intriguingly, the ring is brighter in scattered light at the opposite side of the disc. 13CO is detected over a considerably larger radial range than the inner edge of the gas disc at 11 au seen in CO rovibrational emission (Goto et al. 2006), than the inner edge of the dust disc of 30 au derived from the SED (Marsh et al. 2002), and than the asymmetry seen in 12CO channel maps (White et al. 2016).
The radially brightest 13CO emission is within the same range of stellocentric distances in which the scattered light rings were found, at 45, 61 and 89 au (Perrot et al. 2016), and co- spatial with the HST detection of scattered light between 0ʺ̣4 and 1ʺ̣0 (Konishi et al. 2016). Through azimuthal averaging (Fig. 1) we find that the largest radial distance 13CO is detected to is 220 ± 10 au. This separation is coincident with the location of the ring we detect in millimetre emission, with both interior to the 234 au scattered light ring.
Such an asymmetry in molecular gas has been seen in the debris disc Beta Pic (Dent et al. 2014), which may have resulted from giant collisions (for example Jackson et al. 2014), but which is more likely to be due to the collisional destruction of planetesimals trapped in resonance with a planet (Wyatt 2003; Matrà et al. 2017). This scenario would make the gas secondary and so may be different to HD 141569 if the gas in the latter is primordial; the large radial extent of the gas is more typical of a primordial origin, but the nature of the gas in the disc is yet to be confirmed. Younger, protoplanetary, discs can also exhibit strong azimuthal asymmetry that is typically strongest in the dust emission, for example, Oph IRS 48, MWC 758 (van der Marel et al. 2013; Boehler et al. 2017). “Lop-sided” discs form as a result of dust traps that depend upon the surface density and turbulence of the disc (Pinilla et al. 2012; Birnstiel et al. 2013), making it an unlikely mechanism in the less massive hybrid and debris discs.
To determine the optical depth of 12CO, we calculated the spatial distribution of τ12CO by using the 12CO and 13CO images. We converted the higher transition 12CO (3-2) emission into the minimum expected 12CO (2-1) emission using a 12CO(2-1)/12CO(3-2) ratio (1.08) obtained from the RADEX online tool for the disc temperature of 50 K (van der Tak et al. 2007)3. Using lower temperatures does not change this ratio by more than a factor of two and ensures we used the minimum amount of CO(2-1), therefore calculating the minimum optical depth. We convolved both the 12CO and 13CO images with the synthesized beam of the 13CO image in order to ensure the images have the same effective smoothing. Under the assumption that both lines have the same excitation temperature, the ratio of 12CO(2-1) and 13CO(2-1) emission is then used to compute the optical depths of both lines, following the method used in, e.g. Schwarz et al. (2016), and assuming the ratio of optical depths to follow the ISM abundance of 77. The obtained map (Fig. 3) shows that τ12CO ranges from 3 to 45 (Fig. 3). τ13CO is therefore in the range from 0.04 to 0.58.
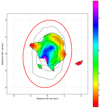 |
Fig. 3. Map of the optical depth of 12CO, the colour map is plotted for regions of the disc where we detect 13CO > 3σ13. Overlaid in solid black contours of (10, 20, 30, 40) × σ12 (σ12 = 0.064 Jy km s−1 beam−1) is the 12CO integrated intensity map convolved with the larger beam and dashed black contours show 13CO as in Fig. 2. |
Figure 3 confirms 12CO (2-1), and therefore also (3-2), to be optically thick throughout the disc, while the 13CO is not. In central regions τ12CO ~ 2 where 12CO is strongest, reaching as high as 25 in outer regions where 13CO is detected strongly. Once 12CO becomes optically thick, it ceases to trace mass in the midplane because emission is coming from upper layers of the disc at greater scale heights. This may also explain why the asymmetry of the disc is so prominent in the 13CO map, but not in the 12CO; the optically thick 12CO emission is dominated by the temperature of the emitting layer, which increases closer to the star, so a combination of temperature and emitting surface area are responsible for the brightness of emission, rather than the fractional changes in gas density. However the optically thin 13CO traces density more faithfully and provides a better indicator of the spatial distribution of gas in the disc, highlighting any asymmetries which may be hidden by temperature and surface area effects in 12CO. The radial profiles shown in Fig. 1 illustrate this effect: the azimuthally averaged flux drops sharply after the peak at around ~30 au for 12CO, but the 13CO emission is still >75% of the peak value until after 100 au. This is clearer in the NW/SE slices in Fig. 1 taken in the direction of the 13CO peak. In green, the 12CO peaks much closer to the star where temperature effects are more prominent (~30 au in the NW slice), whilst the 13CO peaks much further out in the disc at a deprojected distance of ~120 au. The slices also illustrate the magnitude of the asymmetry in the midplane gas, with a very strong 13CO peak towards the north-west that is considerably stronger than the average flux at that separation. This demonstrates the importance of using CO isotopologues, as done here, to investigate the disc midplane, and the gas density distribution within it.
Having shown that the 13CO emission is optically thin, we derive a lower limit on the mass of the gas disc using![Mathematical equation: $$ M_\mathrm{gas}=\frac{4\pi}{hv_{21}}\frac{F_{21}m\mathrm d^2}{A_{21}x_2}{\left[\frac{{\mathrm H}_2}{{}^{12}\mathrm{CO}}\right]}\left[\frac{{}^{12}\mathrm{CO}}{{}^{13}\mathrm{CO}}\right] $$](/articles/aa/full_html/2018/07/aa33381-18/aa33381-18-eq2.gif) (1)
(1)
where F21 is the integrated line flux from the J = 2–1 transition of 13CO, m is the mass of the CO molecule, A21 the Einstein coefficient for the transition, is the frequency at which the transition occurs and x is the fractional population of the upper level. We take the midplane temperature to be 20 K and assume ISM abundances of 12CO/13CO = 77 and 12CO/H2 = 10−4 (Wilson & Rood 1994) to give a total gas disc minimum mass of (6.0 ± 0.9) × 10−4M⊙. Sequestration of CO into icy bodies or conversion into more complex molecules can reduce gas-phase CO in the disc, decreasing the gas mass calculated by this method. Our minimum mass is two orders of magnitude larger than that calculated using the same method but with 12CO as the mass tracer, ~4.5 × 10⁻⁶M⊙ (White et al. 2016). SMA observations CO(1-0) emission gives a gas disc mass 1.05 × 10⁻⁴M⊙, comparable to the mass we derive here, however MCMC modelling of the data gave a slightly lower value of 3.8 × 10⁻⁵M⊙ (Flaherty et al. 2016). Thi et al. (2014) also find a similar order of magnitude by fitting Herschel gas line observations in the far-IR to simultaneous radiative transfer and chemical modelling, giving a range of 2.5–5 × 10⁻⁴M⊙. Each of these methods assume 12CO/H = 10−4.
12CO therefore appears to be underestimating disc mass, agreeing with our confirmation of the tracer’s optical thickness. A similar scenario was found in 30 Myr old hybrid disc HD 21997; Kospal et al. (2013) calculate a CO gas mass in the disc from the optically thin C18O line that was two orders of magnitude larger than that previously calculated assuming optically thin 12CO emission (Moór et al. 2011).
Our observations do not detect C18O, but from the rms noise in the integrated image we can derive an upper limit on the C18O gas mass and a corresponding estimate of the disc gas mass. Rms in the C18O image with natural weighting is 25 mJy beam−1, yielding a total gas mass estimate of 1.4 × 10⁻⁴M⊙ assuming T = 20 K, ISM abundances and isotopic ratios. This value is higher than that traced by the optically thick 12CO, but much lower than the estimate based on the 13CO. In fact, the flux ratio between 13CO and the upper limit on C18O flux is 31, significantly higher than the typical ISM abundance of eight (Wilson & Rood 1994). This implies that C18O is under abundant by at least a factor of 3.8. An explanation for this may be the isotope-selective photo-dissociation, known to deplete the less abundant isotopologues such as C18O in discs (Visser et al. 2009; Miotello et al. 2016). The higher column density of the more abundant isotopologue, in this case 13CO, means that it can self-shield from photodissociation more effectively. It is important to note that isotope-selective photodissociation cannot be the cause of the differences between the gas mass estimates based on 12CO and 13CO, as it would have the opposite effect: The mass based on 12CO should be higher in such case. In case of optically thick 12CO emission, as here, only the comparisons between the optically thin isotopologue lines allows us to assess the selective photodissociation effects, again stressing the importance of observing these species.
3.3. Nature of the disc
In this section we compare our new results on disc structure and mass of gas and dust to some similar systems.
Known hybrid discs generally have disc gas masses4 derived from CO observations of order one Earth mass (e.g. 49 Ceti 6.6 × 10⁻⁶M⊙, HD 131835 1.3 × 10⁻⁵M⊙, Hughes et al. 2008; Moór et al. 2015). HD 141569 has a particularly massive gas disc in comparison (see e.g. Fig. 6 of Péricaud et al. 2017). All previous estimates were based on optically thick tracers, which explains why in this work we derive (6.0 ± 0.9) × 10−4M⊙, in other words, two orders of magnitude greater mass. A more direct comparison can be made with hybrid disc HD 21997, where the disc mass derived from ALMA observations of optically thin C18O giving 0.8–1.8 × 10⁻⁴M⊙ (Kospal et al. 2013) a factor of a few less than HD 141569. Hybrid discs in general may be hosting more gas than is traced by CO and its isotopologues, not only due to optical depth but also if CO has been depleted with respect to H2.
The minimum dust mass 1.2 ± 0.2 M⊕ corresponding to the unresolved component is greater than the dust masses of HD 131835 (0.47 M⊕Moór et al. 2015), HD 21997 (0.09 M⊕Moór et al. 2013) and 49 Ceti (0.2 M⊕Holland et al. 2017).
The millimetre ring at 220 au has a minimum dust mass of 0.13 ± 0.02 M⊕. This mass and the scattered light ring seen at a slightly larger distance are both comparable to typical debris discs. Debris systems show evidence of rings containing millimetre sized grains at large radii outside an inner debris component like HD 181327 (Marino et al. 2016) and HD 107146 (Ricci et al. 2015; Marino et al. 2018), perhaps the nesting of structure within a larger ring is a more common component than we currently anticipate.
4. Conclusions
We detect an asymmetric distribution of midplane gas in the young hybrid disc HD 141569, traced by optically thin 13CO emission. We also detect a faint mm ring of emission at 220 ± 10 au, providing a midplane counterpart to the ring detected in scattered light, where these small dust grains originate. We derive the minimum dust mass in the ring of 0.13 ± 0.02 M⊕, around 10% of the total flux from the system. The bulk of the millimetre emission, known to be variable, coincides with the location of the star and is unresolved, placing an upper limit on its radial extension of 72 au. This emission traces a minimum of 1.2 ± 0.2 M⊕ of dust, but may have a free-free contribution of ≤3%. From our observations we are able to place an upper limit on the outermost ring of 0.11 ± 0.02 M⊕.
The gas disc is interior to this ring at 220 au. From the integrated 13CO flux we derive a gas mass for the disc of (6.0 ± 0.9) × 10−4M⊙; a mass of approximately two orders of magnitude greater than that derived using 12CO. We show that the reason for this is the high optical depth of 12CO, rendering any gas mass value derived from its emission a large underestimate. Non-detection of C18O shows that this isotopologue is about four times less abundant than we would expect, based on the standard isotopic ratio between 16O and 18O, and we propose the isotope-selective photodissociation as the culprit.
At the time of completion of the work on our data, the detection of the continuum ring was presented in a publication by others (White & Boley 2018). We nonetheless present the analysis of our entire dataset, including both gas lines and the dust.
Acknowledgments
We thank the anonymous referee for a valuable review. We would also like to thank Illaria Pascucci, Jane Greaves and Anita Richards for useful discussions. The work of J. M. is supported through the University Research Scholarship of the University of Leeds. The work of O. P. is funded by the Royal Society through the Dorothy Hodgkin Fellowship. G. M. K. is supported by the Royal Society as a University Research Fellow.
We have scaled previously reported length scales to the new Gaia distance for the source.
To analyse our data we used the available 12CO(3-2) data published in White et al. (2016).
Available at home.strw.leidenuniv.nl/moldata/radex.html
We assumed here 12CO/H2 = 10−4 to convert CO masses to total disc masses in order for ease of comparison. For individual discs this ratio may be less appropriate than others.
References
- Ardila, D. R., Lubow, S. H., Golimowski, D. A., et al. 2005, ApJ, 627, 986 [NASA ADS] [CrossRef] [Google Scholar]
- Augereau, J. C., & Papaloizou, J. C. B. 2004, A&A, 414, 1153 [NASA ADS] [CrossRef] [EDP Sciences] [Google Scholar]
- Augereau, J. C., Lagrange, A. M., Mouillet, D., & Ménard, F. 1999, A&A, 350, 51 [Google Scholar]
- Biller, B. A., Liu, M. C., Rice, K., et al. 2015, MNRAS, 450, 4446 [NASA ADS] [CrossRef] [Google Scholar]
- Birnstiel, T., Dullemond, C. P., & Pinilla, P. 2013, A&A, 550, L8 [NASA ADS] [CrossRef] [EDP Sciences] [Google Scholar]
- Boehler, Y., Ricci, L., Weaver, E., et al. 2017, ApJ, 853, 162 [Google Scholar]
- Dent, W. R. F., Greaves, J. S., & Coulson, I. M. 2005, MNRAS, 359, 663 [NASA ADS] [CrossRef] [Google Scholar]
- Dent, W. R. F., Wyatt, M. C., Roberge, A., et al. 2014, Science, 343, 1490 [Google Scholar]
- Dominik, C., & Dullemond, C. P. 2002, in The Origin of Stars and Planets: The VLT View (Heidelberg: Springer), 439 [Google Scholar]
- Draine, B. T. 2006, ApJ, 636, 1114 [NASA ADS] [CrossRef] [Google Scholar]
- Flaherty, K. M., Hughes, A. M., Andrews, S. M., et al. 2016, ApJ, 818, 97 [NASA ADS] [CrossRef] [Google Scholar]
- Goto, M., Usuda, T., Dullemond, C. P., et al. 2006, ApJ, 652, 758 [NASA ADS] [CrossRef] [Google Scholar]
- Holland, W. S., Matthews, B. C., Kennedy, G. M., et al. 2017, MNRAS, 470, 3606 [NASA ADS] [CrossRef] [Google Scholar]
- Hughes, A. M., Wilner, D. J., Kamp, I., & Hogerheijde, M. R. 2008, ApJ, 681, 626 [NASA ADS] [CrossRef] [Google Scholar]
- Jackson, A. P., Wyatt, M. C., Bonsor, A., & Veras, D. 2014, MNRAS, 440, 3757 [NASA ADS] [CrossRef] [Google Scholar]
- Kennedy, G. M., & Wyatt, M. C. 2014, MNRAS, 444, 3164 [NASA ADS] [CrossRef] [Google Scholar]
- Konishi, M., Grady, C. A., Schneider, G., et al. 2016, ApJ, 818, L23 [NASA ADS] [CrossRef] [Google Scholar]
- Kospal, A., Moor, A., Juhasz, A., et al. 2013, ApJ, 776, 77 [NASA ADS] [CrossRef] [Google Scholar]
- Lindegren, L., Lammers, U., Bastian, U., et al. 2016, A&A, 595, A4 [NASA ADS] [CrossRef] [EDP Sciences] [Google Scholar]
- MacGregor, M. A., Wilner, D. J., Chandler, C., et al. 2016, ApJ, 823, 79 [NASA ADS] [CrossRef] [Google Scholar]
- Marino, S., Matrà, L., Stark, C., et al. 2016, MNRAS, 460, 2933 [NASA ADS] [CrossRef] [Google Scholar]
- Marino, S., Carpenter, J., Wyatt, M. C., et al. 2018, MNRAS, submitted [Google Scholar]
- Marsh, K. A., Silverstone, M. D., Becklin, E. E., et al. 2002, ApJ, 573, 425 [NASA ADS] [CrossRef] [Google Scholar]
- Matrà, L., Dent, W. R. F., Wyatt, M. C., et al. 2017, MNRAS, 464, 1415 [NASA ADS] [CrossRef] [Google Scholar]
- Miotello, A., van Dishoeck, E. F., Kama, M., & Bruderer, S. 2016, A&A, 594, A85 [NASA ADS] [CrossRef] [EDP Sciences] [Google Scholar]
- Moór, A., Abrahám, P., Juhász, A., et al. 2011, ApJ, 740, L7 [NASA ADS] [CrossRef] [Google Scholar]
- Moór, A., Juhász, A., Kóspál, A., et al. 2013, ApJ, 777, L25 [NASA ADS] [CrossRef] [Google Scholar]
- Moór, A., Henning, T., Juhász, A., et al. 2015, ApJ, 814, 42 [NASA ADS] [CrossRef] [Google Scholar]
- Panic, O., Holland, W. S., Wyatt, M. C., et al. 2013, MNRAS, 435, 1037 [NASA ADS] [CrossRef] [Google Scholar]
- Péricaud, J., Di Folco, E., Dutrey, A., Guilloteau, S., & Piétu, V. 2017, A&A, 600, A62 [NASA ADS] [CrossRef] [EDP Sciences] [Google Scholar]
- Perrot, C., Boccaletti, A., Pantin, E., et al. 2016, A&A, 590, L7 [NASA ADS] [CrossRef] [EDP Sciences] [Google Scholar]
- Pinilla, P., Birnstiel, T., Ricci, L., et al. 2012, A&A, 538, A114 [NASA ADS] [CrossRef] [EDP Sciences] [Google Scholar]
- Pinilla, P., Benisty, M., Birnstiel, T., et al. 2014, A&A, 564, A51 [NASA ADS] [CrossRef] [EDP Sciences] [Google Scholar]
- Rau, U., & Cornwell, T. J. 2011, A&A, 532, A71 [NASA ADS] [CrossRef] [EDP Sciences] [Google Scholar]
- Reche, R., Beust, H., & Augereau, J.-C. 2009, A&A, 493, 661 [NASA ADS] [CrossRef] [EDP Sciences] [Google Scholar]
- Ricci, L., Carpenter, J. M., Fu, B., et al. 2015, ApJ, 798, 124 [NASA ADS] [CrossRef] [Google Scholar]
- Roberge, A., Kamp, I., Montesinos, B., et al. 2013, ApJ, 771, 69 [NASA ADS] [CrossRef] [Google Scholar]
- Sandell, G., Weintraub, D. A., & Hamidouche, M. 2011, ApJ, 727, 26 [NASA ADS] [CrossRef] [Google Scholar]
- Schwarz, K. R., Bergin, E. A., Cleeves, L. I., et al. 2016, ApJ, 823, 91 [NASA ADS] [CrossRef] [Google Scholar]
- Sylvester, R. J., Skinner, C. J., Barlow, M. J., & Mannings, V. 1996, MNRAS, 279, 915 [NASA ADS] [CrossRef] [Google Scholar]
- Takeuchi, T., & Artymowicz, P. 2001, ApJ, 557, 990 [NASA ADS] [CrossRef] [Google Scholar]
- Takeuchi, T., & Lin, D. N. C. 2005, ApJ, 623, 482 [NASA ADS] [CrossRef] [Google Scholar]
- Thi, W. F., Pinte, C., Pantin, E., et al. 2014, A&A, 561, A50 [NASA ADS] [CrossRef] [EDP Sciences] [Google Scholar]
- van der Marel, N., van Dishoeck, E. F., Bruderer, S., et al. 2013, Science, 340, 1199 [NASA ADS] [CrossRef] [PubMed] [Google Scholar]
- van der Tak, F. F. S., Black, J. H., Schöier, F. L., Jansen, D. J., & van Dishoeck, E. F. 2007, A&A, 468, 627 [NASA ADS] [CrossRef] [EDP Sciences] [Google Scholar]
- Visser, R., van Dishoeck, E. F., & Black, J. H. 2009, A&A, 503, 323 [NASA ADS] [CrossRef] [EDP Sciences] [Google Scholar]
- Weinberger, A. J., Becklin, E. E., Schneider, G., et al. 1999, ApJ, 525, 53 [Google Scholar]
- Weinberger, A. J., Rich, R. M., Becklin, E. E., Zuckerman, B., & Matthews, K. 2000, ApJ, 544, 937 [NASA ADS] [CrossRef] [Google Scholar]
- White, J. A., & Boley, A. C. 2018, ApJ, 859, 103 [NASA ADS] [CrossRef] [Google Scholar]
- White, J. A., Boley, A. C., Hughes, A. M., et al. 2016, ApJ, 829, 6 [NASA ADS] [CrossRef] [Google Scholar]
- White, J. A., Boley, A. C., MacGregor, M. A., Hughes, A. M., & Wilner, D. J. 2018, MNRAS, 474, 4500 [NASA ADS] [CrossRef] [Google Scholar]
- Wilson, T. L., & Rood, R. T. 1994, ARA&A, 32, 191 [NASA ADS] [CrossRef] [Google Scholar]
- Wright, C. M., Maddison, S. T., Wilner, D. J., et al. 2015, MNRAS, 453, 414 [NASA ADS] [CrossRef] [Google Scholar]
- Wyatt, M. C. 2003, ApJ, 598, 1321 [NASA ADS] [CrossRef] [MathSciNet] [Google Scholar]
- Wyatt, M. C. 2005, A&A, 440, 937 [NASA ADS] [CrossRef] [EDP Sciences] [Google Scholar]
- Wyatt, M. C., Panić, O., Kennedy, G. M., & Matrà, L. 2015, Ap&SS, 357, 103 [NASA ADS] [CrossRef] [Google Scholar]
All Figures
|
Fig. 1. Azimuthally averaged flux profile following the deprojection of coordinates from the 1.3 mm image of HD 141569 (blue), 12CO (green) and 13CO (red). Vertical black lines show the radial locations of rings identified in scattered light. Peak intensities for 1.3 mm continuum, 12CO and 13CO are 1.74 mJy beam−1, 1.06 and 0.25 Jy km s−1 beam−1 respectively. Coloured dotted lines show NW (upper) and SE (lower) cuts of the 12CO and 13CO maps along the position angle of the 13CO peak. The shaded regions show the variation of the profile when changing inclination of the source by ±10°. Error bars are calculated as described in the text, the coloured dashed lines represent the noise level after averaging for each curve. |
| In the text | |
|
Fig. 2. 13CO emission is shown in the colour map and contoured at levels of (3,4,5,6)×σ13, with σ13=0.040 Jy km s−1 beam−1. The red ellipses show the position of the HST rings with parameters from Biller et al. (2015). The black ellipse shows the location of the mm ring detected in the 1.3 mm continuum image. |
| In the text | |
|
Fig. 3. Map of the optical depth of 12CO, the colour map is plotted for regions of the disc where we detect 13CO > 3σ13. Overlaid in solid black contours of (10, 20, 30, 40) × σ12 (σ12 = 0.064 Jy km s−1 beam−1) is the 12CO integrated intensity map convolved with the larger beam and dashed black contours show 13CO as in Fig. 2. |
| In the text | |
Current usage metrics show cumulative count of Article Views (full-text article views including HTML views, PDF and ePub downloads, according to the available data) and Abstracts Views on Vision4Press platform.
Data correspond to usage on the plateform after 2015. The current usage metrics is available 48-96 hours after online publication and is updated daily on week days.
Initial download of the metrics may take a while.