Free Access
Fig. 2.
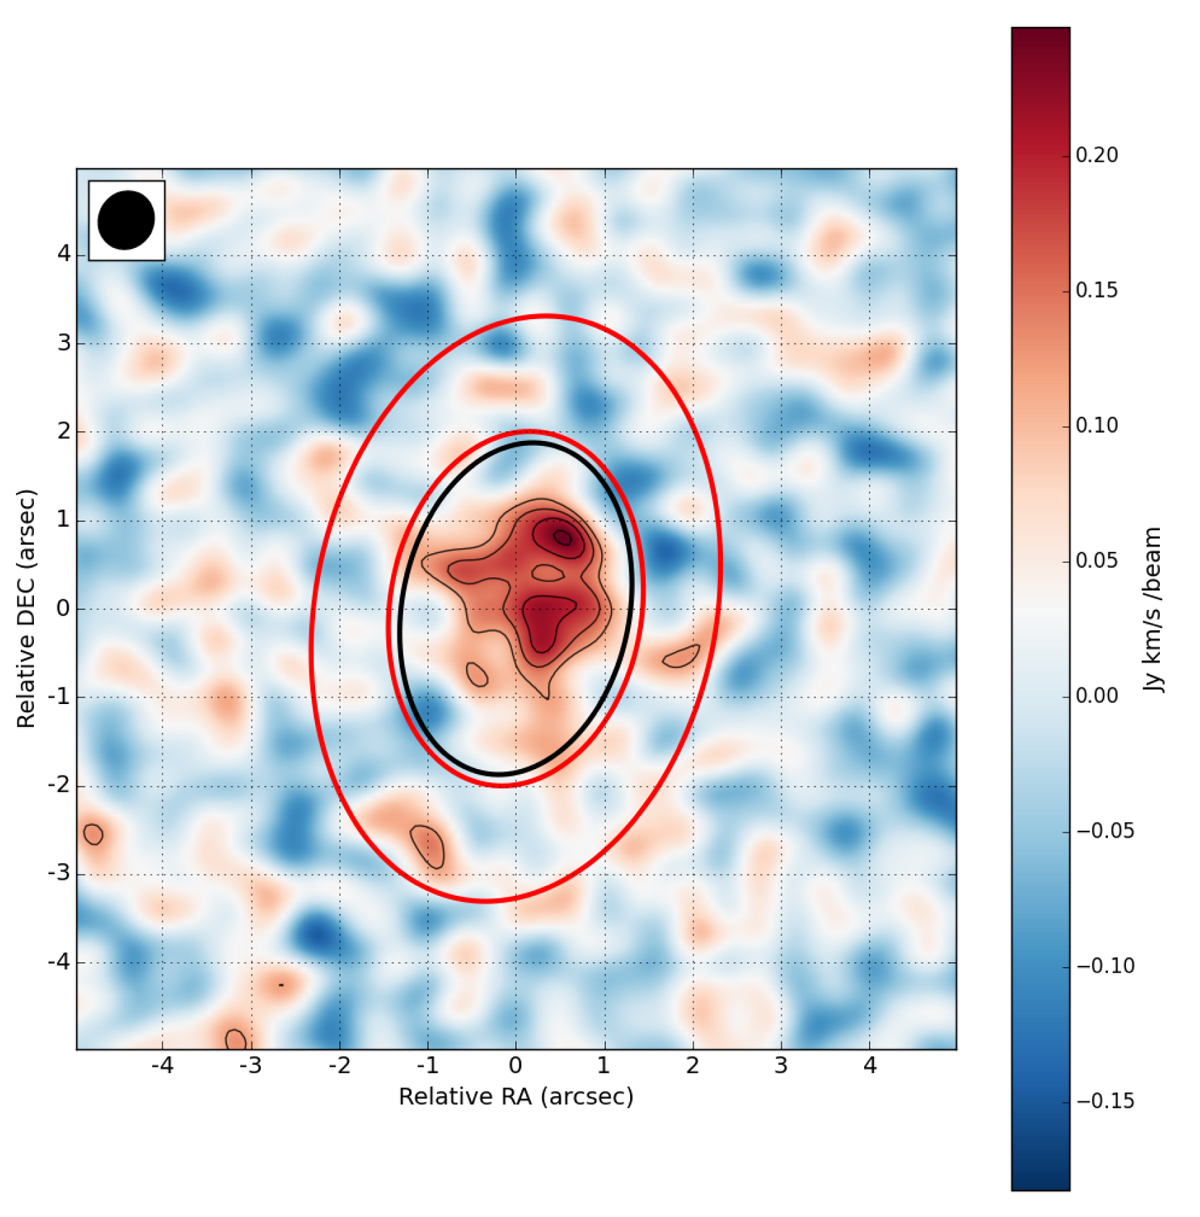
13CO emission is shown in the colour map and contoured at levels of (3,4,5,6)×σ13, with σ13=0.040 Jy km s−1 beam−1. The red ellipses show the position of the HST rings with parameters from Biller et al. (2015). The black ellipse shows the location of the mm ring detected in the 1.3 mm continuum image.
Current usage metrics show cumulative count of Article Views (full-text article views including HTML views, PDF and ePub downloads, according to the available data) and Abstracts Views on Vision4Press platform.
Data correspond to usage on the plateform after 2015. The current usage metrics is available 48-96 hours after online publication and is updated daily on week days.
Initial download of the metrics may take a while.