Fig. 1.
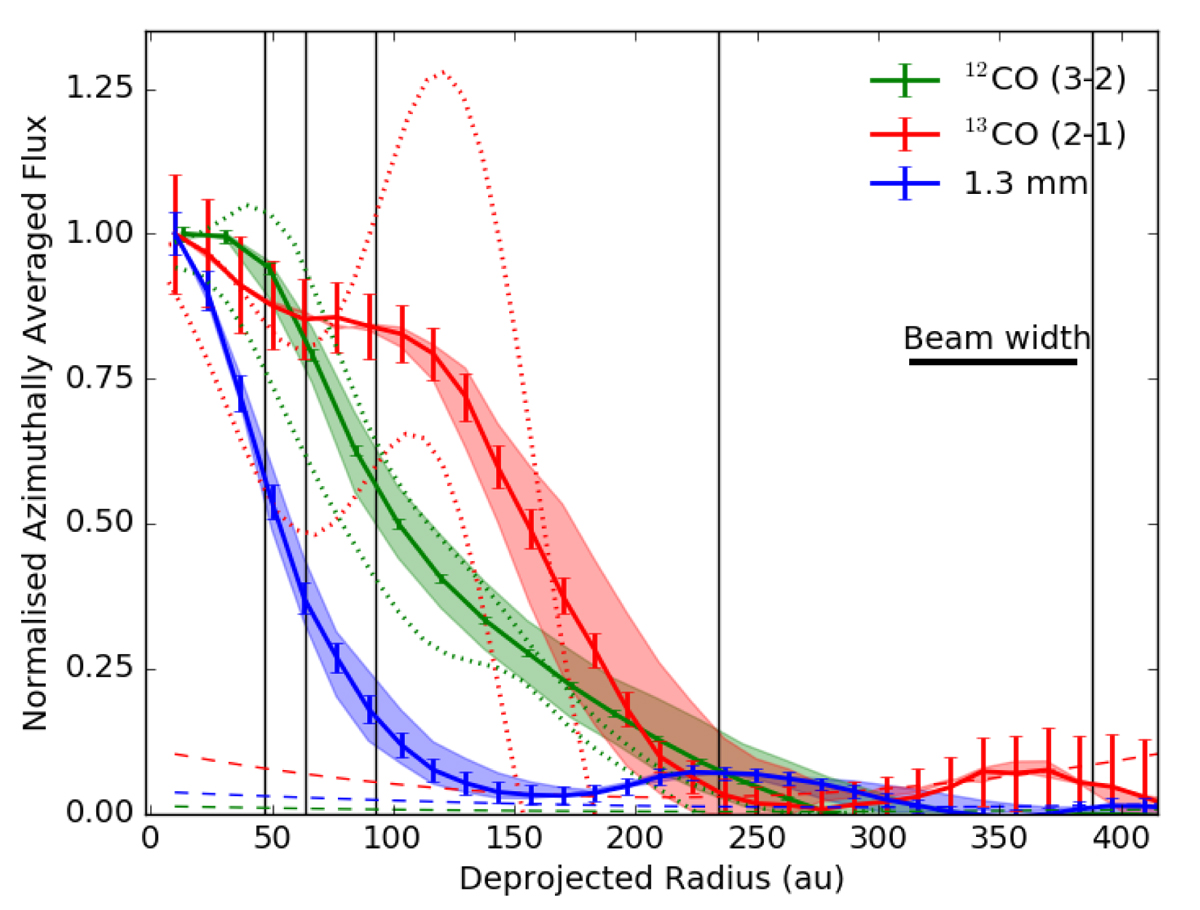
Azimuthally averaged flux profile following the deprojection of coordinates from the 1.3 mm image of HD 141569 (blue), 12CO (green) and 13CO (red). Vertical black lines show the radial locations of rings identified in scattered light. Peak intensities for 1.3 mm continuum, 12CO and 13CO are 1.74 mJy beam−1, 1.06 and 0.25 Jy km s−1 beam−1 respectively. Coloured dotted lines show NW (upper) and SE (lower) cuts of the 12CO and 13CO maps along the position angle of the 13CO peak. The shaded regions show the variation of the profile when changing inclination of the source by ±10°. Error bars are calculated as described in the text, the coloured dashed lines represent the noise level after averaging for each curve.
Current usage metrics show cumulative count of Article Views (full-text article views including HTML views, PDF and ePub downloads, according to the available data) and Abstracts Views on Vision4Press platform.
Data correspond to usage on the plateform after 2015. The current usage metrics is available 48-96 hours after online publication and is updated daily on week days.
Initial download of the metrics may take a while.