| Issue |
A&A
Volume 615, July 2018
|
|
|---|---|---|
| Article Number | L6 | |
| Number of page(s) | 5 | |
| Section | Letters to the Editor | |
| DOI | https://doi.org/10.1051/0004-6361/201833264 | |
| Published online | 19 July 2018 | |
Letter to the Editor
Effect of rotational excitation of H2 on isotopic exchange reaction with OD− at low temperatures
Department of Surface and Plasma Science, Faculty of Mathematics and Physics, Charles University, V Holešovičkách 2, 180 00 Prague, Czech Republic
e-mail: This email address is being protected from spambots. You need JavaScript enabled to view it.
Received:
19
April
2018
Accepted:
21
May
2018
Abstract
Aims. This paper presents experimentally obtained rate coefficients for the weakly endothermic reaction OD− + H2 → OH− + HD with ortho- and para-hydrogen at astrophysically relevant temperatures between 10 and 300 K.
Methods. The reaction was studied with normal and para-enriched (99.5% para-H2) hydrogen in a 22-pole ion trap. The measured temperature dependencies of reaction rate coefficients are analyzed using a model which assumes that the rotational energies of the two reactants are equivalent to the translational energy in driving the reaction.
Results. At room temperature, the rate coefficients of reactions with both nuclear spin variants reach 7 × 10⁻¹¹ cm3 s−1, which is in good agreement with the previous results from ion trap and swarm experiments with normal hydrogen. Cooling down the trap slows down the reaction and leads, at a nominal trap temperature of 11 K, to a rate coefficient below 10−14 cm3 s−1 for para-enriched hydrogen. The fitted reaction endothermicity of 25.3 ± 2.2 meV agrees well with the literature value calculated in the Born-Oppenheimer approximation, ΔH0 = 24.0 meV. A simpler evaluation procedure, fitting the data with Arrhenius functions, results in pk = 16.8 × 10⁻¹¹ exp(−234 K/T) cm3 s−1 for pure para-hydrogen and ok = 9.4 × 10⁻¹¹ exp(−101 K/T) cm3 s−1 for pure orthohydrogen.
Key words: astrochemistry / molecular data / molecular processes / methods: laboratory: molecular / ISM: molecules
© ESO 2018
1. Introduction
In the present study we investigate the weakly endothermic H/D exchange reaction (1)
(1)
Isotope exchange between different molecules is always nearly thermoneutral; however, due to differences in zero-point energies of the reactants and the products, endothermicities or exothermicities of some tens of meV are obtained. Hence, rate coefficients for H/D exchange tend to be very sensitive to temperatures between 10 and 1000 K, which are typical for the interstellar medium. One consequence is that deuterated molecular species are important tracers for the physical conditions prevailing in the interstellar medium (Roberts & Millar 2000). For example, observations of deuteration have been used, in combination with chemical models, to explore the origin of solar-system molecules (Cleeves et al. 2014b), to constrain the ionization rates in protoplanetary disks (Miettinen et al. 2011; Cleeves et al. 2014a), or to measure the age of prestellar cores (Pagani et al. 2013). The observations of the H/D ratios in molecules are generally concentrating on cations or neutrals, while not much is known about deuteration of anions. Negatively charged ions have recently been observed in space (McCarthy et al. 2006; Cernicharo et al. 2007; Brünken et al. 2007), and their role is increasingly more frequently investigated using astrochemical networks (Walsh et al. 2009; McElroy et al. 2013). In particular, UMIST-based models (McElroy et al. 2013) predict that OH− ions are present in cold dark clouds in quantities comparable to its positive counterpart, OH+. While OH and OH+ are routinely observed (see, e.g., Gerin et al. 2010; Wampfler et al. 2010), OH− is still just a candidate for detection in space (Cazzoli & Puzzarini 2006).
The importance of the OH− ion is underlined by a number of recent laboratory and theoretical studies of its destruction (Hlavenka et al. 2009; Hauser et al. 2015a), formation (Jusko et al. 2015; Plašil et al. 2017), inelastic collisions (Hauser et al. 2015b), or its rotational spectrum (Cazzoli & Puzzarini 2006; Matsushima et al. 2006; Jusko et al. 2014; Lee et al. 2016). Additionally, the OH− anion has become a tool for thermometry of ions in ion traps (Otto et al. 2013; Endres et al. 2017) and storage rings (DESIREE, Schmidt et al. 2017; CSR, Meyer et al. 2017), based on threshold photodetachment spectroscopy.
This work presents rate coefficients measured for reaction (1) with normal and para-enriched H2 at trap temperatures ranging from 10 to 300 K. Previous studies, performed at room temperature (Grabowski et al. 1983) or in the ranges of 10–300 K (Mulin et al. 2015) and 300–508 K (Viggiano & Morris 1994), used only normal H2. Experimental determination of state-specific rate coefficients for and 1 is essential because the reactivity is highly sensitive to the internal excitation of the reactants. Moreover, the interstellar ortho-/para-H2 population is often far from thermal equilibrium.
To compare internal excitation with the endothermicity, Fig. 1 shows the lowest rotational states of the involved diatomic molecules. The nuclear spin states I = 0 (para) and 1 (ortho) are linked to the even and odd rotational states, respectively. The 0 K reaction enthalpy of 24 meV was calculated in the Born-Oppenheimer approximation, as discussed in detail by Mulin et al. (2015). At meV accuracy, the energetics are influenced by isotopic electronic shifts of the potential energy surfaces of OD− and OH−, as shown for several other isotope exchange reactions with H2 and D2 (Kleinman & Wolfsberg 1973, 1974; Adohi-Krou et al. 2004). In particular, spectroscopic studies of OH and OD neutrals suggest that the isotopic shift of electronic ground-state potential energy surface in this system can be up to 2.5 meV (see note 78 in Ruscic et al. 2002). We here also derive an experimental value of the reaction endothermicity.
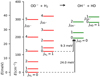 |
Fig. 1. Rotational energy levels of the reactants (left-hand side) and products (right-hand side) for reaction (1). The rotational constants for OD−, OH−, HD, and H2 are taken from the literature (Huber & Herzberg 1979; Rehfuss et al. 1986; Matsushima et al. 2006). The two arrows indicate that 24.0 meV of translational energy are needed to reach the threshold at 0, while 9.3 meV are sufficient for reaction with ortho-H2 |

2. Experiment
The experiments have been carried out using the RF 22-pole ion trap machine described by Gerlich (1995, 2008) and Zymak et al. (2011). This instrument has been used to study isotope effects in anion–neutral reactions (Mulin et al. 2015; Roučka et al. 2015; Plašil et al. 2017), therefore we only recall a few specific details. The 22-pole trap was operated at an RF frequency of 17.4 MHz and at amplitudes up to 60 V. The nominal trap temperature (T22PT) was varied from 300 K down to 10 K.
OD− ions were produced in an electron impact storage ion source (SIS) using a mixture of N2O and D2 (Jusko et al. 2013, 2014). They were extracted from the source, mass selected by a quadrupole mass filter, and guided into the ion trap, where reactions with H2 were followed as a function of time and H2 number density. A He/H2 gas mixture was introduced directly into the trap volume. After various well-defined trapping times, the trap was opened and ions were extracted, mass selected by a second quadrupole mass spectrometer, and counted by an MCP detector. The numbers of detected ions were proportional to the numbers of trapped ions, and minor differences in the overall detection efficiency for OD− and OH− were accounted for in the data analysis.
The addition of helium buffer gas ensures that most of the ions are collisionally thermalized before reacting with H2. Typically used He/H2 mixtures result in ten collisions with He for every one collision with H2 on average. Moreover, at low temperatures, H2 molecules also act as a buffer gas because of the low probability for a reactive collision. Recent experiments in our apparatus (Plašil et al. 2012; Zymak et al. 2013) as well as in other 22-pole trap experiments (Hauser et al. 2015b; Endres et al. 2017) have confirmed that the collisional temperature is slightly higher than the temperature of the trap. In the present case we can safely assume that the collisional temperature in interaction of OD− with H2 does not exceed the trap temperature by more than 10 K. For simplicity of presentation, we define the collisional temperature as T = T22PT + 5 K with an uncertainty of ±5 K.
We used normal hydrogen (nH2) and para-enriched hydrogen (eH2) as reactants, with number densities varying from 1012 up to 1013 cm−3. In normal H2, the para/ortho ratio is 1/3, corresponding to the 300 thermal equilibrium. The para-enriched hydrogen, containing 99.5% of para-H2, was produced using a para-hydrogen generator with paramagnetic catalyst (Hejduk et al. 2012; Dohnal et al. 2012; Zymak et al. 2013). The amount of ortho impurities was determined in situ using chemical probing with N+ ions (Zymak et al. 2013). The nuclear spin-state-specific rate coefficients pk1 and ok1 for the reaction of OD− with para- and ortho-H2 were then calculated from the measured rate coefficients nk1 and ek1 for the reaction with nH2 and with eH2.
To evaluate the measured time dependencies, especially at low temperatures, we have to take into account reconversion of OH− products back to OD− via the fast exothermic reaction (Mulin et al. 2015) (2)
(2)
The D2 traces in the trap originate from the ion source. Equilibrium between this backward reconversion reaction and reaction (1) is established at long enough trapping times.
3. Results and discussion
The change in numbers of detected OD− and OH− ions in the trap can be described with the balance equations (3)
(3)
 (4)
(4)
where k1 and k2 are the rate coefficients of reactions (1) and (2), and [H2] and [D2] are the number densities of H2 and D2 in the trap, respectively. The factor ξ, which is close to 1, accounts for the detection efficiency of OD− relative to OH−. In the following, the additional index n and e is used, that is, nki and eki, to indicate reactions with nH2 and eH2, respectively. The reaction rate coefficients are determined by fitting the measured time dependencies of the numbers of detected ions,  and
and  , with solution of Eqs. (3) and (4). Free parameters of the fit are the reaction rates r1 = k1[H2] and r2 = k2[D2], the initial numbers of detected ions,
  and
and  , and the relative detection efficiency ξ.
Examples of measured and fitted time dependencies are plotted in Fig. 2. For clarity, the numbers are normalized by the total number of ions, NΣ, measured directly after filling the trap. The upper panel of Fig. 2 shows data obtained with nH2 as target gas, and the lower panel those for eH2. The corresponding densities of nH2, eH2, He, and D2 in the trap are listed in Table 1. The density of D2 penetrating from the ion source is typically 1000 times lower than that of H2. Nevertheless, the equilibrium numbers of OD− are comparable to or even higher than those of OH− at the lowest temperatures because of the very slow forward reaction and the fast backward reconversion reaction. The effect of backward reconversion is even more pronounced for a reaction with para-enriched H2. The dependence of the reaction rate r1 on the hydrogen number density was measured to be linear, confirming the binary character of reaction (1).
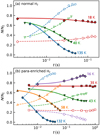 |
Fig. 2. Time dependencies of the normalized numbers of OD− (filled symbols) and OH− (open symbols), measured with nH2 (panel a) and eH2 (panel b). The collisional temperatures are indicated in the figure, and the densities of nH2, eH2, He, and D2 are listed in Table 1. |
Figure 3 compares the rate coefficients, nk1 and ek1, measured between 15 and 300 with previous results for nk1 from the same experimental arrangement (Mulin et al. 2015; shown as a function of collisional temperature, T = T22PT + 5 K). The agreement is very good (within a few percent). We also show results from the FDT experiment of Viggiano & Morris (1994) and the SIFT experiment of Grabowski et al. (1983). The data we present were simplified by binning the results of nearly 300 measurements into logarithmically spaced bins in temperature. The indicated uncertainties of the reaction rate coefficients take into account the estimated fit errors and the 5 uncertainty of the collisional temperature, which also influences the reactant number density. The uncertainty due to pressure measurement is 20%.
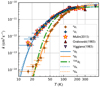 |
Fig. 3. Temperature dependencies of the rate coefficients, nk1 and ek1, measured for reaction (1) with nH2 and with eH2. We also plot data obtained in our previous experiments with nH2 using the same experimental arrangement (Mulin et al. 2015), FDT data of Viggiano & Morris (1994), and SIFT data of Grabowski et al. (1983). The solid and dotted lines show the result of a state-specific model and an Arrhenius model, respectively. For details, see the text. The dash-dotted line indicates the thermal rate coefficient, i.e., the ortho/para ratio is also equilibrated to T. |
The Arrhenius plot of the measured reaction rate coefficients shown in Fig. 4 reveals a nearly linear dependence of nk1 and ek1 over two and three orders of magnitude, respectively. The deviations from linearity for temperatures below 25 are smaller than the estimated temperature uncertainty of ±5 K.
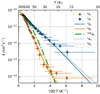 |
Fig. 4. Arrhenius plot of ek1 and nk1 measured in experiments with eH2 and nH2. The solid and dotted lines show the results from a state-specific model and an Arrhenius model, respectively. The dash-dotted line shows the fully thermalized rate coefficients. For details, see the text. |
We analyzed our data using the simple statistical model described by Mulin et al. (2015), which takes into account any non-equilibrium population of H2 rotational states. Generally, the rate coefficient k1 of reaction (1) can be expressed as a weighted sum kΣ of state-specific rate coefficients  , averaged over the rotational states
  and
and  of H2 and OD−. In particular, we define rate coefficients
  and
and  for reaction with normal and para-enriched H2 as
 (5)
(5)
where  and
and  are the corresponding populations of rotational states. Our model uses the assumption that all state-specific rate coefficients follow the Arrhenius temperature dependence
 (6)
(6)
with the activation energy given by (7)
(7)
The model assumes that both the rotational energy of  and
and  and the translational energy are equivalent in driving the reaction. In Eq. (6) we also assume that there is a global preexponential factor pk0 for reactions with para-H2 (
 even) and ok0 for all reactions of ortho-H2 (
 odd). The only free parameters of the model are the reaction endoergicity
  and the pre-exponential factors pk0 and ok0. The model was fitted globally to both temperature dependencies of rate coefficients of reactions with ortho- and para-H2, resulting in
These mean values were obtained from fits corresponding to the collisional temperature T = T22PT + 5 K. The quoted uncertainties include the statistical errors and the systematic errors due to temperature uncertainty, which were estimated by fitting the data with collisional temperatures defined as T− = T22PT and T+ = T22PT + 10 K. The pre-exponential factors pk0 and ok0 have additional uncertainty of 20 % due to the uncertainty of the pressure. The fitted curves are included in Figs. 3 and 4.
The true thermal reaction rate coefficient TDEkΣ plotted in Figs. 3 and 4 was derived from our model by inserting the equilibrium population of all H2 rotational states,  , into Eq. (5), that is, also assuming equilibrium ortho/para population.
To facilitate the incorporation of our data into chemical models, we also fit our data with the simple Arrhenius model, described by the equation (8)
(8)
where n/ef = [oH2]/[n/eH2] is the fraction of ortho-H2 in the normal/para-enriched H2 and (9)
(9)
The agreement of the fit with our data (Fig. 4) indicates that the linear combination of Arrhenius dependencies (8) is a good approximation. The resulting parameters are
The errors were estimated by the same procedure as discussed above for the state-specific model parameters.
The fitted endothermicity  is in good agreement with the value ΔH0 = 24.0 meV discussed in the Introduction. This confirms that the isotopic energy shifts are not significantly larger than our experimental accuracy (≈ 2.5 meV). The discrepancy between the Arrhenius activation energy pEA and the endothermicities
  and ΔH0 is not surprising because pEA is an empirical parameter that does not account for the internal excitation of the reactants. Nevertheless, the activation energy oEA of the reaction with ortho-H2 is in good agreement with the Born-Oppenheimer estimate of 9.3 meV. It is also in agreement with the activation energy of reaction with normal H2, EA-exp = (7.9 ± 0.3) meV determined by Mulin et al. (2015), which confirms that reaction with ortho-H2 was the dominant process in that experiment.
4. Conclusions
We have extended our previous measurements (Mulin et al. 2015) of the isotope exchange reaction between OD− and H2 using nearly pure para-hydrogen. The data allowed us to extract nuclear-spin specific rate coefficients at temperatures from 15 to 300. As expected, the two results are equal at room temperature and agree well with previous data (Viggiano & Morris 1994; Grabowski et al. 1983). Over a wide range of temperatures, the rate coefficients fall with decreasing temperature in accordance with the Arrhenius formula. For astrochemical models, reactions with pure para- or ortho-H2 can be simply characterized with Arrhenius functions pk = 16.8 × 10⁻¹¹ exp(−234 K/T) cm3 s−1 and ok = 9.4 × 10⁻¹¹ exp(−101 K/T) cm3 s−1, respectively.
Acknowledgments
This work was partly supported by the Czech Grant Agency GACR 17-19459S and by the Charles University (GAUK 1584217, 1144616, 1168216). We thank the Chemnitz University of Technology and the DFG for lending the 22-pole trap instrument to the Charles University.
References
- Adohi-Krou, A., Martin, F., Ross, A. J., Linton, C., & Le Roy, R. J. 2004, J. Chem. Phys., 121, 6309 [NASA ADS] [CrossRef] [Google Scholar]
- Brünken, S., Gupta, H., Gottlieb, C. A., McCarthy, M. C., & Thaddeus, P. 2007, ApJ, 664, L43 [NASA ADS] [CrossRef] [Google Scholar]
- Cazzoli, G. & Puzzarini, C. 2006, ApJ, 648, L79 [NASA ADS] [CrossRef] [Google Scholar]
- Cernicharo, J., Guélin, M., Agúndez, M., et al. 2007, A&A, 467, L37 [NASA ADS] [CrossRef] [EDP Sciences] [Google Scholar]
- Cleeves, L. I., Bergin, E. A., & Adams, F. C. 2014a, ApJ, 794, 123 [NASA ADS] [CrossRef] [Google Scholar]
- Cleeves, L. I., Bergin, E. A., Alexander, C. M. O., et al. 2014b, Science, 345, 1590 [NASA ADS] [CrossRef] [Google Scholar]
- Dohnal, P., Hejduk, M., Varju, J., et al. 2012, Phil. Trans. R. Soc. A, 370, 5101 [NASA ADS] [CrossRef] [Google Scholar]
- Endres, E. S., Egger, G., Lee, S., et al. 2017, J. Mol. Spectr., 332, 134 [Google Scholar]
- Gerin, M., De Luca, M., Black, J., et al. 2010, A&A, 518, L110 [NASA ADS] [CrossRef] [EDP Sciences] [Google Scholar]
- Gerlich, D. 1995, Phys Scr., 1995, 256 [NASA ADS] [CrossRef] [Google Scholar]
- Gerlich, D. 2008, Low Temperatures and Cold Molecules (London: Imperial College Press) [Google Scholar]
- Grabowski, J. J., DePuy, C. H., & Bierbaum, V. M. 1983, J. Am. Chem. Soc., 105, 2565 [CrossRef] [Google Scholar]
- Hauser, D., Lakhmanskaya, O., Lee, S., Roučka, Š., & Wester, R. 2015a, New J. Phys. [Google Scholar]
- Hauser, D., Lee, S., Carelli, F., et al. 2015b, Nat. Phys., 11, 467 [NASA ADS] [CrossRef] [Google Scholar]
- Hejduk, M., Dohnal, P., Varju, J., et al. 2012, Plasma Sources Sci. Technol., 21, 024002 [Google Scholar]
- Hlavenka, P., Otto, R., Trippel, S., et al. 2009, J. Chem. Phys., 130, 061105 [NASA ADS] [CrossRef] [Google Scholar]
- Huber, K. P., & Herzberg, G. 1979, Molecular Spectra and Molecular Structure: Constants of Diatomic Molecules (New York: Van Nostrand Reinhold) [Google Scholar]
- Jusko, P., Roučka, Š., Plašil, R., & Glosík, J. 2013, Int. J. Mass Spectrom., 352, 19 [CrossRef] [Google Scholar]
- Jusko, P., Asvany, O., Wallerstein, A.-C., Brünken, S., & Schlemmer, S. 2014, Phys. Rev. Lett., 112, 253005 [NASA ADS] [CrossRef] [PubMed] [Google Scholar]
- Jusko, P., Roučka, Š., Mulin, D., et al. 2015, J. Chem. Phys., 142, 014304 [NASA ADS] [CrossRef] [PubMed] [Google Scholar]
- Kleinman, L. I., & Wolfsberg, M. 1973, J. Chem. Phys., 59, 2043 [NASA ADS] [CrossRef] [Google Scholar]
- Kleinman, L. I., & Wolfsberg, M. 1974, J. Chem. Phys., 60, 4740 [NASA ADS] [CrossRef] [Google Scholar]
- Lee, S., Hauser, D., Lakhmanskaya, O., et al. 2016, Phys. Rev. A, 93, 032513 [NASA ADS] [CrossRef] [Google Scholar]
- Matsushima, F., Yonezu, T., Okabe, T., Tomaru, K., & Moriwaki, Y. 2006, J. Mol. Spectrosc., 235, 261 [NASA ADS] [CrossRef] [Google Scholar]
- McCarthy, M. C., Gottlieb, C. A., Gupta, H., & Thaddeus, P. 2006, ApJ, 652, L141 [NASA ADS] [CrossRef] [Google Scholar]
- McElroy, D., Walsh, C., Markwick, A. J., et al. 2013, A&A, 550, A36 [NASA ADS] [CrossRef] [EDP Sciences] [Google Scholar]
- Meyer, C., Becker, A., Blaum, K., et al. 2017, Phys. Rev. Lett., 119, 023202 [NASA ADS] [CrossRef] [Google Scholar]
- Miettinen, O., Hennemann, M., & Linz, H. 2011, A&A, 534, A134 [NASA ADS] [CrossRef] [EDP Sciences] [Google Scholar]
- Mulin, D., Roučka, Š., Jusko, P., et al. 2015, Phys. Chem. Chem. Phys., 17, 8732 [CrossRef] [Google Scholar]
- Otto, R., von Zastrow, A., Best, T., & Wester, R. 2013, Phys. Chem. Chem. Phys., 15, 612 [CrossRef] [Google Scholar]
- Pagani, L., Lesaffre, P., Jorfi, M., et al. 2013, A&A, 551, A38 [NASA ADS] [CrossRef] [EDP Sciences] [Google Scholar]
- Plašil, R., Zymak, I., Jusko, P., et al. 2012, Phil. Trans. R. Soc. A, 370, 5066 [Google Scholar]
- Plašil, R., Tran, T. D., Roučka, Š., et al. 2017, Phys. Rev. A, 96, 062703 [CrossRef] [Google Scholar]
- Rehfuss, B. D., Crofton, M. W., & Oka, T. 1986, J. Phys. Phys., 85, 1785 [Google Scholar]
- Roberts, H., & Millar, T. J. 2000, A&A, 361, 388 [NASA ADS] [Google Scholar]
- Roučka, Š., Mulin, D., Jusko, P., et al. 2015, J. Phys. Chem. Lett., 6, 4762 [CrossRef] [Google Scholar]
- Ruscic, B., Wagner, A. F., Harding, L. B., et al. 2002, J. Phys. Chem. A, 106, 2727 [CrossRef] [Google Scholar]
- Schmidt, H. T., Eklund, G., Chartkunchand, K. C., et al. 2017, Phys. Rev. Lett., 119, 073001 [CrossRef] [Google Scholar]
- Viggiano, A. A., & Morris, R. A. 1994, J. Chem. Phys., 100, 2748 [CrossRef] [Google Scholar]
- Walsh, C., Harada, N., Herbst, E., & Millar, T. J. 2009, ApJ, 700, 752 [NASA ADS] [CrossRef] [Google Scholar]
- Wampfler, S. F., Herczeg, G. J., Bruderer, S., et al. 2010, A&A, 521, L36 [NASA ADS] [CrossRef] [EDP Sciences] [Google Scholar]
- Zymak, I., Jusko, P., Roučka, Š., et al. 2011, Eur. Phys. J. Appl. Phys., 56, 24010 [CrossRef] [EDP Sciences] [Google Scholar]
- Zymak, I., Hejduk, M., Mulin, D., et al. 2013, ApJ, 768, 86 [NASA ADS] [CrossRef] [Google Scholar]
All Tables
All Figures
|
Fig. 1. Rotational energy levels of the reactants (left-hand side) and products (right-hand side) for reaction (1). The rotational constants for OD−, OH−, HD, and H2 are taken from the literature (Huber & Herzberg 1979; Rehfuss et al. 1986; Matsushima et al. 2006). The two arrows indicate that 24.0 meV of translational energy are needed to reach the threshold at 0, while 9.3 meV are sufficient for reaction with ortho-H2 |
| In the text | |
|
Fig. 2. Time dependencies of the normalized numbers of OD− (filled symbols) and OH− (open symbols), measured with nH2 (panel a) and eH2 (panel b). The collisional temperatures are indicated in the figure, and the densities of nH2, eH2, He, and D2 are listed in Table 1. |
| In the text | |
|
Fig. 3. Temperature dependencies of the rate coefficients, nk1 and ek1, measured for reaction (1) with nH2 and with eH2. We also plot data obtained in our previous experiments with nH2 using the same experimental arrangement (Mulin et al. 2015), FDT data of Viggiano & Morris (1994), and SIFT data of Grabowski et al. (1983). The solid and dotted lines show the result of a state-specific model and an Arrhenius model, respectively. For details, see the text. The dash-dotted line indicates the thermal rate coefficient, i.e., the ortho/para ratio is also equilibrated to T. |
| In the text | |
|
Fig. 4. Arrhenius plot of ek1 and nk1 measured in experiments with eH2 and nH2. The solid and dotted lines show the results from a state-specific model and an Arrhenius model, respectively. The dash-dotted line shows the fully thermalized rate coefficients. For details, see the text. |
| In the text | |
Current usage metrics show cumulative count of Article Views (full-text article views including HTML views, PDF and ePub downloads, according to the available data) and Abstracts Views on Vision4Press platform.
Data correspond to usage on the plateform after 2015. The current usage metrics is available 48-96 hours after online publication and is updated daily on week days.
Initial download of the metrics may take a while.