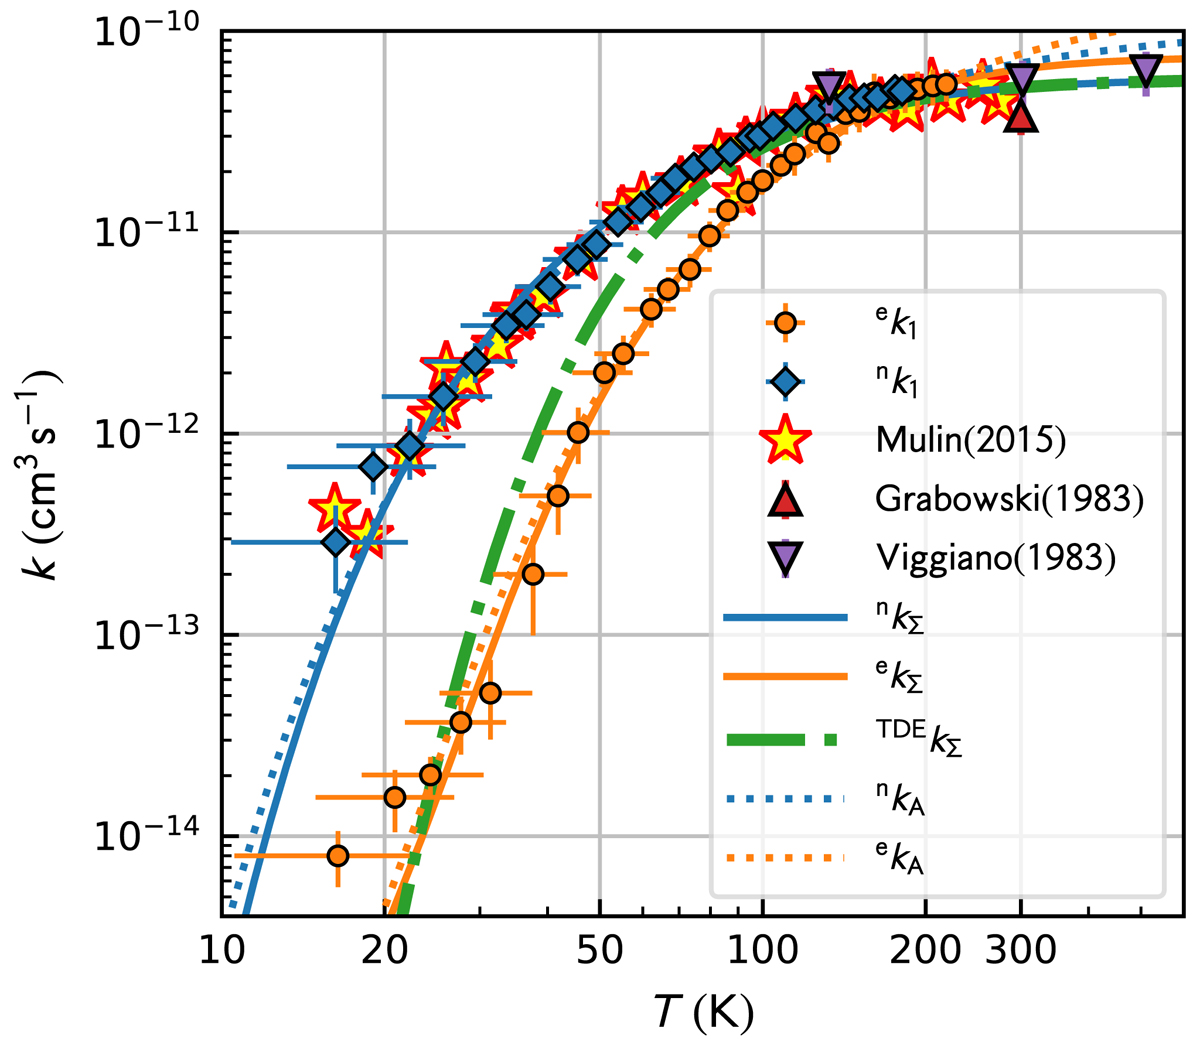
Fig. 3.
Temperature dependencies of the rate coefficients, nk1 and ek1, measured for reaction (1) with nH2 and with eH2. We also plot data obtained in our previous experiments with nH2 using the same experimental arrangement (Mulin et al. 2015), FDT data of Viggiano & Morris (1994), and SIFT data of Grabowski et al. (1983). The solid and dotted lines show the result of a state-specific model and an Arrhenius model, respectively. For details, see the text. The dash-dotted line indicates the thermal rate coefficient, i.e., the ortho/para ratio is also equilibrated to T.
Current usage metrics show cumulative count of Article Views (full-text article views including HTML views, PDF and ePub downloads, according to the available data) and Abstracts Views on Vision4Press platform.
Data correspond to usage on the plateform after 2015. The current usage metrics is available 48-96 hours after online publication and is updated daily on week days.
Initial download of the metrics may take a while.