Free Access
Fig. 4.
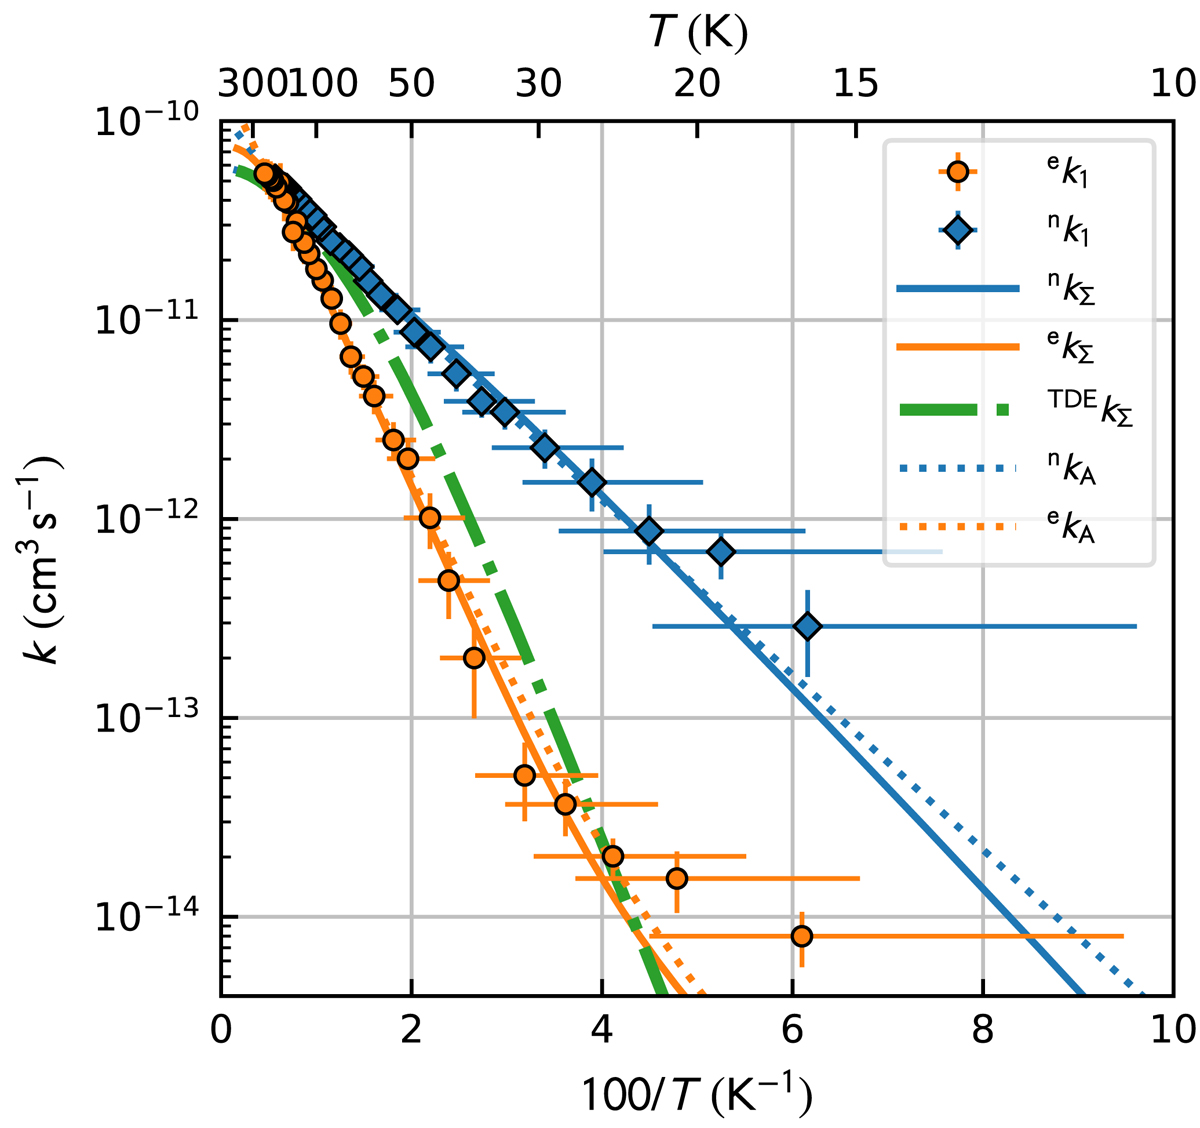
Arrhenius plot of ek1 and nk1 measured in experiments with eH2 and nH2. The solid and dotted lines show the results from a state-specific model and an Arrhenius model, respectively. The dash-dotted line shows the fully thermalized rate coefficients. For details, see the text.
Current usage metrics show cumulative count of Article Views (full-text article views including HTML views, PDF and ePub downloads, according to the available data) and Abstracts Views on Vision4Press platform.
Data correspond to usage on the plateform after 2015. The current usage metrics is available 48-96 hours after online publication and is updated daily on week days.
Initial download of the metrics may take a while.