| Issue |
A&A
Volume 615, July 2018
|
|
|---|---|---|
| Article Number | A118 | |
| Number of page(s) | 5 | |
| Section | Astrophysical processes | |
| DOI | https://doi.org/10.1051/0004-6361/201732550 | |
| Published online | 24 July 2018 | |
Quasi-periodicities of BL Lacertae objects
1
Università dell’Insubria, Dipartimento di Scienza ed Alta Tecnologia,
Via Valleggio 11,
22100
Como, Italy
e-mail: asandrinelli@yahoo.it
2
INAF-Istituto Nazionale di Astrofisica, Osservatorio Astronomico di Brera,
Via Bianchi 46,
23807
Merate (LC), Italy
3
Department of Astronomy and National Center for Supercomputing Applications, University of Illinois at Urbana-Champaign,
Urbana, IL
61801, USA
4
School of Physics and Astronomy and Institute of Gravitational Wave Astronomy, University of Birmingham,
Edgbaston B15 2TT, UK
5
Tuorla Observatory, Department of Physics and Astronomy, University of Turku, Turku, Finland
Received:
26
December
2017
Accepted:
18
January
2018
We review the reports of possible year-long quasi-periodicities of BL Lac objects in the γ-ray and optical bands, and present a homogeneous time analysis of the light curves of PKS2155−304, PG1553+113, and BL Lac. Based on results from a survey covering the entire Fermi γ-ray sky we have estimated the fraction of possible quasi-periodic BL Lac objects. We compared the cyclical behaviour in BL Lac objects with that derived from the search of possible optical periodicities in quasars, and find that at z ≲ 1 the cosmic density of quasi-periodic BL Lac objects is larger than that of quasi-periodic quasars. If the BL Lac quasi-periodicities were due to a supermassive binary black hole (SBBH) scenario, there could be a tension with the upper limits on the gravitational wave background measured by the pulsar timing array. The argument clearly indicates the difficulties of generally associating quasi-periodicities of BL Lac objects with SBBHs.
Key words: gamma rays: galaxies / gamma rays: general / BL Lacertae objects: general / galaxies: active / galaxies: jets
© ESO 2018
1 Introduction
Objects known as BL Lac are active galactic nuclei characterized by high variability, large polarization, and weakness of emission lines (e.g. Falomo et al. 2014; Madejski & Sikora 2016; Padovani et al. 2017). They are generally interpreted as systems in which a relativistic jet is pointing towards the observer direction. The jet emission dominates over other components, such as, for example, the thermal flux of the accretion disk. Their variability is observed at all wavelengths, and on timescales ranging from a few seconds to years. Searches for quasi-periodicities initially focused on the optical and X-ray bands yielding controversial results, the best known being the proposal of a 12 yr periodicity for OJ 287 (Sillanpää et al. 1988; Lehto & Valtonen 1996). The situation has evolved in the last decade, because of the continuous monitoring of the γ-ray sky by the Fermi mission, which demonstrated that BL Lac objects are the dominant component of the extragalactic sky, and was able to construct light curves of the brightest BL Lacs, which have typical integration times of weeks. The optical monitoring of BL Lacs was also much increased, as a result of the diffusion of robotic telescopes.
In 2014, we began a search for periodicities in the Fermi γ-ray light curves of bright BL Lac objects. We found some evidence (Sandrinelli et al. 2014a) of a quasi-periodic oscillation of T ~ 630 days in PKS2155−304 (z = 0.116), corresponding to twice the optical period originally proposed by Zhang et al. (2014). The indication of both γ-ray and optical periods was confirmed by Sandrinelli et al. (2016a). A further confirmation of the γ-ray period came from Zhang et al. (2017a). Ackermann et al. (2015) provided evidence of a quasi-periodicity of 2.18 yr in the Fermi light curve of PG1553+113 (z ~ 0.4), with counterparts in the optical and radio. We found (Sandrinelli et al. 2016b, 2017) year-long possible γ-ray and optical correlated quasi-periodicities in PKS0537−441 (z = 0.892) and BL Lac (z = 0.069), corresponding to 0.77 yr and 1.86 yr, respectively. Recently Zhang et al. (2017b) detected a 2.1 yr γ-ray quasi-periodic oscillation in PKS0301−243 (z = 0.260). Most of these results are at a modest statistical significance, yet taken together they represent an interesting sample.
Different methods were used for the search of quasi-periodicities, and for the estimation of their statistical significance. In this paper (Sect.2), we concentrate on the procedure originally described by Vaughan (2005, 2010, see also Guidorzi et al. 2016), which we have already applied to the case of BL Lac (Sandrinelli et al. 2017). We focus on the γ-ray and optical light curves of PKS2155−304, and PG1553+113, in order to achieve a homogeneous analysis of three sources.
As already noted in Covino et al. (2017) and Sandrinelli et al. (2017), indications of year-long quasi-periodicities appear much more frequently in BL Lac objects than in quasars, and in our discussion (Sect. 3) we refer, in particular, to recent results (Sesana et al. 2018), which in the case of quasars may constrain the interpretation of quasi-periodicities as being due to the binary period of a pair of supermassive black holes. The argument is based on the upper limits of the gravitational wave background. We then compare the local densities of quasi-periodic quasars, and BL Lac objects, and concentrate on the interpretation of quasi-periodicities of the latter class.
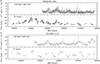 |
Fig. 1 Flux light curves of PKS2155−304 (top panel) and PG1553+113 (bottom panel). Fermi light curves in the 100 MeV–300 GeV energy range (7-day and 20-day binned, respectively) are reported. The combined nightly averaged R-band data are also given. The light curves are not host galaxy subtracted. In the optical light curves error bars are in most cases smaller than symbol size. |
2 The search of quasi-periodicities in PKS2155−304 and PG1553+113
2.1 Light curves
In Fig. 1, we report the optical and γ-ray light curvesof PKS2155-304 and of PG1553+113 (100 MeV–300 GeV, R band). For PKS2155−304 the γ-ray light curve was taken from the Fermi site1 with a one week integration bin. Nightly averaged data points were derived in the R optical band from the Rapid Eye Mounting Telescope photometry (REM2, Zerbi et al. 2004; Covino et al. 2004; Sandrinelli et al. 2014b), and combined with data drawn from the Small & Moderate Aperture Research Telescope System archives (SMARTS3, Bonning et al. 2012), the Tuorla Blazar Monitoring Program4 (Takalo et al. 2008), the Steward Observatory Fermi Blazar Observational Program5 (Smith et al. 2009), and with observations from ROTSE-III and the All Sky Automated Survey robotic telescopes and archival data collected by Kastendieck et al. (2011), securing almost regular coverage. For PG1553+113 the R-light curve is mainly from Tuorla Observatory with some integration from REM. The γ-ray curve, with a binning of 20 days, is from Ackermann et al. (2015) and Cutini et al. (2016), and complemented with data from the Fermi site.
2.2 Search for quasi-periodicities
To search for quasi-periodicities and to assess their significance against the structured (red) noise (e.g. Press 1978; Vaughan 2005), typically present in blazars, we followed the procedure described by Vaughan (2005, 2010), Guidorzi et al. (2016), and Sandrinelli et al. (2017). In short, we used generalized Lomb-Scargle periodograms (e.g. Scargle 1982) to derive the power spectra density (PSD) from the light curves. Because of their lengths (~10–14 yr), we searched for periods ≲1000 days, and limited the noisy high-frequency periodogram end to periods ≥50 days. The frequency-dependent noise was modelled as a simple power law (PL) with the form SPL (f) = Nf−α, or as an auto-regression function of the first order (AR1) described as SAR1(f) = σ2∕(1 − 2acos(2πf) + a2), where N is the normalization, α the power-law index, σ is the white-noise variance, and τ = −1∕ln(a) is the so-called time constant. We sampled the best fitting parameters in a Bayesian framework, where posterior parameter distributions were obtained using Markov chain Monte Carlo techniques. Simulated PSDs were derived and the percentiles of the simulated periodograms computed at each given frequency (single frequency significances). Then we evaluated the probability that the power of any peak is equal to or larger than a chosen value somewhere in the spectrum (global significance, see Vaughan 2010, for a complete discussion). Optical data for the selected objects (which are all fairly bright sources) are typically well sampled, and our datasets were binned in order to minimize the possible effects of irregular sampling. Spurious periodicitiesintroduced by the sampling were studied by analysing periodograms based on the sampling epochs (e.g. VanderPlas 2017). The quality of fits for the PSD modellings were evaluated using a posterior predictive assessment (Gelman et al. 1996). The multiple trial correction due to the unknown number of independent sampled frequencies is included. In fact the same described procedure was applied both to the simulated data and to the real data.
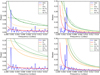 |
Fig. 2 Single-frequency (top panels) and global-frequency (bottom panels) power spectral densities of PKS2155−304. Left panels are related to the 100 MeV–300 GeV Fermi light curve, and right panels to the R-band light curve. Lomb-Scargle spectrum of the input time-series data is given in blue and the best-fit noise spectrum in red. The 95.0% and 99.7% false alarm levels are reported with yellow and green lines. Solid and dashed lines refer to PL and AR1 models, respectively. |
2.3 Results
At first we searched for single frequency significance of Lomb-Scargle peaks in the optical and Fermi light curves for the two sources, PKS2155−304 and PG1553+113, applying PL and AR1 models, as specified in Sect. 2.2. Then we computed the global false-alarm probability. Periodograms are given in Figs. 2 and 3 and refer to the whole length of the corresponding light curve.
After having modelled the noise with the two PL and AR1 functions, for both sources there are peaks with modest global frequency significances (see Table 1). However, the examined cases are of interest because analogous or harmonic-related results were obtained from studying the optical light-curves. For PKS2155−304, peaks at Tγ ~ 620 ± 41 days and Topt ~ 315 ± 25 days are identified, with Tγ ~ 2 ×Topt, confirming previous results in Sandrinelli et al. (2014a, 2016a), found by applying different procedures. The associated uncertainties were calculated by adapting the mean noise power level method of Schwarzenberg-Czerny (1991) to red-noise spectra. The periodograms of PG1553+113 show peaks at the same frequency within the errors, corresponding to Tγ ~ 780± 63 days and Topt1 ~ 810 ± 52 days, similarly to the the quasi-periodic signal found by Ackermann et al. (2015). In this source, higher significances are related to the γ-ray light curve (see Table 1). A second peak in the optical at Topt2 ~ 250 ± 60 days is also apparent. The occurrence of harmonic-related oscillations in the two independent light curves, γ and optical, in one source, and the concurrence of the same period in the two bands for the other one, although individually modest, suggest that the peaks may be related to a real quasi-periodicities, superposed onto chaotic variabilities.
The peaks in the PG1553+113 spectrum at approximately the same frequency in the optical and γ-ray bands appear to be an interesting case, which deserves to be further investigated. To quantify the significance of the detection of the two peaks at the same frequency (T ~ 780–810 days) in the optical and γ-ray bands, the PSDs obtained for the γ-ray and optical data were linearly added and the result was evaluated against a χ2 distribution with 2M degrees of freedom, where M is the number of added PSDs (e.g. Barret & Vaughan 2012; Guidorzi et al. 2016). The derived PSD peaks at T ~ 800 days, but with limited significance, see Table 1.
We note that in the case of PKS2155−304 the significances of the optical and γ-ray quasi-periodicities seem to decrease in recent years. The fading of the major periods may be connected to a decreasing trend of the intensity of the source, as observed in the case of PKS0537-441 (Sandrinelli et al. 2016b).
Considering also the results for BL Lac (see Sandrinelli et al. 2017, and Table 1), the main conclusion of our analysis is that the three sources reveal quasi-periodicities with a moderate yet non-negligible statistical significance. The quasi-periodicities occur at the same frequency in both the optical and γ-rays for BL Lac and PG 1553+113, and at correlated frequencies for PKS2155−304. We note that the peak significances obtained with the procedure adopted in this paper appear modest in comparison with those proposed in the literature and quoted in Sect. 1.
3 Discussion
In this paper, we have reconsidered the search for year-long quasi-periodicities in optical and γ-rays of the two BL Lac sources PKS2155−304 and PG1553+113, using a procedure adapted from the recipes of Vaughan (2005, 2010) and described in our paper on BL Lac (Sandrinelli et al. 2017). Our results confirm the indication of year-like quasi-periodicities in PKS2155−304 and PG1553+113, previously obtained following different numerical schemes (Schulz & Mudelsee 2002; Ackermann et al. 2015). The significances proposed here are lower, because of our specific consideration of the multi-trial correction.
Possible interpretations of BL Lac objects quasi-periodicities have been proposed by Sandrinelli et al. (2014a, 2016a,b, 2017) and by Ackermann et al. (2015), with some modelling by Cavaliere et al. (2017), Sobacchi et al. (2017) and Caproni et al. (2017). The suggested pictures can be distinguished into (i) those in which the quasi-periodicities are interpreted as due to a SBBH system, either directly (e.g. Lehto & Valtonen 1996; Graham et al. 2015), or through some precession process, and(ii) those in which the scenario is instead due to instabilities in the relativistic jet (e.g. Camenzind & Krockenberger 1992; Marscher 2014; Raiteri et al. 2017), or in the accretion disk. The variable significance of the periodic signal, possibly related to the intensity of the source (see Sect. 2.2), or to the noise correlation (e.g. Kelly et al. 2014), does not help us to discriminate between the two scenarios.
In this regard the following consideration seems relevant, which starts from the estimate of the fraction of possible quasi-periodic objects among BL Lacs. We refer in particular to the recent paper by Prokhorov & Moraghan (2017), in which a systematic search for cyclical γ-ray emissions inthe Fermi-LAT sky is presented. They examined 7.8 yr of data and considered photons >300 MeV dividing the sky in 12288 pixels. Searching for periodicities in the 30 days–2.5 yr interval in the all sky they found seven pixels in which some evidence of periodic signal is present. All of these pixels are identified with a blazar, NBLL = 4 are BL Lac objects: PG1553+113, PKS2155−304, BL Lac, and 0716+714. For the first three Prokhorov & Moraghan (2017) confirmed previous quasi-periodic detections (Sandrinelli et al. 2014a; Ackermann et al. 2015; Sandrinelli et al. 2016a, 2017), which are also discussed above in this paper. The case of 0716+714, which Prokhorov & Moraghan (2017) mentioned as a potential quasi-periodic candidate, was previously examined in Fig. 3 of Sandrinelli et al. (2017), who detected the γ-ray period given by Prokhorov & Moraghan (2017), but noticed the absence of quasi-periodicity in the optical band.
In Fig. 4, we report the distribution of mean Fermi γ-ray photon fluxes (>300 MeV) for the N = 1144 sources classified as blazars in the Fermi-LAT third catalogue of γ-ray sources (3FGL, Acero et al. 2015). It is apparent that a significant detection of possible cyclical behaviour is derived only for the higher flux sources. We therefore took a threshold which corresponds to the weakest positive detection of Prokhorov & Moraghan (2017), fmin = 2.8 × 10⁻⁸ photons cm−2 s−1, relative to the source 4C +01.28 (3FGL J1058.5+0133), and consider the total number Ntot = 45 of γ-ray BL Lacs above fmin/2, which appear in the Fermi-LAT 3FGL catalogue. A rough estimate of the fraction of quasi-periodic BL Lac objects is therefore given by
 (1)
(1)
The value of ξB coincides with the estimate already discussed by Sandrinelli et al. (2017).
We now compare the above with results of a similar discussion of optical quasi-periodicities of quasars. In the 250 k quasars of the CatalinaReal-time Transient Survey there are 111 potentially periodic sources (Graham et al. 2015), and in the Palomar Transient Factory (Charisi et al. 2016) in a sample of 33 k objects the possible quasi-periodicities are 33, yielding ξQ ~ 4×10⁻⁴–10−3. Let us restrict to the local universe z ≲ 1. The quasar density ρQ ~ 10−7 Mpc−3 (e.g. Croom et al. 2004), while the BL Lac density from theFermi γ-ray data (Ajello et al. 2014) is ρB ~10−8 Mpc−3. The density of quasi-periodic BL Lacs is given by ρBP = ξB ρB ~ 10−9 Mpc−3, and that of quasi-periodic quasars by ρQP = ξQ ρQ ~ 10−11–10−10 Mpc−3. Then at face value ρBP >>ρQP, the local density quasi-periodic BL Lacs largely overcomes that of quasars. We stress again that the argument is based on a search of quasi-periodicities for BL Las and quasars in two very different spectral bands.
The higher fraction of quasi-periodic sources for BL Lacs with respect to quasars might have important consequences for its interpretation. In fact Sesana et al. (2018) have shown that if all potentially periodic quasars were SBBHs, with some assumption about the mass ratio of the two black holes there would be a tension with the gravitational wave background at nano-Hz frequencies (year long) probed with pulsar timing array. This tension would be likely substantially increased in the case of BL Lacs objects. This subject is treated indetail in a coordinated paper of ours (Holgado et al. 2018) in which we will indeed show that this is the case. It is therefore likely that BL Lac quasi-periodicities are not related to a binary nature of the sources; they can be caused by other physical processes such as relativistic jet instabilities, or they can still manifest as chance fluctuation of the source stochastic variability since the significance of the quasi-periodicities is noticeable (~90%), but not extreme.
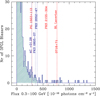 |
Fig. 4 Tail of the distribution of the mean Fermi γ-ray fluxes (>300 MeV) for the 1144 sources classified as blazars in Fermi-LAT 3FGL catalogue (Acero et al. 2015). The positions of the the seven quasi-periodic sources proposed by Prokhorov & Moraghan (2017) are indicated by dotted lines, distinguishing BL Lacs (red) and flat spectrum radio quasars (blue). |
Acknowledgements
We thank the referee for the prompt and constructive report. A. Sesana is supported by the Royal Society.
References
- Acero, F., Ackermann, M., Ajello, M., et al. 2015, ApJS, 218, 23 [Google Scholar]
- Ackermann, M., Ajello, M., Albert, A., et al. 2015, ApJ, 813, L41 [NASA ADS] [CrossRef] [Google Scholar]
- Ajello, M., Romani, R. W., Gasparrini, D., et al. 2014, ApJ, 780, 73 [NASA ADS] [CrossRef] [Google Scholar]
- Barret, D., & Vaughan, S. 2012, ApJ, 746, 131 [NASA ADS] [CrossRef] [Google Scholar]
- Bonning, E., Urry, C. M., Bailyn, C., et al. 2012, ApJ, 756, 13 [NASA ADS] [CrossRef] [Google Scholar]
- Camenzind, M., & Krockenberger, M. 1992, A&A, 255, 59 [NASA ADS] [Google Scholar]
- Caproni, A., Abraham, Z., Motter, J. C., & Monteiro, H. 2017, ApJ, 851, L39 [NASA ADS] [CrossRef] [Google Scholar]
- Cavaliere, A., Tavani, M., & Vittorini, V. 2017, ApJ, 836, 220 [NASA ADS] [CrossRef] [Google Scholar]
- Charisi, M., Bartos, I., Haiman, Z., et al. 2016, MNRAS, 463, 2145 [NASA ADS] [CrossRef] [Google Scholar]
- Covino, S., Stefanon, M., Sciuto, G., et al. 2004, Proc. SPIE, 5492, 1613 [NASA ADS] [CrossRef] [Google Scholar]
- Covino, S., Sandrinelli, A., & Treves, A. 2017, IAU Symp., 324, 180 [NASA ADS] [Google Scholar]
- Croom, S. M., Smith, R. J., Boyle, B. J., et al. 2004, MNRAS, 349, 1397 [NASA ADS] [CrossRef] [Google Scholar]
- Cutini, S., Ciprini, S., Larsson, S., et al. 2016, AAS, 227, 403.02 [NASA ADS] [Google Scholar]
- Falomo, R., Pian, E., & Treves, A. 2014, A&ARv, 22, 73 [NASA ADS] [CrossRef] [Google Scholar]
- Gelman, A., Meng, X. L., & Stern, H., 1996, Stat. Sin., 6, 733 [Google Scholar]
- Graham, M. J., Djorgovski, S. G., Stern, D., et al. 2015, MNRAS, 453, 1562 [NASA ADS] [CrossRef] [Google Scholar]
- Guidorzi, C., Dichiara, S., Amati, L. 2016, A&A, 589, A98 [NASA ADS] [CrossRef] [EDP Sciences] [Google Scholar]
- Holgado, A. M., Sesana, A., Sandrinelli, A., et al. 2018, MNRAS, submitted, [arXiv:1806.11111] [Google Scholar]
- Kastendieck, M. A., Ashley, M. C. B., & Horns, D. 2011, A&A, 531, A123 [NASA ADS] [CrossRef] [EDP Sciences] [Google Scholar]
- Kelly, B. C., Becker, A. C., Sobolewska, M., Siemiginowska, A., & Uttley, P. 2014, ApJ, 788, 33 [NASA ADS] [CrossRef] [Google Scholar]
- Lehto, H. J., & Valtonen, M. J. 1996, ApJ, 460, 207 [NASA ADS] [CrossRef] [Google Scholar]
- Madejski, G., & Sikora, M. 2016, ARA&A, 54, 725 [NASA ADS] [CrossRef] [Google Scholar]
- Marscher, A. P. 2014, ApJ, 780, 87 [NASA ADS] [CrossRef] [Google Scholar]
- Padovani, P., Alexander, D. M., Assef, R. J., et al. 2017, A&ARv, 25, 2 [Google Scholar]
- Press, W. H. 1978, Comments Astrophys., 7, 103 [NASA ADS] [Google Scholar]
- Prokhorov, D. A., & Moraghan, A. 2017, MNRAS, 471, 3036 [NASA ADS] [CrossRef] [Google Scholar]
- Raiteri, C. M., Villata, M., & for the WEBT Collaboration, 2017, Nature, 552, 374 [NASA ADS] [CrossRef] [Google Scholar]
- Sandrinelli, A., Covino, S., & Treves, A. 2014a, ApJ, 793, L1 [NASA ADS] [CrossRef] [Google Scholar]
- Sandrinelli, A., Covino, S., & Treves, A. 2014b, A&A, 562, A79 [NASA ADS] [CrossRef] [EDP Sciences] [Google Scholar]
- Sandrinelli, A., Covino, S., Dotti, M., & Treves, A. 2016a, AJ, 151, 54 [NASA ADS] [CrossRef] [Google Scholar]
- Sandrinelli, A., Covino, S., & Treves, A. 2016b, ApJ, 820, 20 [NASA ADS] [CrossRef] [Google Scholar]
- Sandrinelli, A., Covino, S., Treves, A., et al. 2017, A&A, 600, A132 [NASA ADS] [CrossRef] [EDP Sciences] [Google Scholar]
- Scargle, J. D. 1982, ApJ, 263, 835 [NASA ADS] [CrossRef] [Google Scholar]
- Schulz, M., & Mudelsee, M. 2002, Comput. Geosci., 28, 421 [NASA ADS] [CrossRef] [Google Scholar]
- Schwarzenberg-Czerny, A. 1991, MNRAS, 253, 198 [NASA ADS] [CrossRef] [Google Scholar]
- Sesana, A., Haiman, Z., Kocsis, B., & Kelley, L. Z. 2018, ApJ, 856, 42 [NASA ADS] [CrossRef] [Google Scholar]
- Sillanpää, A., Haarala, S., Valtonen, M. J., Sundelius, B., & Byrd, G. G. 1988, ApJ, 325, 628 [NASA ADS] [CrossRef] [Google Scholar]
- Smith, P. S., Montiel, E., Rightley, S., et al. 2009, ArXiv e-prints [arXiv:0912.3621] [Google Scholar]
- Sobacchi, E., Sormani, M. C., & Stamerra, A. 2017, MNRAS, 465, 161 [NASA ADS] [CrossRef] [Google Scholar]
- Takalo, L. O., Nilsson, K., Lindfors, E., et al. 2008, AIP Conf. Ser., 1085, 705 [NASA ADS] [CrossRef] [Google Scholar]
- VanderPlas, J. T. 2017, ApJS, 236, 16 [Google Scholar]
- Vaughan, S. 2005, A&A, 431, 391 [NASA ADS] [CrossRef] [EDP Sciences] [Google Scholar]
- Vaughan, S. 2010, MNRAS, 402, 307 [NASA ADS] [CrossRef] [Google Scholar]
- Zerbi, F. M., Chincarini, G., Ghisellini, G., et al. 2004, Proc. SPIE, 5492, 1590 [NASA ADS] [CrossRef] [Google Scholar]
- Zhang, B.-K., Zhao, X.-Y., Wang, C.-X., & Dai, B.-Z. 2014, Res. Astron. Astrophys., 14, 933 [NASA ADS] [CrossRef] [Google Scholar]
- Zhang, P.-F., Yan, D.-H., Liao, N.-H., & Wang, J.-C. 2017a, ApJ, 835, 260 [NASA ADS] [CrossRef] [Google Scholar]
- Zhang, P.-F., Yan, D.-H., Zhou, J.-N., et al. 2017b, ApJ, 845, 82 [NASA ADS] [CrossRef] [Google Scholar]
All Tables
All Figures
|
Fig. 1 Flux light curves of PKS2155−304 (top panel) and PG1553+113 (bottom panel). Fermi light curves in the 100 MeV–300 GeV energy range (7-day and 20-day binned, respectively) are reported. The combined nightly averaged R-band data are also given. The light curves are not host galaxy subtracted. In the optical light curves error bars are in most cases smaller than symbol size. |
| In the text | |
|
Fig. 2 Single-frequency (top panels) and global-frequency (bottom panels) power spectral densities of PKS2155−304. Left panels are related to the 100 MeV–300 GeV Fermi light curve, and right panels to the R-band light curve. Lomb-Scargle spectrum of the input time-series data is given in blue and the best-fit noise spectrum in red. The 95.0% and 99.7% false alarm levels are reported with yellow and green lines. Solid and dashed lines refer to PL and AR1 models, respectively. |
| In the text | |
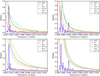 |
Fig. 3 Same as Fig. 2 for PG1553+113. |
| In the text | |
|
Fig. 4 Tail of the distribution of the mean Fermi γ-ray fluxes (>300 MeV) for the 1144 sources classified as blazars in Fermi-LAT 3FGL catalogue (Acero et al. 2015). The positions of the the seven quasi-periodic sources proposed by Prokhorov & Moraghan (2017) are indicated by dotted lines, distinguishing BL Lacs (red) and flat spectrum radio quasars (blue). |
| In the text | |
Current usage metrics show cumulative count of Article Views (full-text article views including HTML views, PDF and ePub downloads, according to the available data) and Abstracts Views on Vision4Press platform.
Data correspond to usage on the plateform after 2015. The current usage metrics is available 48-96 hours after online publication and is updated daily on week days.
Initial download of the metrics may take a while.