Fig. 1
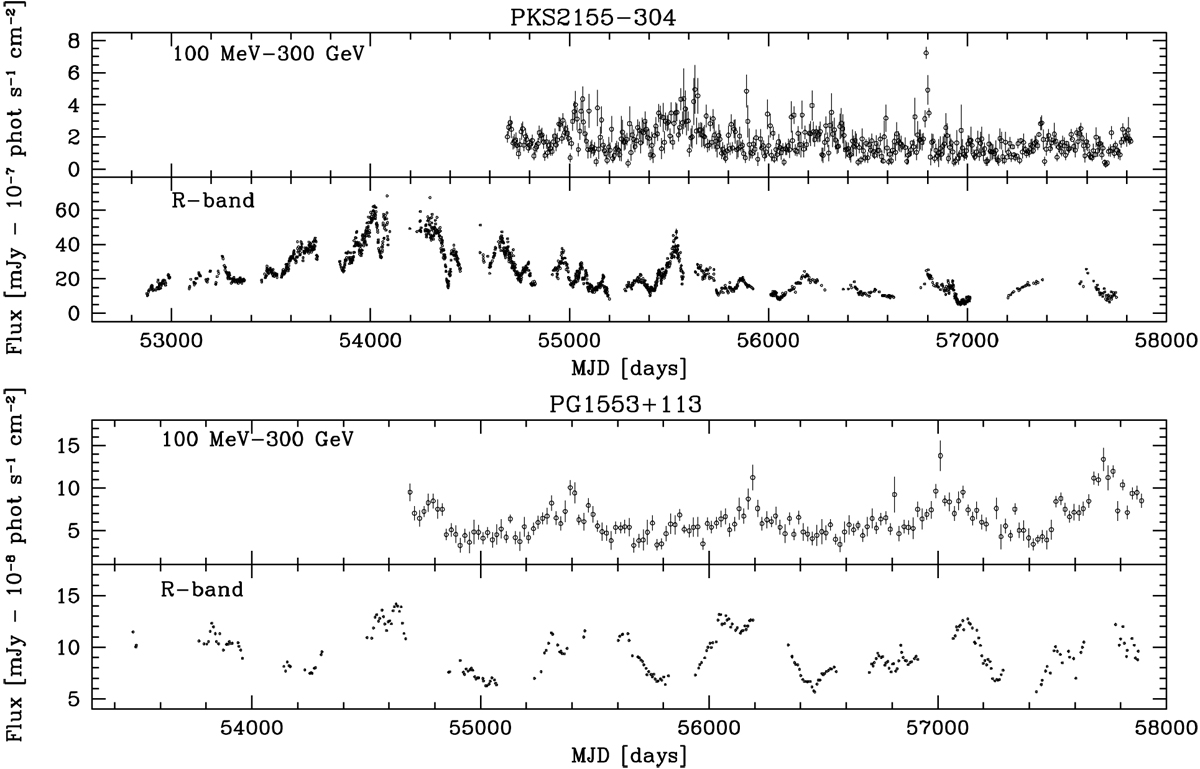
Flux light curves of PKS2155−304 (top panel) and PG1553+113 (bottom panel). Fermi light curves in the 100 MeV–300 GeV energy range (7-day and 20-day binned, respectively) are reported. The combined nightly averaged R-band data are also given. The light curves are not host galaxy subtracted. In the optical light curves error bars are in most cases smaller than symbol size.
Current usage metrics show cumulative count of Article Views (full-text article views including HTML views, PDF and ePub downloads, according to the available data) and Abstracts Views on Vision4Press platform.
Data correspond to usage on the plateform after 2015. The current usage metrics is available 48-96 hours after online publication and is updated daily on week days.
Initial download of the metrics may take a while.