Fig. 2
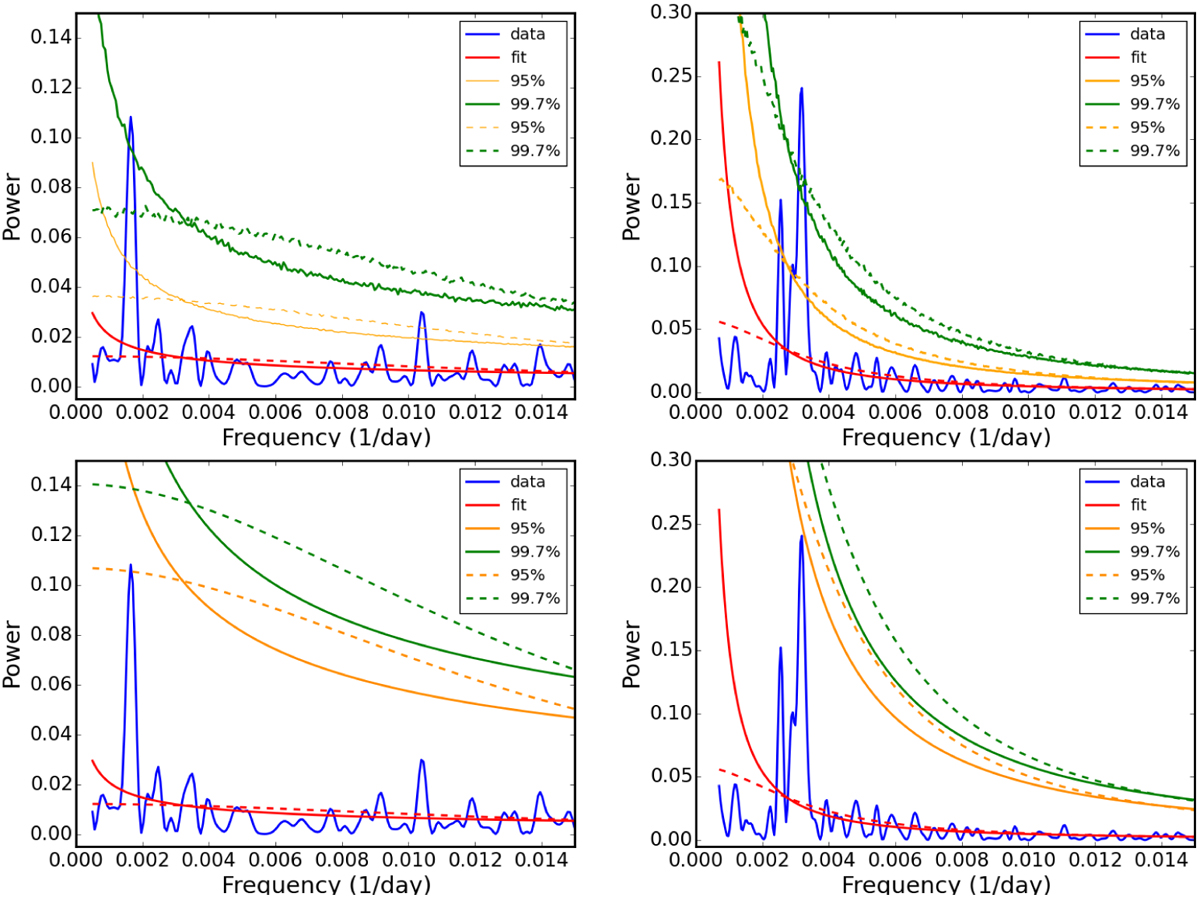
Single-frequency (top panels) and global-frequency (bottom panels) power spectral densities of PKS2155−304. Left panels are related to the 100 MeV–300 GeV Fermi light curve, and right panels to the R-band light curve. Lomb-Scargle spectrum of the input time-series data is given in blue and the best-fit noise spectrum in red. The 95.0% and 99.7% false alarm levels are reported with yellow and green lines. Solid and dashed lines refer to PL and AR1 models, respectively.
Current usage metrics show cumulative count of Article Views (full-text article views including HTML views, PDF and ePub downloads, according to the available data) and Abstracts Views on Vision4Press platform.
Data correspond to usage on the plateform after 2015. The current usage metrics is available 48-96 hours after online publication and is updated daily on week days.
Initial download of the metrics may take a while.