Fig. 5
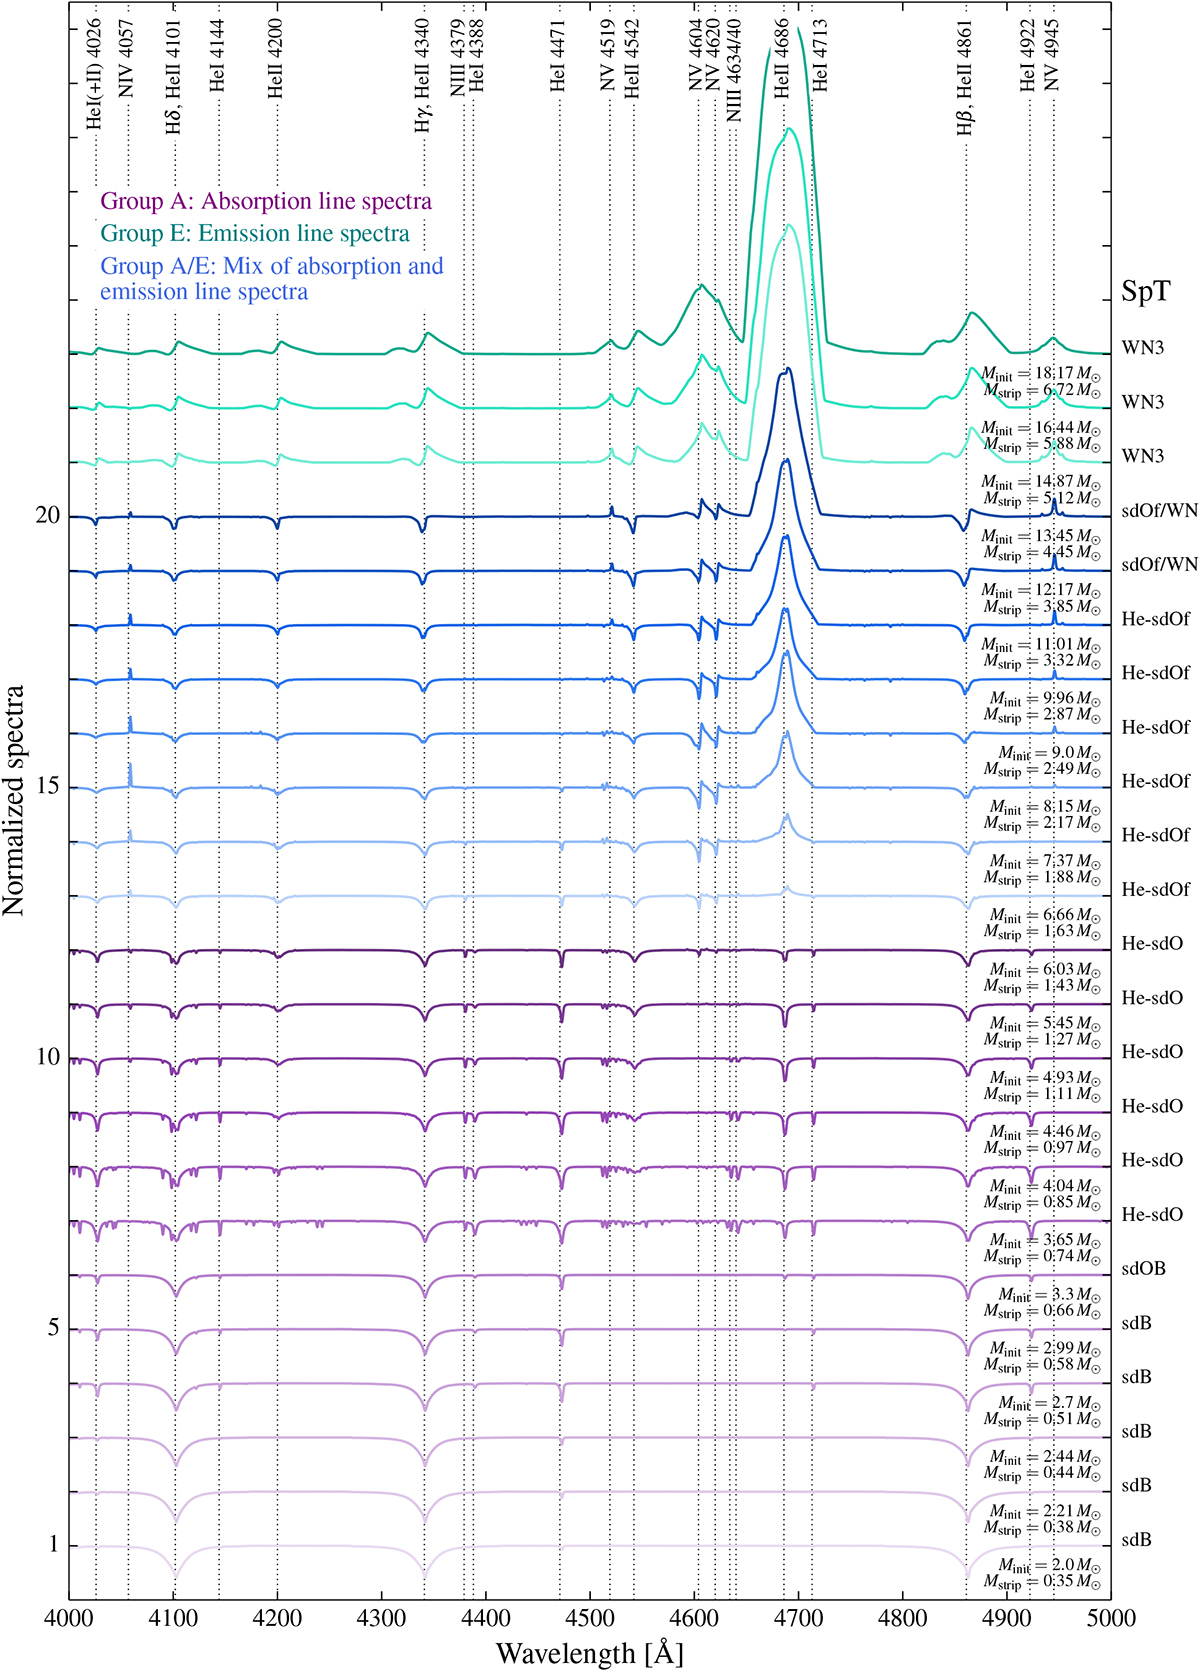
Optical spectra of the models in the solar metallicity grid. The transition from subdwarf to O-type star to slash-star to WN star is visible. We note that as temperature increases with higher mass, lower ionization lines become weaker, while higherionization lines become stronger. We mark the lines important for spectral classification with dotted lines and assign the spectral class to the right of the normalized spectrum.
Current usage metrics show cumulative count of Article Views (full-text article views including HTML views, PDF and ePub downloads, according to the available data) and Abstracts Views on Vision4Press platform.
Data correspond to usage on the plateform after 2015. The current usage metrics is available 48-96 hours after online publication and is updated daily on week days.
Initial download of the metrics may take a while.