Fig. 5
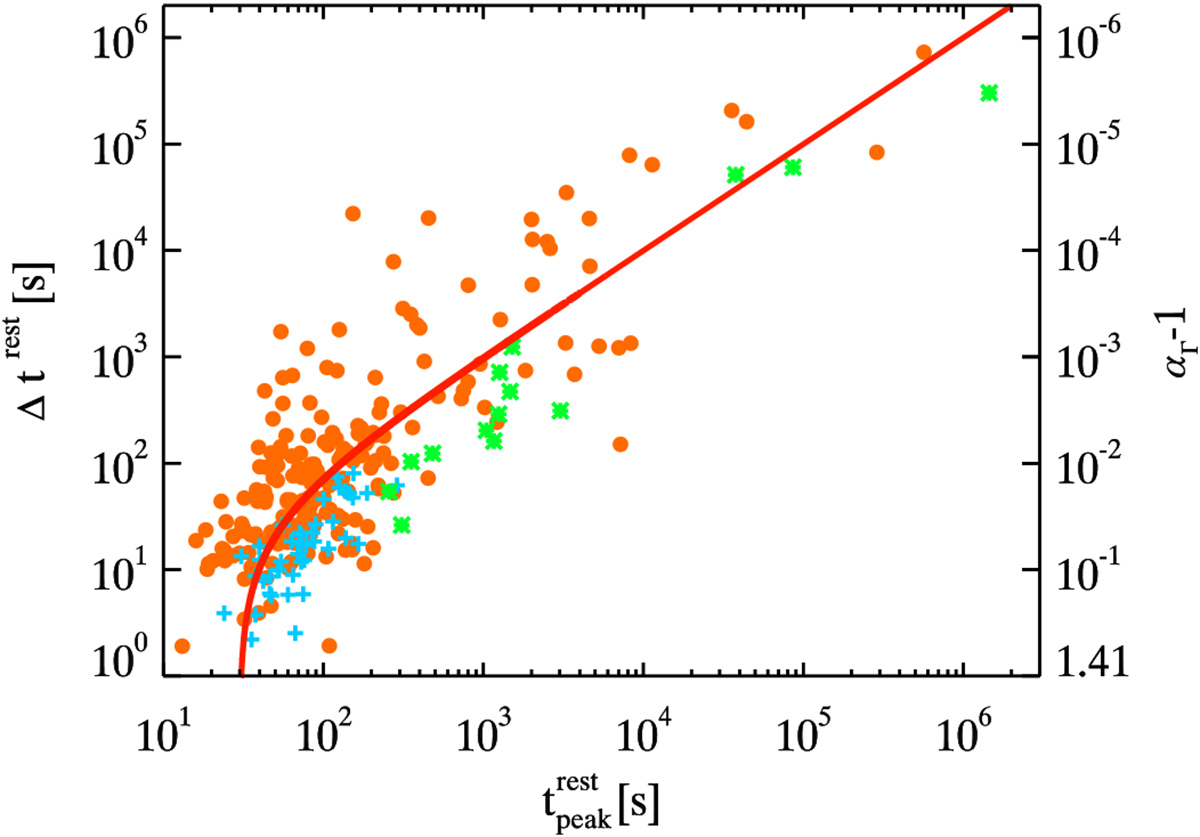
Rest frame duration vs. occurrence time for XRFs. The right-hand vertical axis shows the values of αΓ (rescaled by 1) corresponding to the values of Δtrest through Eq. (10). Different symbols and colours refer to different sources found in the literature for these parameters. Orange points, green asterisks, and cyan crosses are associated with XRF (only those with a measured redshift) from Yi et al. (2016), Bernardini et al. (2011), and Chincarini et al. (2010), respectively. The red solid line shows the expected relation between the flare width and the time of the flare in the IS shock model (it is obtained by adopting Δ T = 30 s and Δ R = 7 × 1010 cm).
Current usage metrics show cumulative count of Article Views (full-text article views including HTML views, PDF and ePub downloads, according to the available data) and Abstracts Views on Vision4Press platform.
Data correspond to usage on the plateform after 2015. The current usage metrics is available 48-96 hours after online publication and is updated daily on week days.
Initial download of the metrics may take a while.