| Issue |
A&A
Volume 615, July 2018
|
|
|---|---|---|
| Article Number | A25 | |
| Number of page(s) | 9 | |
| Section | Cosmology (including clusters of galaxies) | |
| DOI | https://doi.org/10.1051/0004-6361/201732186 | |
| Published online | 05 July 2018 | |
Molecular gas in AzTEC/C159: a star-forming disk galaxy 1.3 Gyr after the Big Bang
1
Argelander Institute for Astronomy, University of Bonn,
Auf dem Hügel 71,
53121
Bonn, Germany
e-mail: ericja@astro.uni-bonn.de
2
International Max Planck Research School of Astronomy and Astrophysics, Universities of Bonn and Cologne,
Bonn, Germany
3
Physics Department, New Mexico Institute of Mining and Technology,
801 Leroy Pl,
Socorro,
NM
87801, USA
4
National Radio Astronomy Observatory,
1003 Lopezville Road,
Socorro,
NM 87801, USA
5
Cavendish Astrophysics Group, University of Cambridge,
Cambridge
CB3 0HE, UK
6
Dark Cosmology Centre, Niels Bohr Institute, University of Copenhagen,
Juliane Maries Vej 30, 2100
Copenhagen, Denmark
7
Department of Astronomy, Cornell University,
Space Sciences Building,
Ithaca,
NY 14853, USA
8
Max Planck Institute for Astronomy,
Königstuhl 17,
69117
Heidelberg, Germany
9
Astronomy Centre, Department of Physics and Astronomy, University of Sussex,
Brighton
BN1 9QH, UK
10
Astronomical Observatory Institute, Faculty of Physics, Adam Mickiewicz University,
ul. Słoneczna 36,
60-286
Poznań, Poland
11
Department of Physics and Astronomy, University of Bologna,
viale Berti Pichat 6/2,
40127
Bologna, Italy
12
Kapteyn Astronomical Institute,
Postbus 800, 9700 AV
Groningen, The Netherlands
13
NASA Goddard Space Flight Center,
Code 665,
Greenbelt,
MD 20771, USA
14
Department of Physics and Astronomy, Johns Hopkins University,
Baltimore,
MD 21218, USA
15
Department of Physics, Faculty of Science, University of Zagreb,
Bijenička cesta 32,
10000
Zagreb, Croatia
16
Núcleo de Astronomía,
Facultad de Ingeniería y Ciencias, Universidad Diego Portales,
Av. Ejército 441, Santiago, Chile
17
Science Mission Directorate,
NASA Headquarters, Washington,
DC 20546-0001, USA
18
Infrared Processing and Analysis Center, California Institute of Technology,
MC 100-22,
770 South Wilson Ave.,
Pasadena,
CA 91125, USA
19
Spitzer Science Center, California Institute of Technology,
Pasadena,
CA 91125, USA
20
Space Telescope Science Institute,
3700 San Martin Drive, Baltimore,
MD 21218, USA
21
European Southern Observatory,
Karl-Schwarzschild-Strasse 2,
85748
Garching bei Muenchen, Germany
22
Centre for Extragalactic Astronomy, Durham University,
South Road,
Durham
DH1 3LE, UK
23
Greenhouse Software,
3rd Floor, 110 5th Avenue,
New York,
NY 10011, USA
24
Institute for Astronomy, Astrophysics, Space Applications and Remote Sensing, National Observatory of Athens,
15236
Athens, Greece
25
Max Planck Institute for Radioastronomy,
Auf dem Hügel 69,
53121
Bonn, Germany
Received:
27
October
2017
Accepted:
9
February
2018
We studied the molecular gas properties of AzTEC/C159, a star-forming disk galaxy at z = 4.567, in order to better constrain the nature of the high-redshift end of the submillimeter-selected galaxy (SMG) population. We secured 12CO molecular line detections for the J = 2 →1 and J = 5 →4 transitions using the Karl G. Jansky Very Large Array (VLA) and the NOrthern Extended Millimeter Array (NOEMA) interferometer. The broad (FWHM ~ 750 km s−1) and tentative double-peaked profiles of the two 12CO lines are consistent with an extended molecular gas reservoir, which is distributed in a rotating disk, as previously revealed from [CII] 158 μm line observations. Based on the 12CO(2 →1) emission line, we derived L′CO=(3.4±0.6)×1010 K km s−1 pc2, which yields a molecular gas mass of MH2(αCO/4.3)=(1.5±0.3)×1011 M⊙ and unveils a gas-rich system with μgas(αCO/4.3)≡MH2/M⋆=3.3±0.7. The extreme star formation efficiency of AzTEC/C159, parametrized by the ratio LIR/L′CO=(216±80) L⊙ (K km s−1 pc2)−1, is comparable to merger-driven starbursts such as local ultra-luminous infrared galaxies and SMGs. Likewise, the 12CO(5 →4)/CO(2 →1) line brightness temperature ratio of r52 = 0.55 ± 0.15 is consistent with high-excitation conditions as observed in SMGs. Based on mass budget considerations, we constrained the value for the L′CO – H2 mass conversion factor in AzTEC/C159, that is, αCO=3.9−1.3+2.7 M⊙ K−1 km−1 s pc−2, which is consistent with a self-gravitating molecular gas distribution as observed in local star-forming disk galaxies. Cold gas streams from cosmological filaments might be fueling a gravitationally unstable gas-rich disk in AzTEC/C159, which breaks into giant clumps and forms stars as efficiently as in merger-driven systems and generates high gas excitation. These results support the evolutionary connection between AzTEC/C159-like systems and massive quiescent disk galaxies at z ~ 2.
Key words: galaxies: high-redshift / galaxies: formation / galaxies: ISM / ISM: molecules
© ESO 2018
1 Introduction
Submillimeter-selected galaxies (SMGs), which are gas-rich starbursts at high redshifts (e.g., Blain et al. 2002; Tacconi et al. 2006, 2008; Narayanan et al. 2010; Casey et al. 2014), might be the progenitors of compact quiescent galaxies ( log (M⋆∕M⊙) > 11) at z ~ 2 (e.g., Simpson et al. 2014; Toft et al. 2014; Ikarashi et al. 2015; Oteo et al. 2016, 2017). It is believed that the intense starburst episode can be followed by an active galactic nucleus (AGN) phase that eventually quenches the star formation (Hopkins et al. 2006; Wuyts et al. 2010; Hickox et al. 2012; Steinhardt & Speagle 2014). However, there is a lack of consensus on the physical mechanisms driving the extreme production of stars in SMGs. It has been proposed that compact starbursts might be fueled via major gas-rich mergers (e.g., Walter et al. 2009; Narayanan et al. 2010; Hayward et al. 2011, 2012; Alaghband-Zadeh et al. 2012; Riechers et al. 2013, 2014). An alternative scenario involves the smooth infall and accretion of cold gas from the intergalactic medium that could also drive intense star formation in massive highly unstable high-redshift galaxies (e.g., Dekel et al. 2009a; Kereš et al. 2009a,b; Davé et al. 2010; Hodge et al. 2012; Romano-Díaz et al. 2014; Feng et al. 2015; Anglés-Alcázar et al. 2017).
To constrain the origin of SMGs and their possible evolutionary path, much effort has been spent in building statistically complete and unbiased samples of these objects (e.g., Banerji et al. 2011; Yun et al. 2012; Hodge et al. 2013; Strandet et al. 2016; Brisbin et al. 2017; Michałowski et al. 2017). Particular emphasis has been placed on the recently discovered high-redshift tail (4 < z < 6) of the SMG population (e.g., Daddi et al. 2009a,b; Capak et al. 2008, 2011; Coppin et al. 2009; Knudsen et al. 2010; Smolčić et al. 2011; Barger et al. 2012; Walter et al. 2012; Ivison et al. 2016). By exploring the physical properties of these z > 4 systems, one might further strengthen the evolutionary link between high-redshift SMGs and massive quiescent galaxies at z ~ 2 (e.g., Fudamoto et al. 2017), and provide constraints on cosmological models that aim to reproduce the extreme and massive environments of early SMGs (e.g., Baugh et al. 2005; Dwek et al. 2011; Hayward et al. 2011, 2013; Ferrara et al. 2016). However, probing the nature of these systems is observationally expensive (e.g., Hodge et al. 2012) and somewhat complex. Although gravitationally lensed sources might overcome the issue of time-consuming follow-up observations (e.g., Strandet et al. 2016; Harrington et al. 2016, 2018), their derived quantities might be affected by lens-modeling uncertainties (Bussmann et al. 2013).
To investigate the role of this relatively unexplored SMG population in the context of galaxy formation and evolution, Smolčić et al. (2015) have presented the largest sample of spectroscopically confirmed and unlensed z > 4 SMGs (six sources) in the Cosmic Evolution Survey (COSMOS) field, where only AzTEC3 (z = 5.298), which has been studied in detail by Riechers et al. (2010, 2014), was excluded. To explore the dust distribution and gas kinematics, high-resolution [CII] 158 μm line observations have been secured toward three of these sources: J1000+0234 (z = 4.544), Vd−17871 (z = 4.624), and AzTEC/C159 (z = 4.567, Karim et al., in prep.; hereafter K18). Based on these observations, Jones et al. (2017, hereafter J17) revealed a gas-dominated rotating disk in J1000+0234 and AzTEC/C159. The latter emerges as the best example of a flat rotation curve at large radius. These extreme systems, with gas-dominated rotating disks and concomitant intense star formation activity, seem to have no analog at lower redshifts; rendering their detailed study paramount to understand the formation of galaxies in the early Universe.
Here, we report the detection of 12 CO(2 →1) and 12 CO(5 →4) line emission to investigate the molecular gas properties of AzTEC/C159. 12 CO observations have proved to be well suited to unveil the nature of the star-forming gas of high-redshift galaxies (e.g., Frayer et al. 1998; Riechers et al. 2008; Schinnerer et al. 2008; Carilli et al. 2010; Engel et al. 2010; Riechers et al. 2011; Hodge et al. 2012, 2013; Bothwell et al. 2013; Bouché et al. 2013; Carilli & Walter 2013; De Breuck et al. 2014; Sánchez Almeida et al. 2014; Leroy et al. 2015; Narayanan et al. 2015). Low-J 12 CO emission lines provide tight constraints on the mass and extent of the molecular gas reservoir, as well as on the star formation efficiency (SFE). In combination with multiple high-J 12 CO line detections, it is possible to explore the 12CO spectral line energy distribution (SLED) and unveil the physical properties of the star-forming gas (e.g., Weiss et al. 2005, 2007; Carilli et al. 2010; Riechers et al. 2010; Papadopoulos et al. 2012b; Daddi et al. 2015). While the 12 CO (2→1) and 12 CO (5 → 4) line detections alone cannot fully constrain the shape of the 12CO SLED of AzTEC/C159, they do allow us to estimate the brightness temperature ratio r52 (e.g., Bothwell et al. 2013). This parameter can be used to obtain initial insights about the overall excitation conditions of the molecular gas in high-redshift systems (e.g., Riechers et al. 2010). Molecular line spectroscopic studies, on the other hand, can be well complemented with far-infrared (FIR) photometric information tracing the dust-obscured star-formation activity in SMGs; via FIR SED fitting, it is possible to estimate dust mass, infrared luminosity (LIR ), and hence star formation rates (SFR, e.g., Swinbank et al. 2014).
After introducing AzTEC/C159 in Sect. 2, we present the details of the observations in Sect. 3, followed by the results and discussion in Sects. 4 and 5. A summary is given in Sect. 6. Throughout, we assume a cosmology of h0 = 0.7, Ω M = 0.3, and Ω Λ = 0.7.
2 AzTEC/C159
AzTEC/C159 was originally detected at the 3.7σ level in the ASTE/AzTEC-COSMOS 1.1 mm survey of the inner COSMOS 1 deg2 (Aretxaga et al. 2011). Long-slit spectroscopy with DEIMOS/Keck has revealed a narrow Lyα line, which places AzTEC/C159 at a redshift z = 4.569 (Smolčić et al. 2015). The broadband spectral energy distribution (SED) from the optical through the FIR is consistent with a dusty star-forming galaxy, with an SFR of ~700 M⊙ yr−1, a stellar mass of (4.5 ± 0.4) × 1010 M⊙, and a dust mass of  (Smolčić et al. 2015; Gómez-Guijarro et al. 2018, hereafter GG18). High-resolution [CII] 158 μm line observations (FWHM = 0.36 arcsec) with the Atacama Large Millimeter/submillimeter Array (ALMA; project 2012.1.00978.S, PI: A. Karim) have revealed a double-horn profile, while the [CII] 158 μm first moment and channel maps are well described by the classic pattern for rotating disks (J17, K18). AzTEC/C159 complements the sample of galaxies at z > 4 exhibiting regular gas rotation on kiloparsec scales (i.e., disks): GN20 (z = 4.05), ALESS73.1 (z = 4.755), J1000+0234 (z = 4.542), Vd−17871 (z = 4.622), and J1319+0950 (z = 6.127, Hodge et al. 2012; De Breuck et al. 2014; Jones et al. 2017; Shao et al. 2017, K18). The kinematic signatures of rotation revealed by ALMA (J17, K18), including evidence of a flat rotation curve at large radius (J17), render AzTEC/C159 one of the best examples to date for an apparently rotating disk galaxy in the early Universe. We note, however, that given the achieved ~ 2.3 kpc resolution ALMA observations, we cannot completely rule out a merging scenario from the [C II] line dynamical analysis alone. In this context, studies that probe the physical properties of the interstellar medium (ISM), for example, molecular gas, are also key to indirectly probe the dominant mode of star formation in this system.
3 Karl G. Jansky VLA and NOEMA Observations
12 CO(2 →1) line observations were carried out in January 2016 with the Karl G. Jansky Very Large Array (VLA) of the NRAO in the D– and DnC–configurations (project 15B-280, PI: A. Karim). Five observing sessions of 3.5 h each resulted in a total of 17.5 h, with 9.0 h on target. We used the quasar 3C286 for bandpass, delay, and flux calibration, and J1038+0512 for complex gain calibration. We made use of the Q-band receivers and the pair of 8-bit samplers on each VLA antenna, resulting in a pair of 1.024 GHz bands in right and left circular polarization. These bands were overlapped by 128 MHz to correct for the loss of signal at their edges, so that the total bandwidth was 1.92 GHz (from 40.963 to 42.883 GHz), which covers the redshifted 12 CO(2 →1) line at 41.41 GHz, according to the prior redshift estimation of z = 4.567 ± 0.002 based on the [CII] 158 μm line detection with ALMA (K18). Data were calibrated using the Common Astronomy Software Applications (CASA). Images were created withthe CASA task clean and using a range of robust parameters. Ultimately, we used the image computed with robust = 1 as it provides the best balance between spatial resolution and rms noise. This results in a data cube with a synthesized beam size of 1.70 × 1.24 arcsec resolution (PA = 77.5°) with an rms of 0.05 mJy beam−1 for 27 MHz (~ 200 km s−1) wide channel.
The 12 CO(5 →4) line was observed with the NOrthern Extended Millimeter Array (NOEMA) interferometer on December 8, 2015, and January 19, 2016, over two tracks (project 15CX001, PI: A. Karim) in D- and C-configuration. We used the WideX correlator, which covers a frequency range of 3.6 GHz. The tuning frequency of 103.51 GHz was chosen to encompass the redshifted 12 CO(5 →4) line, considering z = 4.567 ± 0.002. We used the quasars 3C84 and B0906+015 as flux and phase or amplitude calibrators, respectively. The data calibration and mapping were performed with the IRAM GILDAS software packages clean and mapping. The final cube corresponds to 9.4 h on source out of ~19 h of total observing time, with a synthesized beam size of 5.0 × 2.6 arcsec and PA = 23.5° (using natural weighting). We reach a sensitivity of 0.13 mJy beam−1 per 200 km s−1 wide channel.
4 Analysis and results
4.1 CO lines
The 12 CO(2 →1) and 12 CO(5 →4) integrated lines are detected at the 5.5 and 8.1σ level, respectively. Figure 1 shows the intensity maps integrated over ~1500 km s−1 where significant line emission was detected. The peak position of the 12 CO lines spatially coincides with that of the [CII] 158 μm line (K18) within the positional uncertainties of ~0.2 and 0.5 arcsec, respectively. The 12 CO(2 →1) line spectrum was extracted within an ellipse of 2.1 × 1.7 arcsec (PA = 90 deg). This aperture contains the total extent of the [CII] 158 μm line emission (~7 kpc; J17, K18) and ensures that no flux is missed. We fit Gaussians to the 12 CO line spectra within ±850 km s−1 of the centroid (see Fig. 1) and measured an FWHM of 750 km s−1 for both lines. The line emission of 12 CO(2 →1) is centered at 41.425 ± 0.02 GHz, giving z = 4.565 ± 0.003; and the 12 CO(5 →4) centroid at 103.550 ± 0.05 GHz yields z = 4.565 ± 0.003. These values are in agreement with the redshift derived from the [CII] 158 μm line of 4.567 ± 0.002 (K18). Finally, we measured an integrated flux of 105 ± 19 mJy km s−1 for the 12 CO(2 →1) line and 417 ± 51 mJy km s−1 for 12 CO(5 →4). We verified that the latter values differ by less than 6% from those derived by adding individual flux densities per channel within the velocity range used in the Gaussian fit.
The measured 12 CO integrated line flux of high-redshift galaxies is influenced by cosmic microwave background (CMB) emission. While the higher temperature of the CMB at z = 4.5 enhances the line excitation, the background against which the 12 CO lines are measured also increases (e.g., da Cunha et al. 2013). For example, in a dense ISM ( ), with a gas kinetic temperature of Tkin = 40 K, we can measure 70% and 80% of the intrinsic value of the 12 CO(2 →1) and 12 CO(5 →4) line, respectively. In low-density environments (
 ) with Tkin = 18 K, only 20% of the intrinsic value of the 12 CO(2 →1) line is detected, and less than that for 12 CO(5 →4) (da Cunha et al. 2013). Unfortunately, we lack estimates for the gas density and kinetic temperature in AzTEC/C159. It is known, however, that high SFR is likely to be associated with high temperatures of gas and dust as well as gas density (e.g., Narayanan & Krumholz 2014). Under the assumption of thermodynamic equilibrium between the gas and dust, we would have Tkin ≃ Tdust = 37 K (from our mid-infrared (MIR)−millimeter SED fitting presented in Sect. 4.2). Therefore, we favor the scenario with dense gas and Tkin = 40 K that yields an increase in SCO(2 →1) and SCO(5 →4) by a factor [1/0.7] and [1/0.8], respectively (da Cunha et al. 2013). Consequently, we derive
  mJy km s−1 and
  mJy km s−1.
In Fig. 2 we compare the 12CO and [CII] 158 μm line profiles. We find that the 12CO lines are as broad as the [CII] 158 μm line (J17, K18), all with an FWHM ~ 750 km s−1. There is also marginal evidence of double-horn profiles in the two 12 CO lines, where two peaks are close to or above the 3σ level. To constrain the size of the 12CO(2 → 1) line emitting region, we fit a single Gaussian model to the uv data and find evidence for a point-like structure. Based on the synthesized beam size and signal-to-noise ratio (S/N) of the line detection, we used the results from Martí-Vidal et al. (2012, Eq. (7)) to estimate an upper limit of ~ 1 arcsec for the source size, which corresponds to an intrinsic size of ~6.5 kpc at the redshift of AzTEC/C159. An extended and possibly rotating molecular gas reservoir would be consistent with the [CII] 158 μm gas extent (~7 kpc) and dynamics of AzTEC/C159 (J17, K18). However, we advise caution when interpreting our results on the 12 CO size and dynamics of AzTEC/C159 because of the current limitation of our 12 CO line observations.
4.2 FIR properties
Continuum emission from AzTEC/C159 was detected at 3 mm from our NOEMA observations. By averaging line-free channel maps, around the 12 CO(5 →4) centroid at 103.550 GHz, we derived a value of 220 ± 40μ Jy. No continuum emission was detected in our VLA observations at ~ 7 mm; based on the noise level of the continuum image, we derive a 3σ upper limit of 20μ Jy. These new millimeter data points mitigate the uncertainties in determining the FIR properties of AzTEC/C159.
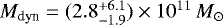
We derived the infrared luminosity (LIR; in the range 8–1000 μm), SFR, and dust mass (Mdust) of AzTEC/C159 via MIR-millimeter SED fitting using the Draine & Li (2007) dust model. We refer to Smolčić et al. (2015) for a detailed description of the fitting process. As shown in Fig. 3, in addition to our millimeter SED constraints, the 1.1 mm data point from the JCMT/AzTEC 1.1 mm survey (Scott et al. 2008), and the ALMA 870 μm continuum data point (GG18), we used observations from the Herschel Space Observatory (Pilbratt et al. 2010) toward the COSMOS field: those from the Photodetector Array Camera and Spectrometer (PACS at 100 and 160 μm; Lutz et al. 2011) as well as from the Spectral and Photometric Imaging Receiver (SPIRE at 250, 350, and 500 μm; Oliver et al. 2012). We find  , Tdust = 37 ± 3 K,
  . By assuming a Chabrier initial mass function (IMF) and the relation SFR [M⊙ yr−1] = 10−10LIR[L⊙] (Kennicutt 1998), we estimate an SFR =
  . The derived LIR and Tdust are 0.3 dex and 5 K higher, respectively, than the characteristic values for the full ALESS SMG sample with a median redshift of ~ 2.5 (Swinbank et al. 2014). Similar to the z > 4 SMGs presented by Smolčić et al. (2015), AzTEC/C159 lies at the high end of the LIR − Tdust correlation (e.g., Chapman et al. 2005; Magnelli et al. 2012), consistent with an extrapolation of the trend for Herschel-selected 0.1 < z < 2.0 infrared galaxies (Symeonidis et al. 2013).
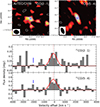 |
Fig. 1 Upper panels: velocity-integrated intensity maps of the 12CO(2 →1) and 12 CO(5 →4) line. We integrated emission within the velocity range of ± 750 km s−1, i.e. about 8 channels, where significant line emission was detected. The contour levels of the 12 CO(2 →1) line emissionmap are at [−2, 2, 3, 4] × 1σ, with σ = 0.05 mJy beam−1 per 200 km s−1 wide channel. Negative contours are shown in white and positive contours in blue. The beam size of 1.70 × 1.24 arcsec is plotted in the bottom left corner. The blue cross denotes the peak position of the [CII] 158 μm emission line. In the right panel we show the velocity-integrated intensity map of the 12 CO(5 →4) line emission. Contour levels are at [−3, 3, 4, 5, 6] × 1σ, with σ = 0.13 mJy beam−1 per 200 km s−1 wide channel. The beam size of 5.0 × 2.6 arcsec is alsoplotted in the bottom left corner. Lower panels: 12CO(2 →1) and 12 CO(5 →4) line spectra binned to 200 km s−1 channels. The red solid lines are Gaussian fits to the line spectra, the central position is shown by the red dashed lines. The blue error bar denotes the typical 1σ rms value. |
4.3 Molecular gas mass and star formation efficiency
The molecular gas mass can be estimated from the relation
 (1)
(1)
where αCO is the conversion factor of COluminosity to H2 mass, and  is the 12 CO(1 →0) line luminosity. The latter can be derived from our 12 CO(2 →1) line assuming that
  for typical SMG excitation conditions (consistent with the results in Sect. 4.4) and using the relation (Carilli & Walter 2013)
 (2)
(2)
where SCO(2 →1) is the integrated line flux in Jy km s−1, νCO(2→1) is the rest-frame frequency of the 12 CO(2 →1) line in GHz, and DL is the luminosity distance in Mpc. Based on  (i.e., the corrected value from the CMB) and Eq. (2), we derive
 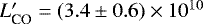 K km s−1 pc2.
The value for αCO depends on local ISM conditions and may consequently vary across different galaxy types (Daddi et al. 2010; Papadopoulos et al. 2012b; Magnelli et al. 2012; Bolatto et al. 2013). According to Papadopoulos et al. (2012b), the main driver of the αCO value is the average dynamical state of the molecular gas. As a result, while low values for αCO could be related to highly turbulent molecular gas, which is likely associated with merging systems, as observed in local ultra-luminous infrared galaxies (ULIRGs) with αCO = 0.8M⊙ K−1 km−1 s pc−2 (e.g., Downes & Solomon 1998), self-gravitating gas yields high αCO values (e.g., Papadopoulos et al. 2012a) as in star-forming spiral disks like the Milky Way with αCO = 4.3M⊙ K−1 km−1 s pc−2 (e.g., Abdo et al. 2010). Spatially resolved observations of nearby SFGs have also probed that αCO might vary within the galaxy itself, where central values could be significantly lower than the galaxy average (Sandstrom et al. 2013). For high-redshift unresolved sources, on the other hand, we have to rely on an average αCO that reflects the overall physical conditions of the molecular gas. Since J17 and K18 have revealed a rotationally supported gas disk in AzTEC/C159, it is likely that the bulk of the molecular gas is in self-gravitating clouds, pointing toward a Milky Way-like αCO value. We discuss the nature of αCO in this source in more detail and validate this assumption in Sect. 4.5. By adopting αCO = 4.3M⊙ K−1 km−1 s pc−2, we find  . Together with the stellar mass of AzTEC/C159 of M⋆ = (4.5 ± 0.4) × 1010 M⊙ (GG18), we estimate a gas fraction of
  that is five times greater than the median for main-sequence (MS) galaxies at z ~ 3 (Schinnerer et al. 2016). It should be noted that even when assuming a ULIRG-like αCO prescription (and a CMB uncorrected SCO(2 → 1) flux), the gas fraction would be high, that is, 0.43 ± 0.10. The massivemolecular gas reservoir of AzTEC/C159 is consistent with the general picture that large cool-ISM reservoirs fuel intense star formation activity at high redshift (e.g., Carilli & Walter 2013).
We used the empirical ratio  as a proxy of the SFE of AzTEC/C159, allowing a more direct comparison with the average SFE of different galaxy populations. Based on the information in Table 1, we derive
  (K km s−1 pc2)−1, which placesit within the upper scatter of the
  correlation as presented by Carilli & Walter (2013). This ratio is much higher than that observed in normal star-forming disk galaxies such as nearby spirals and z ~ (0.4 − 2) MS galaxies (between 20 and 100 L⊙ (K km s−1 pc2)−1; Daddi et al. 2010; Magnelli et al. 2012), but comparable to merger-driven starbursts such as local ULIRGs and SMGs (e.g., Genzel et al. 2010; Bothwell et al. 2013; Aravena et al. 2016, and references therein). The SFE of AzTEC/C159 is, however, similar to those of the very high-redshift starburst disk galaxies GN20 ( ~180 L⊙(K km s−1 pc2)−1; Carilli et al. 2010; Hodge et al. 2012) and J1000+0234 ( ~140 L⊙(K km s−1 pc2)−1; Schinnerer et al. 2008; Smolčić et al. 2015). Thus, while the extreme SFE of AzTEC/C159 seems unusual for a star-forming disk galaxy at z < 2, at z> 4, disk galaxies harboring vigorous SFE (such as AzTEC/C159, GN20, and J1000+0234) might be common.
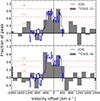 |
Fig. 2 [CII] 158 μm line spectrum of AzTEC/C159 (blue line; J17, K18) together with the 12CO(2 →1) and 12 CO(5 →4) detections from VLA and NOEMA, respectively. Each line is renormalized by its peak intensity. Red dashed lines show the typical noise level per channel. |
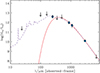 |
Fig. 3 Broadband SED of AzTEC/C159. The best-fit Draine & Li (2007) model is shown with the blue dashed line. A modified blackbody (red line) is used to fit the FIR-to-millimeter data points. The monochromatic flux densities from Herschel PACS/SPIRE and JCMT/AzTEC observations used in the fit are listed as follows: S100μm< 6.8 mJy, S160μm< 13.6 mJy, S250μm= 6.2 ± 1.9 mJy, S350μm< 10.8 mJy, S500μm< 20.4 mJy, and S1.1mm = 3.3 ± 1.3 mJy (Smolčić et al. 2015). We add three more submillimeter/millimeter data points from our observations: S870μm= 6.9 ± 0.2 mJy (GG18), S3mm = 220 ± 40μ Jy, and S7mm < 20μ Jy. The downward-pointing arrows denote upper limits to the corresponding flux densities. |
Properties of AzTEC/C159.
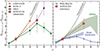 |
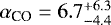
Fig. 4 Left panel: observed 12CO SLED of AzTEC/C159 and other z > 4 SMGs for comparison: GN20 (Carilli et al. 2010), AzTEC-3 (Riechers et al. 2010), and J1000+0234 (Schinnerer et al. 2008). Gray lines show the expected trend for thermalization, i.e., LTE conditions. The dashed and solid color lines connect the data points to illustrate the shape of the different 12 CO SLEDs. The line fluxes have been normalized to the 12CO(2 →1) line. Right panel: intrinsic 12CO SLED of AzTEC/C159. The observed flux densities for 12CO(2 →1) and 12 CO(5 →4) have been corrected up by 1/0.7 and 1/0.8, respectively, to take into account the CMB effect (see Sect. 4.1). We also present the 12CO SLED of the Milky Way galactic center (Fixsen et al. 1999), MS disk-galaxies at z ~ 1.5 (Daddi et al. 2015), and a sample of SMGs (median of z = 2.2, Bothwell et al. 2013); similarly, we normalize all the line fluxes to the 12CO(2 → 1) line. Shaded regions show the dispersion of the 12CO SLEDs for different SMGs and disk galaxies samples. |
4.4 Gas excitation
We combined our 12 CO(2 →1) and 12 CO(5 →4) line detections to obtain insights into the molecular gas excitation in AzTEC/C159. As mentioned before, at z ~ 4.5, the CMB emission affects the observed 12CO line flux density in both lines (da Cunha et al. 2013). This could modify the 12 CO(5 →4)/CO(2 →1) line brightness temperature ratio (r52) and in consequence, our interpretation. We first considered the observed line flux densities in AzTEC/C159 and compared its 12 CO SLED with those of some SMGs at z > 4, where the effect of the CMB might be considerable but no corrections have been applied yet. In Fig. 4 we plot the 12 CO SLED of J1000+0234 (Schinnerer et al. 2008) and GN20 (Carilli et al. 2010), both star-forming disk galaxies with extreme SFE. We also show the 12 CO SLED of AzTEC-3, a massive starburst galaxy possibly triggered by a major merger and associated with a protocluster at z = 5.3 (Riechers et al. 2010). All these 12 CO SLEDs are consistent with high gas excitation, where r52 = 0.63 ± 0.16 for AzTEC/C159.
The effect of the CMB on the 12CO SLED shape below z = 2.5 is negligible (da Cunha et al. 2013). In consequence, no corrections need to be made to the observed median 12 CO SLED of SMGs (median redshift of z = 2.2 as in Bothwell et al. 2013) and disk galaxies at z ~ 1.5 (Daddi et al. 2010). We applied corrections to the observed flux densities of AzTEC/C159 to mitigate potential bias due to the CMB emission (see Sect. 4.1), and compared its “intrinsic” 12 CO SLED with those of the aforementioned galaxy populations. As observed in Fig. 4, with r52 = 0.55 ± 0.15, the molecular gas excitation conditions of AzTEC/C159 are consistent with those observed in SMGs, and they significantly deviate from the expected trend for star-forming disk-like MS galaxies at z ~ 1.5 (Daddi et al. 2015) and the MW (Fixsen et al. 1999). The elevated 12CO SLED of AzTEC/C159 might be a result of intrinsic processes, such as elevated gas density and kinetic temperature, which yield a higher collision rate between 12CO and H2 (e.g., Narayanan & Krumholz 2014).
4.5 CO → H2 conversion factor
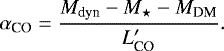
By determining the αCO value in AzTEC/C159, we can mitigate uncertainties on our gas mass estimates and at the same time infer the overall physical conditions of its molecular gas (e.g., Papadopoulos et al. 2012a,b). Here, we constrained αCO from (a) the gas-to-dust ratio (δGDR) and (b) the balance between the baryonic and dark matter content with the dynamical mass.
4.5.1 Gas-to-dust method
By assuming that the molecular component dominates the ISM, that is, 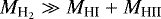 , the molecular gas mass can be estimated from the relation (e.g., Magnelli et al. 2012; Aravena et al. 2016)
 (3)
(3)
where δGDR is the gas-to-dust ratio relation constrained locally by Leroy et al. (2011), which varies with metallicity as log (δGDR) = 9.4 − 0.85 × [12 + log(O/H)]. In the absence of direct metallicity estimates for AzTEC/C159 and a robust mass-metallicity relation at such high redshift, we assumed that AzTEC/C159 has solar metallicity. Then, by combining Eqs. (1) and (3),
 (4)
(4)
In Sect. 4.1 we favored a scenario with dense gas and Tkin = 40 K to correct the observed  for the CMB effect. Here, we also explore the possibility of cool (Tkin = 14 K) and low-density molecular gas, that is, following da Cunha et al. (2013), we varied
  within the range [3.4 ± 0.6, 12.0 ± 2.2] × 1010 K km s−1 pc2. Based on
 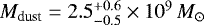 (derived in Sect. 4.2) and Eq. (4), we estimate
 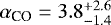 M⊙ K−1 km−1 s pc−2. Note that a lower value of δGDR could lower the estimated αCO, but it would require unlikely supra-solar metallicity. In contrast, sub-solar metallicities would yield even higher αCO.
4.5.2 Dynamical mass method
Another approach to constrain αCO is based on the estimation of the mass content, which should match the baryonic and dark matter content, that is, Mdyn = MISM + M⋆ + MDM. Since we assumed that the ISM is dominated by molecular gas, MISM ≃ MH2. In combination with Eq. (1), this leads to
 (5)
(5)
The [CII] 158 μm gas dynamics of AzTEC/C159 has been characterized in detail by J17. Via the tilted-ring fitting method, they find that at an intrinsic radius of 2.9 kpc  . This value agrees within the uncertainties with the value derived by K18 (Mdyn ~ 2.4 × 10¹¹M⊙) using the software 3D-Barolo and assuming an inclination angle of ~ 30 degs as in J17. Within an aperture radius of 2.9 kpc, we find that
 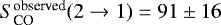 mJy, which is ~13% lower than that derived from the aperture that contains the full emission line (see Sect. 4.1). Consequently, as in the gas-to-dust ratio method, we consider
 ![$L'_{\text{CO}}\in[2.9\pm0.5,10.5\pm1.9]\times10^{10}$](/articles/aa/full_html/2018/07/aa32186-17/aa32186-17-eq36.png) K km s−1 pc2.
K km s−1 pc2.
GG18 have estimated the stellar mass of AzTEC/C159 ([4.5 ± 0.4] × 1010M⊙) using LePHARE (Arnouts et al. 1999; Ilbert et al. 2006) and adopting the Bruzual & Charlot (2003) stellar population synthesis models, a Chabrier (2003) IMF, and a exponentially declining star formation history (SFH). For this purpose, a substantial optical/near-IR dataset was used by GG18: the g, r, i, z, and y bands from the Subaru Hyper Suprime-Cam imaging (HSC, Tanaka et al. 2017), near-IR J, H, and Ks bands from the UltraVISTA DR3 survey (McCracken et al. 2012), and the MIR Spitzer/IRAC 3.6 and 4.5 μm bands from the Spitzer Large Area Survey with Hyper-Suprime-Cam (SPLASH, Capak et al. in prep.). As discussed in detail in GG18, this stellar mass estimate could be subject to a number of systematic uncertainties. For instance, if the stars formed in situ, it is possible that a fraction of the stellar light might be obscured by the dust and the stellar mass used here might therefore be underestimated1. GG18 have quantified the stellar mass fraction we might be missing by this effect using different prescriptions for the dust-to-stellar-mass ratio (DTS). By considering the ratio derived from simulations in Popping et al. (2017) of log (DTS) = −1.8, the stellar mass would increase by ~ 0.4 dex; on the other hand, the median DTS ratio for local ULIRGs log(DTS) = −2.83 (Calura et al. 2017) yields an increment of ~1.1 dex. The original estimate for the stellar mass (combined with the SFR of 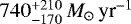 ) places AzTEC/C159 on the upper-end ofthe MS of SFGs at z ~ 4.5, as given by(Schreiber et al. 2015). An increase in stellar mass by ~ 0.4 dex would instead place AzTEC/C159 right on the MS of SFGs, while an increase by ~ 1.1 dex would lead to a very unlikely scenario in which AzTEC/C159 lies significantly below the MS. From this, we concludethat the stellar mass of AzTEC/C159 reported by GG18 might be underestimated by at most ~ 0.4 dex. By applying Eq. (5) and considering the original estimate for the stellar mass ([4.5 ± 0.4] × 1010 M⊙) from GG18, as well as a negligible dark matter component, we derive2
  M⊙ K−1 km−1 s pc−2. The addition of a 0.4 dex factor in the stellar mass (i.e., [1.0 ± 0.4] × 1011 M⊙) still yields a relatively high αCO value of
  M⊙ K−1 km−1 s pc−2.
Our two independent methods point toward a high value of αCO. This result agrees well with our previous assumption of αCO ~ 4.3M⊙ K−1 km−1 s pc−2. It is known that the most important influencing factor on αCO is the average dynamical state of the molecular gas. While low values are associated with unbound gas, as observed in local ULIRGs, high values are related with self-gravitating gas (e.g., Papadopoulos et al. 2012b); hence, the molecular gas dynamics in AzTEC/C159 might be more similar to that of local star-forming disks than those of disturbed major mergers.
5 Discussion
Molecular line observations toward AzTEC/C159 revealed a gas-rich system, elevated SFE, and high gas excitation. Its high αCO value is consistent with a self-gravitating molecular gas distribution (e.g., Papadopoulos et al. 2012a). In addition, [CII] 158 μm line observations have previously revealed a gas-dominated rotating disk extending up to a radius of ~3 kpc (J17). These dynamical properties do not fit the scenario of gas-rich galaxy mergers at high redshift driving tidal torques that form dense gas regions (a condition for high gas excitation) and trigger intense star formation activity (e.g., Hopkins et al. 2006; Hayward et al. 2011, 2012). Then, the question arises which physical mechanisms might be responsible for fueling and triggering such an extreme star formation environment in this gas-rich rotating disk galaxy at z = 4.5.
According to numerical simulations, massive rotating disk galaxies in the early Universe are a common phenomenon (e.g., Dekel et al. 2009b; Romano-Díaz et al. 2011). In overdense environments, the smooth infall and accretion of cold gas from cosmological filaments can build up a disk (Feng et al. 2015). This relatively smooth accretion, which dominates the mass input (Romano-Díaz et al. 2014; Anglés-Alcázar et al. 2017), can maintain an unstable dense gas-rich disk that breaks into giant clumps forming stars at a high rate (Dekel et al. 2009b). Such star formation activity might be enhanced through gravitational harassment, as advocated for the star-forming disk galaxy at z = 4.05 GN20 (Carilli et al. 2010; Hodge et al. 2012).
The latter scenario agrees with the high gas fraction and SFE of AzTEC/C159, but it is at odds with the high gas excitation condition commonly associated with major mergers (e.g., Bournaud et al. 2015). However, as predicted by Papadopoulos et al. (2012a), high-redshift disk-like systems with extreme SFE such as AzTEC/C159 might also have high gas excitation conditions as a result of heating by turbulence and/or cosmic rays. By z ~ 3, the mean radiation field intensity ⟨U⟩ in MS galaxies might become similar to that of local ULIRGs and their 12 CO SLEDs may look similar at this redshift (Daddi et al. 2015). We note that an elevated 12CO SLED couldalso be a result of AGN-driven mechanical and radiative feedback (Papadopoulos et al. 2008, 2010; Dasyra et al. 2014; Moser et al. 2016); but there is no robust evidence of an AGN in AzTEC/C159 (Smolčić et al. 2015).
It is difficult to draw a coherent conclusion on galaxy formation and evolution from this source alone. Nevertheless, AzTEC/C159 emerges as another gas-rich disk galaxy at z ~ 4 with high SFE and extreme 12CO SLED, together with J1000+0234 (Schinnerer et al. 2008, J17) and GN20 (Carilli et al. 2010; Hodge et al. 2012). This galaxy population complements our picture on galaxy evolution. In particular, Toft et al. (2017) suggested that these z > 4 SMGs with cool gas reservoirs distributed in rotating disks and with high SFE, might be the progenitors of massive quenched galaxies at z ~ 2 that surprisingly also exhibit a rotating disk (van der Wel et al. 2011; Newman et al. 2015). To confirm this, we need to exploit the synergy between ALMA and the upcoming James Webb Space Telescope, which promise a better understanding of the multi-phase gas and stellar properties of early systems.
6 Summary
We reported the molecular gas properties of the star-forming disk galaxy AzTEC/C159 at z = 4.567. Using 12 CO line observations of the transition levels J = 2 →1 and J = 5 →4 and extensive ancillary data from the COSMOS collaboration, we have found the following.
- 1.
The molecular gas mass of AzTEC/C159 is MH2(αCO∕4.3) = (1.5 ± 0.3) × 1011 M⊙, which yields a high gas fraction of
 . Its
. Its  ratio of (216 ± 80)
L⊙ (K km s−1 pc2)−1, that is, SFE, is comparable with that of local ULIRGs and SMGs (e.g., Aravena et al. 2016, and references therein).
ratio of (216 ± 80)
L⊙ (K km s−1 pc2)−1, that is, SFE, is comparable with that of local ULIRGs and SMGs (e.g., Aravena et al. 2016, and references therein). - 2.
The 12CO lines show tentative evidence of a double-peak line profile. Their FWHM is comparable to that of the [CII] 158 μm line (FWHM ~ 750 km s−1; J17, K18), which is consistent with an extended gas reservoir. However, the modest sensitivity and resolution of our observations prevent us from obtaining definitive constraints on the 12CO extent and dynamics of AzTEC/C159.
- 3.
The 12CO(5 → 4)∕CO(2 → 1) line brightness temperature ratio of r52 = 0.55 ± 0.15 is consistent with the high gas excitation of the star-forming disk galaxies GN20 (Carilli et al. 2010; Hodge et al. 2012) and J1000+0234 (Schinnerer et al. 2008, J17) at z > 4. In general, the 12CO SLED of AzTEC/C159 is similar to the median for SMGs (Bothwell et al. 2013) and significantly deviates from that for star-forming disk galaxies at z ~ 1.5 (Daddi et al. 2015).
- 4.
The CO → H2 conversion factor (αCO) for AzTEC/C159 is
 K−1 km−1 s pc−2
and
K−1 km−1 s pc−2
and  K−1 km−1 s pc−2, as givenby the dynamical and gas-to-dust method, respectively. This suggests that the conditions of the ISM in AzTEC/C159 would be consistent with those of local star-forming disks.
The intense star formation activity of AzTEC/C159 does not seem to be triggered by major mergers as other SMGs. Instead, its molecular gas conditions suggest that cold gas streams may fuel a gravitationally unstable gas-rich disk that harbors extreme SFE and high gas excitation. A population of high-redshift disk galaxies has been predicted by both numerical simulations and recent observational studies of quiescent rotating disk galaxies at z ~ 2, which are believed to be the descendants of AzTEC/C159-like galaxies.
Acknowledgements
We thank Ian Smail for his detailed comments and suggestions that helped to improve the manuscript. E.F.J.A would like to thank M. Krips for her support during the visit to IRAM/Grenoble and the hospitality of the DSOC in Socorro/New Mexico. Support for B.M. was provided by the DFG priority program 1573 “The physics of the interstellar medium”. G.C.J. is grateful for support from NRAO through the Grote Reber Doctoral Fellowship Program. E.F.J.A, B.M., A.K., E.R.D. and F.B. acknowledge support of the Collaborative Research Center 956, subproject A1 and C4, funded by the Deutsche Forschungsgemeinschaft (DFG). C.G.G and S.T. acknowledgesupport from the European Research Council (ERC) Consolidator Grant funding scheme (project ConTExt, grant number: 648179). D.R. acknowledges support from the National Science Foundation under grant number AST-1614213. M.A. acknowledges partial support from FONDECYT through grant 1140099. M.J.M. acknowledges the support of the National Science Centre, Poland through the POLONEZ grant 2015/19/P/ST9/04010; this project has receivedfunding from the European Union’s Horizon 2020 research and innovation programme under the Marie Skłodowska-Curie grant agreement No. 665778. V.S. acknowledges support from the European Union’s Seventh Frame-work program under grant agreement 337595 (ERC Starting Grant, “CoSMass”). The National Radio Astronomy Observatory (NRAO) is operated by Associated Universities, Inc., under cooperative agreement with the National Science Foundation. IRAM is supported by INSU/CNRS (France), MPG (Germany) and IGN (Spain).
References
- Abdo, A. A., Ackermann, M., Ajello, M., et al. 2010, ApJ, 710, 133 [NASA ADS] [CrossRef] [Google Scholar]
- Alaghband-Zadeh, S., Chapman, S. C., Swinbank, A. M., et al. 2012, MNRAS, 424, 2232 [NASA ADS] [CrossRef] [Google Scholar]
- Anglés-Alcázar, D., Faucher-Giguère, C.-A., Kereš, D., et al. 2017, MNRAS, 470, 4698 [NASA ADS] [CrossRef] [Google Scholar]
- Aravena, M., Spilker, J. S., Bethermin, M., et al. 2016, MNRAS, 457, 4406 [NASA ADS] [CrossRef] [Google Scholar]
- Aretxaga, I., Wilson, G. W., Aguilar, E., et al. 2011, MNRAS, 415, 3831 [NASA ADS] [CrossRef] [Google Scholar]
- Arnouts, S., Cristiani, S., Moscardini, L., et al. 1999, MNRAS, 310, 540 [NASA ADS] [CrossRef] [Google Scholar]
- Banerji, M., Chapman, S. C., Smail, I., et al. 2011, MNRAS, 418, 1071 [NASA ADS] [CrossRef] [Google Scholar]
- Barger, A. J., Wang, W.-H., Cowie, L. L., et al. 2012, ApJ, 761, 89 [Google Scholar]
- Baugh, C. M., Lacey, C. G., Frenk, C. S., et al. 2005, MNRAS, 356, 1191 [NASA ADS] [CrossRef] [Google Scholar]
- Blain, A. W., Smail, I., Ivison, R. J., Kneib, J.-P., & Frayer, D. T. 2002, Phys. Rep., 369, 111 [NASA ADS] [CrossRef] [Google Scholar]
- Bolatto, A. D., Wolfire, M., & Leroy, A. K. 2013, ARA&A, 51, 207 [Google Scholar]
- Bothwell, M. S., Smail, I., Chapman, S. C., et al. 2013, MNRAS, 429, 3047 [NASA ADS] [CrossRef] [Google Scholar]
- Bouché, N., Murphy, M. T., Kacprzak, G. G., et al. 2013, Science, 341, 50 [NASA ADS] [CrossRef] [Google Scholar]
- Bournaud, F., Daddi, E., Weiß, A., et al. 2015, A&A, 575, A56 [NASA ADS] [CrossRef] [EDP Sciences] [Google Scholar]
- Brisbin, D., Miettinen, O., Aravena, M., et al. 2017, A&A, 608, A15 [Google Scholar]
- Bruzual, G., & Charlot, S. 2003, MNRAS, 344, 1000 [NASA ADS] [CrossRef] [Google Scholar]
- Bussmann, R. S. et al. 2013, ApJ, 779, 25 [NASA ADS] [CrossRef] [Google Scholar]
- Capak, P., Carilli, C. L., Lee, N., et al. 2008, ApJ, 681, L53 [Google Scholar]
- Capak, P. L., Riechers, D., Scoville, N. Z., et al. 2011, Nature, 470, 233 [Google Scholar]
- Calura, F., Pozzi, F., Cresci, G., et al. 2017, MNRAS, 465, 54 [NASA ADS] [CrossRef] [Google Scholar]
- Carilli, C. L., & Walter, F. 2013, ARA&A, 51, 105 [NASA ADS] [CrossRef] [EDP Sciences] [Google Scholar]
- Carilli, C. L., Daddi, E., Riechers, D., et al. 2010, ApJ, 714, 1407 [NASA ADS] [CrossRef] [Google Scholar]
- Casey, C. M., Narayanan, D., & Cooray, A. 2014, Phys. Rep., 541, 45 [NASA ADS] [CrossRef] [Google Scholar]
- Chabrier, G. 2003, PASP, 115, 763 [NASA ADS] [CrossRef] [Google Scholar]
- Chapman, S. C., Blain, A. W., Smail, I., & Ivison, R. J. 2005, ApJ, 622, 772 [NASA ADS] [CrossRef] [Google Scholar]
- Coppin, K. E. K., Smail, I., Alexander, D. M., et al. 2009, MNRAS, 395, 1905 [NASA ADS] [CrossRef] [Google Scholar]
- da Cunha, E., Groves, B., Walter, F., et al. 2013, ApJ, 766, 13 [Google Scholar]
- Daddi, E., Dannerbauer, H., Krips, M., et al. 2009a, ApJ, 695, L176 [NASA ADS] [CrossRef] [Google Scholar]
- Daddi, E., Dannerbauer, H., Stern, D., et al. 2009b, ApJ, 694, 1517 [Google Scholar]
- Daddi, E., Bournaud, F., Walter, F., et al. 2010, ApJ, 713, 686 [NASA ADS] [CrossRef] [Google Scholar]
- Daddi, E., Dannerbauer, H., Liu, D., et al. 2015, A&A, 577, A46 [NASA ADS] [CrossRef] [EDP Sciences] [Google Scholar]
- Dasyra, K. M., Combes, F., Novak, G. S., et al. 2014, A&A, 565, A46 [NASA ADS] [CrossRef] [EDP Sciences] [Google Scholar]
- Davé, R., Finlator, K., Oppenheimer, B. D., et al. 2010, MNRAS, 404, 1355 [NASA ADS] [Google Scholar]
- De Breuck, C., Williams, R. J., Swinbank, M., et al. 2014, A&A, 565, A59 [NASA ADS] [CrossRef] [EDP Sciences] [Google Scholar]
- Dekel, A., Birnboim, Y., Engel, G., et al. 2009a, Nature, 457, 451 [NASA ADS] [CrossRef] [PubMed] [Google Scholar]
- Dekel, A., Sari, R., & Ceverino, D. 2009b, ApJ, 703, 785 [Google Scholar]
- Downes, D., & Solomon, P. M. 1998, ApJ, 507, 615 [NASA ADS] [CrossRef] [Google Scholar]
- Draine, B. T., & Li, A. 2007, ApJ, 657, 810 [NASA ADS] [CrossRef] [Google Scholar]
- Dwek, E., Staguhn, J. G., Arendt, R. G., et al. 2011, ApJ, 738, 36 [NASA ADS] [CrossRef] [Google Scholar]
- Engel, H., Tacconi, L. J., Davies, R. I., et al. 2010, ApJ, 724, 233 [NASA ADS] [CrossRef] [Google Scholar]
- Feng, Y., Matteo, T. D., Croft, R., et al. 2015, ApJ, 808, L17 [NASA ADS] [CrossRef] [Google Scholar]
- Ferrara, A., Viti, S., & Ceccarelli, C. 2016, MNRAS, 463, L112 [NASA ADS] [CrossRef] [Google Scholar]
- Fixsen, D. J., Bennett, C. L., & Mather, J. C. 1999, ApJ, 526, 207 [NASA ADS] [CrossRef] [Google Scholar]
- Frayer, D. T., Ivison, R. J., Scoville, N. Z., et al. 1998, ApJ, 506, L7 [NASA ADS] [CrossRef] [Google Scholar]
- Fudamoto, Y., Ivison, R. J., Oteo, I., et al. 2017, MNRAS, 472, 2028 [NASA ADS] [CrossRef] [Google Scholar]
- Genzel, R., Tacconi, L. J., Gracia-Carpio, J., et al. 2010, MNRAS, 407, 2091 [NASA ADS] [CrossRef] [Google Scholar]
- Gómez-Guijarro, C., Toft, S., Karim, A., et al. 2018, ApJ, 856, 121 [NASA ADS] [CrossRef] [Google Scholar]
- Harrington, K. C., Yun, M. S., Cybulski, R., et al. 2016, MNRAS, 458, 4383 [NASA ADS] [CrossRef] [Google Scholar]
- Harrington, K. C., Yun, M. S., Magnelli, B., et al. 2018, MNRAS, 474, 3866 [NASA ADS] [CrossRef] [Google Scholar]
- Hayward, C. C., Kereš, D., Jonsson, P., et al. 2011, ApJ, 743, 159 [CrossRef] [Google Scholar]
- Hayward, C. C., Jonsson, P., Kereš, D., et al. 2012, MNRAS, 424, 951 [NASA ADS] [CrossRef] [Google Scholar]
- Hayward, C. C., Narayanan, D., Kereš, D., et al. 2013, MNRAS, 428, 2529 [NASA ADS] [CrossRef] [Google Scholar]
- Hickox, R. C., Wardlow, J. L., Smail, I., et al. 2012, MNRAS, 421, 284 [NASA ADS] [Google Scholar]
- Hodge, J. A., Carilli, C. L., Walter, F., et al. 2012, ApJ, 760, 11 [Google Scholar]
- Hodge, J. A., Carilli, C. L., Walter, F., Daddi, E., & Riechers, D. 2013, ApJ, 776, 22 [NASA ADS] [CrossRef] [Google Scholar]
- Hopkins, P. F., Hernquist, L., Cox, T. J., et al. 2006, ApJS, 163, 1 [Google Scholar]
- Ikarashi, S., Ivison, R. J., Caputi, K. I., et al. 2015, ApJ, 810, 133 [NASA ADS] [CrossRef] [Google Scholar]
- Ilbert, O., Arnouts, S., McCracken, H. J., et al. 2006, A&A, 457, 841 [NASA ADS] [CrossRef] [EDP Sciences] [Google Scholar]
- Ivison, R. J., Lewis, A. J. R., Weiss, A., et al. 2016, ApJ, 832, 78 [NASA ADS] [CrossRef] [Google Scholar]
- Jones, G. C., Carilli, C. L., Shao, Y., et al. 2017, ApJ, 850, 180 [NASA ADS] [CrossRef] [Google Scholar]
- Kennicutt, J. R. C. 1998, ARA&A, 36, 189 [Google Scholar]
- Kereš, D., Katz, N., Davé, R., Fardal, M., & Weinberg, D. H. 2009a, MNRAS, 396, 2332 [NASA ADS] [CrossRef] [Google Scholar]
- Kereš, D., Katz, N., Fardal, M., Davé, R., & Weinberg, D. H. 2009b, MNRAS, 395, 160 [NASA ADS] [CrossRef] [Google Scholar]
- Knudsen, K. K., Kneib, J.-P., Richard, J., Petitpas, G., & Egami, E. 2010, ApJ, 709, 210 [NASA ADS] [CrossRef] [Google Scholar]
- Leroy, A. K., Bolatto, A., Gordon, K., et al. 2011, ApJ, 737, 12 [NASA ADS] [CrossRef] [Google Scholar]
- Leroy, A. K., Bolatto, A. D., Ostriker, E. C., et al. 2015, ApJ, 801, 25 [NASA ADS] [CrossRef] [Google Scholar]
- Lutz, D., Poglitsch, A., Altieri, B., et al. 2011, A&A, 532, A90 [NASA ADS] [CrossRef] [EDP Sciences] [Google Scholar]
- Magnelli, B., Saintonge, A., Lutz, D., et al. 2012, A&A, 548, A22 [NASA ADS] [CrossRef] [EDP Sciences] [Google Scholar]
- Martí-Vidal, I., Pérez-Torres, M. A., & Lobanov, A. P. 2012, A&A, 541, A135 [Google Scholar]
- McCracken, H. J., Milvang-Jensen, B., Dunlop, J., et al. 2012, A&A, 544, A156 [NASA ADS] [CrossRef] [EDP Sciences] [Google Scholar]
- Michałowski, M., Dunlop, J. S., Koprowski, M. P., et al. 2017, MNRAS, 469, 492 [NASA ADS] [CrossRef] [Google Scholar]
- Moser, L., Krips, M., Busch, G., et al. 2016, A&A, 587, A137 [NASA ADS] [CrossRef] [EDP Sciences] [Google Scholar]
- Narayanan, D., & Krumholz, M. R. 2014, MNRAS, 442, 1411 [NASA ADS] [CrossRef] [Google Scholar]
- Narayanan, D., Hayward, C. C., Cox, T. J., et al. 2010, MNRAS, 401, 1613 [NASA ADS] [CrossRef] [MathSciNet] [Google Scholar]
- Narayanan, D., Turk, M., Feldmann, R., et al. 2015, Nature, 525, 496 [NASA ADS] [CrossRef] [PubMed] [Google Scholar]
- Newman, A. B., Belli, S., & Ellis, R. S. 2015, ApJ, 813, L7 [NASA ADS] [CrossRef] [Google Scholar]
- Oliver, S. J., Bock, J., Altieri, B., et al. 2012, MNRAS, 424, 1614 [NASA ADS] [CrossRef] [EDP Sciences] [Google Scholar]
- Oteo, I., Ivison, R. J., Dunne, L., et al. 2016, ApJ, 827, 34 [NASA ADS] [CrossRef] [Google Scholar]
- Oteo, I., Ivison, R. J., Negrello, M., et al. 2017, ApJ, submitted [arXiv:1709.04191] [Google Scholar]
- Papadopoulos,P. P., Kovacs, A., Evans, A. S., & Barthel, P. 2008, A&A, 491, 483 [NASA ADS] [CrossRef] [EDP Sciences] [Google Scholar]
- Papadopoulos,P. P., van der Werf, P., Isaak, K., & Xilouris, E. M. 2010, ApJ, 715, 775 [NASA ADS] [CrossRef] [Google Scholar]
- Papadopoulos,P. P., van der Werf, P., Xilouris, E., Isaak, K. G., & Gao, Y., 2012a, ApJ, 751, 10 [NASA ADS] [CrossRef] [Google Scholar]
- Papadopoulos,P. P., van der Werf, P. P., Xilouris, E. M., et al. 2012b, MNRAS, 426, 2601 [NASA ADS] [CrossRef] [Google Scholar]
- Pilbratt, G. L., Riedinger, J. R., Passvogel, T., et al. 2010, A&A, 518, L1 [CrossRef] [EDP Sciences] [Google Scholar]
- Popping, G., Somerville, R. S., & Galametz, M. 2017, MNRAS, 471, 3152 [NASA ADS] [CrossRef] [Google Scholar]
- Riechers, D. A., Walter, F., Carilli, C. L., Bertoldi, F., & Momjian, E. 2008, ApJ, 686, L9 [NASA ADS] [CrossRef] [Google Scholar]
- Riechers, D. A., Capak, P. L., Carilli, C. L., et al. 2010, ApJ, 720, L131 [NASA ADS] [CrossRef] [Google Scholar]
- Riechers, D. A., Hodge, J., Walter, F., Carilli, C. L., & Bertoldi, F. 2011, ApJ, 739, L31 [NASA ADS] [CrossRef] [Google Scholar]
- Riechers, D. A., Bradford, C. M., Clements, D. L., et al. 2013, Nature, 496, 329 [Google Scholar]
- Riechers, D. A., Carilli, C. L., Capak, P. L., et al. 2014, ApJ, 796, 84 [NASA ADS] [CrossRef] [Google Scholar]
- Romano-Díaz, E., Choi, J.-H., Shlosman, I., & Trenti, M. 2011, ApJ, 738, L19 [NASA ADS] [CrossRef] [Google Scholar]
- Romano-Díaz, E., Shlosman, I., Choi, J.-H., & Sadoun, R. 2014, ApJ, 790, L32 [NASA ADS] [CrossRef] [Google Scholar]
- Sánchez Almeida, J., Elmegreen, B. G., Muñoz-Tuñón, C., & Elmegreen, D. M. 2014, A&ARv, 22, 71 [NASA ADS] [CrossRef] [Google Scholar]
- Sandstrom, K. M., Leroy, A. K., Walter, F., et al. 2013, ApJ, 777, 5 [NASA ADS] [CrossRef] [Google Scholar]
- Schinnerer, E., Carilli, C. L., Capak, P., et al. 2008, ApJ, 689, L5 [Google Scholar]
- Schinnerer, E., Groves, B., Sargent, M. T., et al. 2016, ApJ, 833, 112 [NASA ADS] [CrossRef] [Google Scholar]
- Schreiber, C., Pannella, M., Elbaz, D., et al. 2015, A&A, 575, A74 [NASA ADS] [CrossRef] [EDP Sciences] [Google Scholar]
- Scott, K. S. et al. 2008, MNRAS, 385, 2225 [NASA ADS] [CrossRef] [Google Scholar]
- Shao, Y., Wang, R., Jones, G. C., et al. 2017, ApJ, 845, 138 [NASA ADS] [CrossRef] [Google Scholar]
- Simpson, J. M., Swinbank, A. M., Smail, I., et al. 2014, ApJ, 788, 125s [Google Scholar]
- Smolčić, V., Capak, P., Ilbert, O., et al. 2011, ApJ, 731, L27 [NASA ADS] [CrossRef] [Google Scholar]
- Smolčić, V., Karim, A., Miettinen, O., et al. 2015, A&A, 576, A127 [NASA ADS] [CrossRef] [EDP Sciences] [Google Scholar]
- Steinhardt, C. L., & Speagle, J. S. 2014, ApJ, 796, 25 [NASA ADS] [CrossRef] [Google Scholar]
- Strandet, M. L., Weiss, A., Vieira, J. D., et al. 2016, ApJ, 822, 80 [NASA ADS] [CrossRef] [Google Scholar]
- Swinbank, A. M., Simpson, J. M., Smail, I., et al. 2014, MNRAS, 438, 1267 [Google Scholar]
- Symeonidis, M., Vaccari, M., Berta, S., et al. 2013, MNRAS, 431, 2317 [NASA ADS] [CrossRef] [Google Scholar]
- Tacconi, L. J., Neri, R., Chapman, S. C., et al. 2006, ApJ, 640, 228 [NASA ADS] [CrossRef] [Google Scholar]
- Tacconi, L. J., Genzel, R., Smail, I., et al. 2008, ApJ, 680, 246 [NASA ADS] [CrossRef] [PubMed] [Google Scholar]
- Tanaka, M., Hasinger, G., Silverman, J. D. et al. 2017, ArXiv e-print [arXiv:1706.00566] [Google Scholar]
- Toft, S., Smolčić, V., Magnelli, B., et al. 2014, ApJ, 782, 68 [NASA ADS] [CrossRef] [Google Scholar]
- Toft, S., Zabl, J., Richard, J., et al. 2017, Nature, 546, 510 [NASA ADS] [CrossRef] [Google Scholar]
- van der Wel, A., Rix, H.-W., Wuyts, S., et al. 2011, ApJ, 730, 38 [NASA ADS] [CrossRef] [Google Scholar]
- Walter, F., Riechers, D., Cox, P., et al. 2009, Nature, 457, 699 [NASA ADS] [CrossRef] [PubMed] [Google Scholar]
- Walter, F., Decarli, R., Carilli, C., et al. 2012, Nature, 486, 233 [NASA ADS] [CrossRef] [Google Scholar]
- Weiss, A., Walter, F., & Scoville, N. Z. 2005, A&A, 438, 533 [NASA ADS] [CrossRef] [EDP Sciences] [Google Scholar]
- Weiss, A., Downes, D., Walter, F., & Henkel, C. 2007, in From Z-Machines to ALMA: (Sub)Millimeter Spectroscopy of Galaxies, eds. A. J. Baker, J. Glenn, A. I. Harris, J. G. Mangum, & M. S. Yun, ASP Conf. Ser., 375, 25 [NASA ADS] [Google Scholar]
- Wuyts, S., Cox, T. J., Hayward, C. C., et al. 2010, ApJ, 722, 1666 [NASA ADS] [CrossRef] [Google Scholar]
- Yun, M. S., Scott, K. S., Guo, Y., et al. 2012, MNRAS, 420, 957 [NASA ADS] [CrossRef] [Google Scholar]
Observations with high spatial resolution rest-frame UV/optical/FIR are required to map the dust and stellar light distribution and better constrain the stellar mass of AzTEC/C159. This would also allow exploring multiple interacting components (and not a massive single component) that might fit into a merger-driven star formation scenario.
A highly conservative error bar for
Mdyn
of 1 dex has been suggested by J17 to take into account systematic uncertainties of the method, that is,
 . This wide range for
Mdyn also affords a wider range of inclination angles. We derive
. This wide range for
Mdyn also affords a wider range of inclination angles. We derive
 M⊙K−1 km−1 s pc−2. Thus, it remains true that
αCO is still higher than the prescription for ULIRGs-like systems (αCO = 0.8M⊙K−1 km−1
s pc−2 ).
M⊙K−1 km−1 s pc−2. Thus, it remains true that
αCO is still higher than the prescription for ULIRGs-like systems (αCO = 0.8M⊙K−1 km−1
s pc−2 ).
All Tables
All Figures
|
Fig. 1 Upper panels: velocity-integrated intensity maps of the 12CO(2 →1) and 12 CO(5 →4) line. We integrated emission within the velocity range of ± 750 km s−1, i.e. about 8 channels, where significant line emission was detected. The contour levels of the 12 CO(2 →1) line emissionmap are at [−2, 2, 3, 4] × 1σ, with σ = 0.05 mJy beam−1 per 200 km s−1 wide channel. Negative contours are shown in white and positive contours in blue. The beam size of 1.70 × 1.24 arcsec is plotted in the bottom left corner. The blue cross denotes the peak position of the [CII] 158 μm emission line. In the right panel we show the velocity-integrated intensity map of the 12 CO(5 →4) line emission. Contour levels are at [−3, 3, 4, 5, 6] × 1σ, with σ = 0.13 mJy beam−1 per 200 km s−1 wide channel. The beam size of 5.0 × 2.6 arcsec is alsoplotted in the bottom left corner. Lower panels: 12CO(2 →1) and 12 CO(5 →4) line spectra binned to 200 km s−1 channels. The red solid lines are Gaussian fits to the line spectra, the central position is shown by the red dashed lines. The blue error bar denotes the typical 1σ rms value. |
| In the text | |
|
Fig. 2 [CII] 158 μm line spectrum of AzTEC/C159 (blue line; J17, K18) together with the 12CO(2 →1) and 12 CO(5 →4) detections from VLA and NOEMA, respectively. Each line is renormalized by its peak intensity. Red dashed lines show the typical noise level per channel. |
| In the text | |
|
Fig. 3 Broadband SED of AzTEC/C159. The best-fit Draine & Li (2007) model is shown with the blue dashed line. A modified blackbody (red line) is used to fit the FIR-to-millimeter data points. The monochromatic flux densities from Herschel PACS/SPIRE and JCMT/AzTEC observations used in the fit are listed as follows: S100μm< 6.8 mJy, S160μm< 13.6 mJy, S250μm= 6.2 ± 1.9 mJy, S350μm< 10.8 mJy, S500μm< 20.4 mJy, and S1.1mm = 3.3 ± 1.3 mJy (Smolčić et al. 2015). We add three more submillimeter/millimeter data points from our observations: S870μm= 6.9 ± 0.2 mJy (GG18), S3mm = 220 ± 40μ Jy, and S7mm < 20μ Jy. The downward-pointing arrows denote upper limits to the corresponding flux densities. |
| In the text | |
|
Fig. 4 Left panel: observed 12CO SLED of AzTEC/C159 and other z > 4 SMGs for comparison: GN20 (Carilli et al. 2010), AzTEC-3 (Riechers et al. 2010), and J1000+0234 (Schinnerer et al. 2008). Gray lines show the expected trend for thermalization, i.e., LTE conditions. The dashed and solid color lines connect the data points to illustrate the shape of the different 12 CO SLEDs. The line fluxes have been normalized to the 12CO(2 →1) line. Right panel: intrinsic 12CO SLED of AzTEC/C159. The observed flux densities for 12CO(2 →1) and 12 CO(5 →4) have been corrected up by 1/0.7 and 1/0.8, respectively, to take into account the CMB effect (see Sect. 4.1). We also present the 12CO SLED of the Milky Way galactic center (Fixsen et al. 1999), MS disk-galaxies at z ~ 1.5 (Daddi et al. 2015), and a sample of SMGs (median of z = 2.2, Bothwell et al. 2013); similarly, we normalize all the line fluxes to the 12CO(2 → 1) line. Shaded regions show the dispersion of the 12CO SLEDs for different SMGs and disk galaxies samples. |
| In the text | |
Current usage metrics show cumulative count of Article Views (full-text article views including HTML views, PDF and ePub downloads, according to the available data) and Abstracts Views on Vision4Press platform.
Data correspond to usage on the plateform after 2015. The current usage metrics is available 48-96 hours after online publication and is updated daily on week days.
Initial download of the metrics may take a while.