| Issue |
A&A
Volume 615, July 2018
|
|
|---|---|---|
| Article Number | A108 | |
| Number of page(s) | 11 | |
| Section | Astrophysical processes | |
| DOI | https://doi.org/10.1051/0004-6361/201730908 | |
| Published online | 23 July 2018 | |
Exploring the shape of the γ-ray spectrum around the “π0-bump”
1
Max-Planck-Institut für Kernphysik,
PO Box 103980,
69029
Heidelberg,
Germany
e-mail: This email address is being protected from spambots. You need JavaScript enabled to view it.
2
Dublin Institute for Advanced Studies,
31 Fitzwilliam Place,
Dublin 2,
Ireland
3
MEPhI,
Kashirskoe shosse 31,
115409
Moscow,
Russia
Received:
31
March
2017
Accepted:
20
March
2018
Abstract
The “pion-decay” bump is a distinct signature of the differential energy spectrum of γ-rays between 100 MeV and 1 GeV produced in hadronic interactions of accelerated particles (cosmic rays) with the ambient gas. We use recent parametrisations of relevant cross-sections to study the formation of the “pion-decay” bump. The γ-ray spectrum below the maximum of this spectral feature can be distorted because of contributions of additional radiation components, in particular, due to the bremsstrahlung of secondary electrons and positrons, the products of decays of π±-mesons, accompanying the π0-production. At energies below 100 MeV, a non-negligible fraction of γ-ray flux could originate from interactions of sub-relativistic heavy ions. We study the impact of these radiation channels on the formation of the overall γ-ray spectrum based on a time-dependent treatment of evolution of energy distributions of the primary and secondary particles in the γ-ray production region.
Key words: radiation mechanisms: non-thermal / gamma rays: ISM
© ESO 2018
1 Introduction
Cosmic rays (CRs) produce high-energy γ-rays via hadronic interactions with the ambient gas. The neutral π0 mesons appearing in these collisions promptly decay into two γ-ray photons each having an energy of  MeV (in the rest frame of the pion). The γ-rays are symmetrically distributed around 67.5 MeV in the log energy scale. The broad-band γ-ray spectra resulting from these processes have been studied in various astrophysical environments such as solar flares, interstellar medium, supernova remnants (SNRs), molecular clouds, galaxy clusters, etc. (Murphy et al. 1987; Pfrommer & Enßlin 2004; Ohira et al. 2012). The spectral energy distribution (SED) of this radiation,
  , has a distinct bell-type feature (“π0-decay bump”) between 100 MeV and a few GeV (Stecker 1971). The shape and the position of the maximum of this feature depends on the spectral index α of the energy distribution of parent protons and nuclei1. In particular, the bump disappears completely for α < 2. The π0-decay bump, which has been claimed to be detected by the AGILE and Fermi- LAT collaborations towards several mid-aged SNRs (Giuliani et al. 2010, 2011; Ackermann et al. 2013; Tavani et al. 2010), is generally interpreted as evidence for acceleration of cosmic-ray protons and nuclei in SNRs. This spectral feature, however, does not appear in a “pure” form. A significant fraction of the γ-ray flux in this energy range can be contributed by the bremsstrahlung of primary (directly accelerated) electrons. This could happen, in particular, in the environments with the CR electron to proton ratio e∕p ≥ 0.1 (see, e.g., Aharonian 2004). Moreover, even when the acceleration is strongly dominated by the hadronic component of CRs, the production of secondary electrons and positrons and their consequent radiation in the γ-ray band is unavoidable. The contribution of these radiation channels depends on the density of the ambient gas, n, and the confinement time of CRs, T. It achieves its maximum (the “saturation”) when the product n × T ≃ 5 × 10¹⁵s cm−3 (see below). Depending on the spectrum of CR nuclei and their composition, a non-negligible contribution to γ-rays below 100 MeV is expected also from the reactions induced by subrelativistic nuclei. In this paper, we study the relative contributions of these radiation channels to the formation of the overall γ-ray spectrum in the region of theπ0-decay bump.
2 Time-dependent energy distribution of particles
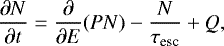
The evolution of relativistic particles in a given volume is described by the kinetic equation (see e.g., Ginzburg & Syrovatskii 1964)
 (1)
(1)
where 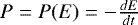 is the energy loss rate and τesc is the characteristic escape time. For simplicity, in the following discussion we neglect the particle escape from the γ-ray production region. The escape of CRs from their acceleration sites is far from being understood; it strongly depends on the diffusion coefficient which in the γ-ray production region is a highly unknown parameter. Generally, for low energies, this could be a good approximation given the slow diffusion near the CR sources and the age of the accelerator. For example, in a source of size R ~ 10 pc, the escape time is estimated to be tesc ~ R2∕3D ≥ 105 yr, assuming that the diffusion coefficient at subrelativistic energies does not exceed 1026 cm2 s−1. In any case, the ignorance of the particle escape gives upper limits on the contribution of secondary electrons to the overall γ-ray flux.
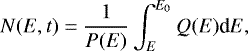
For continuous injection Q(E, t) = Q(E), the solution of the kinetic equation becomes
 (2)
(2)
where E0 is found by solving the characteristic equation for the given epoch t,  .
.
For protons, the dominant cooling mechanisms are the nuclear interactions and the ionisation losses. The nuclear interactions dominate above 1 GeV and can be characterised as Pnuc = E∕τpp, where E is the proton energy and τpp is the nuclear interaction loss timescale determined by the total inelastic cross-section σpp and the inelasticity κ. For proton energies above 1 GeV, σpp ~ 30 mb and κ ~ 0.45; both only slightly depend on energy. Then τpp can be expressed as  yr. The ionisation losses dominate in the low-energy domain. The energy loss rate Pion is proportional to the ambient gas density. At high energies Pion is energy independent, whereas, at low energies, between 1 MeV and 1 GeV, the Pion scales as 1∕β, where β = v∕c. Convenient analytical presentations for ionisation losses can be found, for example, in Gould (1972). The injection spectra are assumed to be power laws in momentum with indexes 2.0 and 2.85, that is,
 (3)
(3)
where E is the protons total energy, p is the proton momentum, and β is the proton velocity in units of c. Figure 1 shows the derived proton distributions at different epochs. We note that for
 (4)
(4)
the evolution of protons saturates, and therefore the source of age T operates as a calorimeter. The established (“steady-state”) density of CRs can be estimated as N ~ Q tcool. We note that for both nuclear and ionisation losses, the loss timescales are inversely proportional to the ambient gas density, therefore n × T is the only quantity to determine whether the system saturates or not. For the dense clouds with the gas number density of 100− 1000 cm−3, the characteristic time T for saturation is about 105−106 yr. At low energies, a partial saturation, depending on the diffusion coefficient, can be achieved in these dense structures. On the other hand, in the ISM, where n ~ 1 cm−3, the required time T for saturation isabout 108 yr, which is much longer than the confinement time of the CRs inside the Galaxy. On the other hand, in the giant halo surrounding the Galaxy, the gas density is much lower, however the confinement time can be much larger. This may set more favoured conditions for saturation in the halo rather than in the galactic disk (see e.g., Taylor et al. 2014).
The combination of ionisation and nuclear loses results in a formation of a break in the particle spectrum during its evolution. In particular, at the stage of saturation, for the power law injection spectrum Q ∝ E−Γ and the energy lose rate depending on the energy as P = dE∕dt ∝ Eα, the power-law index of the resulted proton spectrum becomes Γ′ = Γ + α − 1 (see Eq. (4)). At high energies, when the nuclear interactions dominate, the energy loss rate is approximately proportional to the proton energy, Pnuc ~ E, thus the nuclear interactions practically do not change the injection spectrum of protons. This is seenin Fig. 1, where at energies above 1 GeV the saturated proton spectrum keeps the initial power-law index. At energies below 1 GeV, ionisation losses for which α ≈ 0 are more important. Consequently, Γ′≈Γ − 1.
The differences in the uncooled and saturated proton spectra at low energies are transferred to the spectra of γ-rays. The impact of this effect, however, is rather small, as can be seen in Fig. 2. This is explained by the close location of the cooling break in the proton spectrum around 1 GeV to the kinematic threshold of production of π0 -mesons at 300 MeV. We note that the difference between the γ-ray spectra formed in the uncooled and saturation proton regimes is also small at high energies, E ≥ 10 GeV (see Fig. 2), but for a different reason. In the uncooled regime, the γ-ray emission is harder than that of the parent protons due to the increase of the total π0 -decay cross-section with energy. In the saturated regime, however, the proton spectrum should be slightly softer than the uncooled (injected) proton spectrum. This softening is caused by the same energy dependence of the cooling rate, which is proportional to the total inelastic p–p cross-section. Such a softening compensates, to a large extent, the spectral hardening in the γ-ray production.
Although Fig. 2 demonstrates a rather weak time-evolution of the energy spectra of π0 -decay γ-rays, we should note that it is true only in the case of an effective confinement of protons in the γ-ray production region, that is, when tpp ≤ tesc. Otherwise, the energy-dependent escape would lead to a strong evolution of the proton spectrum; this will be reflected in the spectra of secondary γ-rays.
The steady-state distributions of electrons and positrons are also described by Eq. (2). However, their cooling is caused, in addition to the ionisation losses, by the synchrotron, bremsstrahlung and the Inverse Compton (IC) radiation channels. Below, we fix the ambient gas density and the magnetic field to the values 100 cm−3 and 10 μG, respectively.The Interstellar radiation fields are assumed to comprise three components: (1) the 2.7 K CMB with an energy density of 0.24 eV cm−3, (2) the optical/UV field modelled as a grey-body component with an energy density of 2 eV cm−3 and temperatureof 5000 K and (3) the IR component which is modelled as a grey-body component with an energy density of 1 eV cm−3 and temperatureof 100 K. The time evolution of the spectrum of secondary electrons is shown in Fig. 3 assuming a constant injection rate of parent protons with a spectrum normalised to the energy density of 1 eV cm−3 above 1 GeV. The electron spectrum saturates when n × T exceeds 1015 s cm−3.
For the chosen parameters, the energy losses of electrons in the energy interval between several 100 MeV to several 100 GeV, are dominated by bremsstrahlung. Since the energy-loss rate of bremsstrahlung is nearly energy independent, the saturated secondary electrons and positrons have the same spectral shape as the parent protons. Below several hundred MeV, the ionisation losses start to dominate which results in a low-energy break in the electron spectrum. We also plot the saturated spectrum of primary electrons, the injection spectrum of which is assumed to be a power law (in momentum). The saturated primary electron spectrum also has a low-energy break, but shallower than that in the spectrum of secondary electrons; the break in the primary spectrum is caused by the ionisation losses, while the break in the spectra of secondaries is caused by both the ionisation losses and the injection spectrum from the charged pion decays.
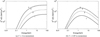 |
Fig. 1 Energy distributions of CR protons at different epochs characterised by the parameter n × T values (in unit cm−3s): 3 × 10¹⁴ (curve 1), 1015 (curve 2), 5 × 10¹⁵ (curve 3), 1016 (curve 4). The left panel is for the proton injection spectrum with an index of 2, and the right panel for the index 2.85 (in momentum). The normalisations are arbitrary. |
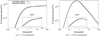 |
Fig. 2 γ-ray emissivities (in the form of SED) for the uncooled and saturated CR protons. The number density of the ambient gas is taken n = 1 cm−3. The proton distributions are normalised in a way that the energy density above T = 1 GeV is equal to 1 eV cm−3. The inserted figures are the zoomed SEDs in the maximum region between 0.1 and 10 GeV. |
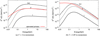 |
Fig. 3 Time evolution of distributions of the secondary electrons (black curves) calculated for different values of n × T (in unit cm−3 s): 1013 (curve 1), 1014 (curve 2), 1015 (curve 3), and 3 × 10¹⁵ (curve 4). The parent proton densities are normalised such that the energy density above 1 GeV is 1 eV cm−3. The saturated spectra for primary electrons (red curves) are also shown. The primary electrons are assumed to have the same spectrum as the parent protons, and the e∕p ratio of 0.01at injection. |
3 γ-ray production in hadronic processes
3.1 Cross-sections
The calculations of γ-ray spectrum near the pion-decay bump require good knowledge of the π0 production cross-sections at the proton–proton, proton–nucleus, and nucleus–nucleus interactions. The theoretical predictions of these cross-sections are limited by the presence of non-perturbative processes. Therefore different phenomenological treatments have been discussed in the literature. At high energies, convenient and comprehensive parametrisations of the cross-sections for the production of γ-rays, electrons and neutrinos have been proposed by Kelner et al. (2006). This parametrisation, however, is not designed for precise calculations at low energies, in particular near the kinematic threshold of π-production. Recently, a new parametrisation for production of γ-rays in a broader energy range of pp interactions, from the kinematic threshold to PeV energies, has been proposed by Kafexhiu et al. (2014). Most importantly, this parametrisation allows accurate description of experimental data in the most relevant energies for the formation of the bump region, below Tp < 2 GeV. At such low energies, the previous parametrisations (Stecker 1973; Dermer 1986a; Kamae et al. 2006) show significant deviations from the experimental data (Kafexhiu et al. 2014). At higher energies, the parametrisation of these latter authors offers a choice of switching between different hadronic models to account for the uncertainties in the experimental data. This parametrisation smoothly connects the low- and high-energy regions.
Although, the process pp → π0 → 2γ is the dominant γ-ray production channel, the secondary electrons can significantly contribute to the overall γ-radiation, especially below 100 MeV. These secondary electrons are included in the parametrisations of Kelner et al. (2006) and Kamae et al. (2006), however, they do not provide adequate accuracies at low energies, Tp < 0.5 GeV. Meanwhile, this is the most important energy interval for contribution of the bremsstrahlung of secondary electrons to the γ-ray spectrum below the π0 -decay bump. Below we present our calculations of e± production based on the cross-sections from the Geant4 toolkit (Agostinelli et al. 2003; Allison et al. 2006). We adopt here the FTFP_BERT hadronic interaction model that implements the Bertini-style cascade model at low and intermediate energies, Tp ≤ 5 GeV, and the FRITIOF string model at higher energies. To make the computations of the secondary e± spectra rather convenient, we parametrise the π-meson production differential cross-section in the following form:
 (5)
(5)
where  ; Tπ and
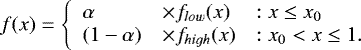
  are the π-meson kinetic energy and its maximum kinetic energy (in the laboratory frame), respectively, and σπ is the total cross-section of the corresponding channel of pion production. The function f(x) is the normalised pion energy distribution, that is, the integral of f(x) from 0 to 1 is set to be one. In Appendix A, we offer a convenient presentation of this function.
The experiment data of integrated cross-sections of different channels of pion production at kinetic energies of protons Tp ≤ 2 GeV are shown in Fig. 4. For higher energies, we use the parametrisation based on the approximation of the pion average multiplicity using experimental data from Golokhvastov (2001). For this parametrisation, the pion average yield is expressed as  , where
  and
and  . Here s is the total centre of mass energy squared and mp is the proton mass. The cross-sections are calculated as
  where σpp is the inelastic pp cross-section given in Kafexhiu et al. (2014); ε = 0, 1/3 or 2/3 for π−, π0, and π+, respectively.
The experimental cross-sections of π-meson production at low energies taken from Machner & Haidenbauer (1999), Skorodko et al. (2009), and Kafexhiu et al. (2014), are shown in Fig. 1, together with the parameterisations presented in Appendix A. It is seen that the π− production cross-section below 2 GeV is very small compared to the production of positive and neutral pions. This because the negative pions are not produced through the pp →Δ(1232)-resonance.
The positrons and electrons are produced at decays of the secondary π-mesons. The kinematics of such reactions are described in Scanlon & Milford (1965), Dermer (1986a), and Kelner et al. (2006). Figure 5 shows the positron energy distributions calculated for Tp = 0.3 and 0.6 GeV. The histograms represent the results of Geant4 Monte Carlo simulations, while the solid curves represent the parametrisations of this work. For comparison, the parametrisation of Kamae et al. (2006) for Tp = 0.6 GeV is shown as well. One can see that at energies of positrons less than 0.1 GeV, the parametrisation of Kamae et al. (2006) significantly deviates from the Geant4 simulations. Figure 6 shows the secondary e± and γ-ray production spectra at different kinetic energies of the incident proton obtained from Geant4 Monte Carlo simulations.
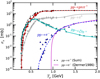 |
Fig. 4 π-meson production cross-sections as a function of incident proton kinetic energy Tp < 2 GeV. The most important channels for π+-meson production are the pp → pnπ+ (red line) and the pp → Dπ+ (cyan line) channels. The experimental data points are from Machner & Haidenbauer (1999); the black dash line shows the total pp→ π+ cross-section. The cross-sections for the pp → π0 and pp → π− reactions are shown with grey and blue colours, respectively. The parametrisation for the pp → π0 and the respective compiled data are taken from Kafexhiu et al. (2014). The experimental data for pp → π− and the eye-guiding blue dash line are taken from Skorodko et al. (2009). For comparison, the Dermer (1986b) parametrisation for pp → π− cross-section is also shown. This parametrisation describes well the high-energy data, however, below Tp < 1 GeV it deviates significantly from measurements. |
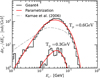 |
Fig. 5 Energy distribution of secondary positrons for incident proton energies Tp ≈ 0.3 and 0.6 GeV. The histograms are obtained from simulations using the Geant4 tools, while the red lines correspond to parametrisations for π-meson production given by Eq. (A.1) of Appendix A. The grey long dashed line is calculated using the parametrisation of Kamae et al. (2006) for Tp ≈ 0.6 GeV. |
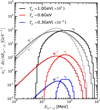 |
Fig. 6 Normalised differential energy distributions of electrons, positrons, and γ-rays as products of decays of π-mesons for three different energies of the incident protons Tp = 0.3, 0.6, and 1 GeV computed using Geant4. At low energies, the electron production is severely suppressed (the corresponding curves do not appear on the plot), while at Tp = 1 GeV the contributions of electrons and positrons become comparable. The label on the top of each histogram shows the relevant channels. |
3.2 Contribution from heavy nuclei
The nuclei heavier than hydrogen can significantly contribute to the formation of the γ-ray spectrum. The production of secondary particles from high-energy interactions can be described in terms of Glauber’s multiple scattering theory (Glauber 1955; Franco & Glauber 1966; Glauber & Matthiae 1970). In this model, the nuclear interactions are considered as a sequence of binary nucleon–nucleon collisions. Correspondingly, the energy distributions of secondary particles areapproximated by functions relevant to the nucleon–nucleon interactions. Therefore, for the treatment of γ-rays produced atinteractions of Galactic CR protons and nuclei with the interstellar gas, typically the emissivity of γ-rays from pp interactions is multiplied by the so-called nuclear enhancement factor κ ≈ 1.5−1.8 (Cavallo & Gould 1971; Stephens & Badhwar 1981; Dermer 1986b; Mori 2009; Kafexhiu et al. 2014).
At lower (subrelativistic) energies, the nuclear interactions can no longer be treated as a sequence of binary nucleon–nucleon interactions.In particular, the collective effects, among other things, allow the nucleons inside the nucleus to produce secondary particles at energies below the kinematic thresholds of the pion production (see e.g., Cassing et al. 1990; Metag 1993). Despite the lack of a self-consistent theory of the subthreshold pion production, the cross-sections of many heavy ion reactions are well studied experimentally (Cassing et al. 1990; Metag 1993). Recently, these cross-sections have been parametrised by simple analytical expressions (Kafexhiu 2016). In Fig. 7 the available experimental data are shown together with parametrisations of the neutral pion production cross-sections for p–4 He, p–12 C, and 12C–12C interactions.In addition to γ-rays from the decays of “subthreshold” π0-mesons, at low energies, typically between 30 and 100 MeV, a γ-ray continuum is formed through the so-called direct hard photon channel (see e.g., Cassing et al. 1990; Metag 1993). For the typical CR spectra and the cosmic abundances, the contribution of these two mechanisms below 100 MeV does not exceed 10% (when compared to the extension of the spectrum of γ-rays from the “nominal” π0 production). However in the case of “heavy” compositions of both CRs and the ambient gas dominated by nuclei, these processes could play a non-negligible role in the formation of the overall γ-ray spectrum below 100 MeV. The cross-sections for hard photon production are parametrised by Kafexhiu (2016).
In astrophysical environments, the accelerated particles are generally described by a power-law distribution either in kinetic energy or in momentum. At relativistic energies these two presentations essentially coincide. We note that at these energies the spectrum of γ-rays from the decay of π0 -mesons almost mimics the spectrum of parent particles. In particular, the γ-ray spectrum also behaves as a power-law, but because of the slight increase of the π0 production cross-section, it appears to be slightly harder. Namely, over the energy interval of a few decades, αγ = αp + Δα, with Δ α ≈ 0.1. On the other hand, the γ-ray spectrum around the π0-bump strongly depends on the spectrum of parent particles at low energies. This can be seen in Fig. 8 where the γ-ray emissivities are shown. The curves in Fig. 8 correspond to three spectra of accelerated protons: power-law in momentum with αp = 2.0 and 2.85, and in kinetic energy with αp = 2.85. The sharpest distribution in the bump region appears in the case of the proton spectrum  . This is naturally explained by the excess of non-relativistic protons below 1 GeV. On the other hand, in the case of the hard proton distribution like p−2 (or harder), the bump in the γ-ray SED disappears completely.
At heavy nuclear interactions, the π0 -decay bump in the γ-ray spectrum is similar but not identical to the analogous feature in the spectrum of γ-rays from pp interactions. This is seen in Fig. 9 where the spectrum of γ-rays produced in pp interactions is compared with the spectrum of γ-rays produced at interactions when both the projectile and target particles are the same 16O nucleus. The difference is not dramatic (within 20%) above 100 MeV, although the differential cross-sections of production of π0 -mesons in pp and 16O16O interactions deviates significantly (up to by factor of three) at lowest energies. This is because the integrated γ-ray spectrum from the decay process of π0-mesons smears out most of the difference in the spectrum of the π0-mesons. At low energies, the additional contributions from the “hard photon” continuum and “sub threshold π0 -meson” production channels can be significant, especially in the case of a steep energy distribution of projectiles extending down to 100 MeV nuc−1. In Fig. 10, the calculations are performed for the power-law spectrum in kinetic energy of 16O (the power-law index 2.85) using the following normalisations: the kinetic energy density of the 16O nuclei above 1 GeV nuc−1, wO = 1 eV cm−3 and the number density of the target 16O nuclei nO = 1 cm−3. Generally, the chemical composition of the diffuse gas is dominated by atomic or molecular hydrogen. However, in some environments the heavy nuclei can dominate over the hydrogen. For example, this is the case of the young supernova remnant Cas A where the gas consists of heavy elements, especially of oxygen (Willingale et al. 2003). It seems natural to expect that CRs accelerated in the shell of this supernova remnant will be dominated by 16O as well, especially in the reverse shock region (see, e.g., Zirakashvili et al. 2014). Therefore, the calculations shown in Fig. 10 present not only an academic interest but could be realised in certain astrophysical scenarios.
The contributions of the “hard photon” continuum and the “sub-threshold” π0 -decay γ-rays is dramatically reduced when protons dominated over nuclei both in the projectile and target particles. This is the case of interactions of Galactic CRs with the interstellar gas. For the energy spectrum and the chemical compositions of CRs below we use the recent measurements by the AMS detector (Aguilar et al. 2010, 2015). The energy spectrum of CRs reported by the AMS collaboration (Aguilar et al. 2015) is shown in Fig. 11. The proton spectrum at high energies of E ≥ 10 GeV is described as a power-law with αp = 2.85. But at low energies, below 10 GeV, it becomes flatter. This explains the rather shallow distribution of γ-rays in the π0-bump region (see Fig. 12a). However, since the suppression of the proton flux at low energies could be a result of a local effect, for example due to the propagation effects in the solar system, in Fig. 12b we show the γ-ray luminosities for the proton spectrum which we extrapolate, starting at the energy of 10 GeV to subrelativistic energies as a single power-law in kinetic energy with the same power-law index αp = 2.85 (see Fig. 11). The solid curves in Fig. 12a and b represent the overall γ-ray emissivities contributed by interactions with an involvement of all nuclei from both the interstellar gas and CRs. For comparison, we show also the emissivities of γ-rays produced only in pp interactions (dashed lines). One can see that the contribution of all nuclei from the Galactic CRs and the interstellar gas is significant; it almost doubles the contribution of protons. In Fig. 12a and b, we introduce curves obtained by multiplying the contributions of protons to the γ-ray emissivity by a factor of κ = 1.8 to enhance it to the level of the overall γ-ray luminosity above 3 GeV. One can see that the spectral shapes of the “protonic” and overall γ-ray emissivities are quite similar. The fluxes at any point from 100 MeV to 10 GeV do not exceed 10%.
Finally, we should mention that at low energies, the nuclear interactions, with involvement of nuclei of both CRs and the ambient gas, result in intensive γ-ray line production (Murphy et al. 2009). The prompt de-excitation γ-ray lines contain unique information CRs at energies less that 100 MeV nuc−1. The contributionof this channel to the γ-ray production is limited by energies below 10 MeV, therefore they do not appear in Figs. 10 and 12. Even for very “heavy” composition and very soft energy distributions of CRs, the impact of de-excitation lines on the γ-ray spectrum in the region of theπ0-decay bump is negligible.
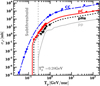 |
Fig. 7 π0 production cross-sections for the p + p, p + 4He, p + 12C and 12C + 12C interactions.The experimental points are shown together with the paramerisations of cross-sections from Kafexhiu (2016). |
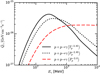 |
Fig. 8 Emissivities of γ-rays from decays of π0-mesons produced in pp interactions.Different line styles are calculated for three distributions of accelerated protons: (1) red dashed: power-law in momentum with αp = 2.0, (2) black dashed: power-law in momentum with αp = 2.85, (3) black solid: power-law in kinetic energy with αp = 2.85, respectively. The proton spectra are normalised in a way that the energy density wp (≥ 1 GeV) = 1 eV cm−3. The density of the hydrogen gas nH = 1 cm−3. |
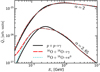 |
Fig. 9 Emissivities of γ-rays from decays of π0-mesons produced in pp (solid lines) and 16O16O (cyan dashed lines) interactions for two energy distributions of particles: power-law in kinetic energy, T−α with α = 2 and α = 2.85 (for both p and 16O projectiles). Also plotted is the total γ-rays produced in 16O16O (red dashed lines) interactions, including the hard photon channel. The emissivities of γ-rays are shown in arbitrary units and are normalised at 1 GeV to demonstrate the differences between the spectra of γ-rays from two reactions. |
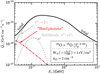 |
Fig. 10 Emissivities of γ-rays produced in 16O16O interactions. The three curves correspond to three radiation channels: γ-rays from (1) grey long dashed line: decays of “nominal” π0-mesons, (2) red dash-dotted line: “hard photons”, and (3) grey short dashed line: decays of “subthreshold” π-mesons. The spectrum of non-thermal nuclei 16 is assumed a power low in kinetic energy with αp = 2.85. For the energy spectrum of CRs and the density of gas the following normalisations are used: wp (≥ 1 GeV nuc−1) = 1 eV cm−3; nO = 1 cm−3. |
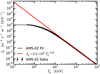 |
Fig. 11 Cosmic ray proton spectrum reported by AMS (Aguilar et al. 2015) (experimental points) shown together with two extrapolations (see the text). |
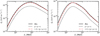 |
Fig. 12 Emissivities of γ-rays from interactions of Galactic CRs with the interstellar gas. Left panel: the overall γ-ray emissivity is shown by the solid line, while the emissivity due to pp interactions is shown by the dashed line. The red line corresponds to the pp emissivity enhanced by the factor of κ = 1.8 in order to match the overall emissivity at energies above 3 GeV. For composition and the CR proton flux are used the AMS measurements. Right panel: as in the left panel, except for the proton spectrum; it is assumed the same AMS proton spectrum at high energies but extrapolated to low energies as a single power-law with the same power-law index 2.85. |
4 γ-emissivities
Besides the hadronic processes CRs can also produce high-energy γ-rays via electron bremsstrahlung, and inverse Compton (IC) scattering of electrons. We illustrate the contributions of these channels forthe interstellar medium (ISM) in Fig. 13, where we assume an ambient density of 1 cm−3 and a background photon field as described in the previous section. The proton and electron spectra used in calculations are taken from Casandjian (2015), where the local interstellar spectra (LIS) of CRs have been derived from local HI emissivities. The results show that from 100 MeV up to 100 GeV the pion decay dominates in the γ-ray production. At lower energies the bremsstrahlung becomes more important. In the LIS there are low-energy cutoffs in both electron and proton spectrum, which produce corresponding features in the γ-ray spectra.
While in higher-density regions both the pion decay and the bremsstrahlung γ-ray emissivities increase with the ambient gas density, the ICs contribution remains unchanged if the radiation fields are kept constant. Therefore, in such environments we can ignore the IC scattering of electrons almost in the entire γ-ray band. On the other hand, the relativistic positrons can contribute to the γ-ray emission not only through the bremsstrahlung, but also through the process called annihilation in flight (Aharonian & Atoyan 1981). In particular, in the presence of a primary component of relativistic positrons (e.g., from pulsars), the process of annihilation in flight can significantly contribute to the overall diffuse galactic γ-ray background below 100 MeV (Aharonian & Atoyan 2000). In this regard, one may expect some contribution also from the secondary positions, especially given the high e+∕e− ratio from π±-decays at low energies. However, because of the very hard spectra of positrons produced in pp interactions below 100 MeV, the contribution of this channel appears quite modest. This can be seen in Fig. 14 where the contributions of bremsstrahlung and the annihilation in flight from secondary electrons and positrons are plotted. For both steep and hard spectra of primary protons, the contribution of the annihilation of positions in flight is an order of magnitude below the contribution of bremsstrahlung.
Below we compare the emissivities of γ-rays originating directly from the interactions of primary CRs with gas and from the secondary (π± -decay) electrons and positrons. We consider an environment typical for the interstellar medium. Since we are interested in the energy around the pion-decay bump, the contribution of the IC scattering of electrons is not significant. Therefore, for simplicity, we ignore the IC radiation channel. For higher density environments, for example in dense molecular clouds, the IC contribution can be safely ignored up to 1 TeV.
In Fig. 15, we show the γ-ray emissivities contributed directly by CRs through the production and decay of π0 -mesons, and through the bremsstrahlung of the secondary electrons and positrons. The curves in the figure correspond to different epochs characterised by the parameter n × T: 1013 (curve 1), 1014 (curve 2), 1015 s cm−3 (curve 3). One can see the contribution of secondary electrons increases with n × T. At some stage, however, when the parameter n × T exceeds 1015 s cm−3, the emissivity achieves its maximum, that is, saturates. While, the contribution of secondary electrons to γ-rays above 100 MeV is not significant, at lower energies, for example at 30 MeV, the bremsstrahlung of secondary electrons can overcome the flux of π0-decay γ-rays by an order of magnitude. Therefore, in dense sources with effective confinement of low-energy protons, the effect of distortion of the π0 -decay γ-ray spectrum at energies of tens of MeV becomes significant. This component can be revealed by future low-energy γ-ray missions like e-ASTROGAM (Tatischeff et al. 2016).
Finally, we investigated the contribution from primary electrons by assuming different e/p ratios. The calculations were performed for two extreme regimes: assuming uncooled and saturated distributions of particles. For the acceleration spectrum of both protons and electrons we assume power-law distributions in momentum with two spectral indices Γ = 2 and 2.85. It is assumed that the power-law distributions of initial (= uncooled) particles continue down to kinetic energy 10 MeV. As before, the gas number density is set 1 cm−3, and the proton distribution is normalised in a way that the energy density of protons is 1 eV cm−3.
The results calculated for two values of the ratio e∕p = 0.01 and 0.1 are shown in Figs. 16 and 17. In the case of uncooled particles, the bremsstrahlung γ-rays from primary electrons significantly fill the gap below the pion-decay bump. One can see that even for the e∕p ratio of 0.01the contribution of primary electrons is pronounced, especially for the steep power-law distribution with Γ =2.85. The effect is significantly less in the saturation regime. The contribution of saturated primary electrons is substantially reduced which is explained by the suppression of these electrons due to the ionisation losses. The ionisation losses also reduce the contribution of the π0 -decay γ-rays, but for them the effect of ionisation losses is less significant. In Figs. 16 and 17, we also plot the γ-ray emissivities from saturated secondary electrons and positrons, which is the maximum possible contribution from secondaries. We found that the γ-ray emissivities from secondary electron/positrons is comparable to that from primary electron/positrons in the saturated case even if the e/p ration is as high as 0.1. In the uncooled case, however, the γ-ray emissivities from primary electron/positrons dominate below 100 MeV when e∕p is larger than 0.01.
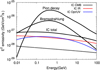 |
Fig. 13 γ-ray emissivities in the interstellar medium. The energy spectra of CR electrons and protons are taken from Casandjian (2015). The ambient gas number density is 1 cm−3. The background radiation fields consist of three components: (1) CMB with an energy density of 0.24 eV cm−3 and temperature of 2.7 K; (2) the optical/UV component which is modelled as grey-body radiation with an energy density of 2 eV cm−3 and temperature of 5000 K and (3) IR component which is approximated as a grey-body component with an energy density of 1 eV cm−3 and temperature of 100 K. |
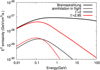 |
Fig. 14 γ-ray emissivities of secondary electrons and positrons through Bremsstrahlung and annihilation in flight. The electrons spectra are calculated in the saturation regime for two power law distributions of protons in momentum with indices 2.0 and 2.85 normalised to 1 eV cm−3 above 1 GeV. The gas number density is n = 1 cm−3. |
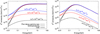 |
Fig. 15 γ-ray emissivity ofthe secondary electrons and positrons and parent protons at different epochs characterised by the parameter n × T (in unit cm−3 s): 1013 (black curve), 1014 (red curve), 1015 (blue curve).different n × T value. The distribution of the parent protons is assumed saturated with an injection power-law spectrum in momentum with indices Γ = 2 (left panel) and Γ = 2.85 (right panel). The proton density is normalised such that the energy density above 1 GeV is 1 eV cm−3. The gas number density is n = 1 cm−3. |
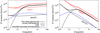 |
Fig. 16 γ-ray emissivities of primary protons and electrons in the uncooled regime for two values of the e∕p ratio: 0.1 and 0.01. It is assumed that both electrons and protons have the same power-law distribution in momentum which continues down to a kinetic energy of particles of 10 MeV. The gas number density is n = 1 cm−3. Left panel: Γ = 2; right panel: Γ = 2.85. Also shown as blue curves are the contributions from saturated secondary electrons, which is the maximum possible contributionfrom secondaries. |
5 Summary
The π0-decay bump is a distinct spectral feature of γ-rays produced in interactions of CR protons and nuclei with the ambient gas. It is generally considered as a key signature for identification of the hadronic component of radiation, and, correspondingly, for probing the relatively low-energy (E ≤ 10 GeV nuc−1) CRs in a broad range of astrophysical environments, from stellar atmospheres and supernova remnants to the interstellar medium and clusters of galaxies. The shape of the π0 -decay bump is determined basically by the cross-section of pp inelastic interactions and the energy distribution of non-thermal protons. The interactions of heavy ions can be responsible for a significant fraction of γ-ray production, but they do not change the spectral shape of the π0-decay bump, except for the energy band below 100 MeV. For a heavy composition and soft spectral distribution of CRs at sub-relativistic energies, the“hard photon” continuum and the “sub-threshold” pion production channels could significantly contribute to the overall γ-ray emission.
At energies below the π0-bump, bremsstrahlung of secondary electrons and positrons, the products of charged π-mesons, may provide a non-negligible contribution to the radiation from hadronic interactions of CRs with matter. The significance of this indirect but unavoidable channel depends on the parameter n × T, where n is the number density of the ambient gas, and T is the confinement time of CRs in the γ-ray production region. When the parameter n × T approaches 5 × 1015 cm−3 s, the evolution of CR protons saturates, thus the source operates as a calorimeter. In this regime, the contribution of this channel below 100 MeV can be as large as the contribution from the direct π0 -decay channel. Therefore, the precise spectral measurements in the energy interval between 10 and 100 MeV may contain important information about the confinement of low-energy cosmic rays, provided that the spectrum of primary (directly accelerated) electrons is not significantly steeper than E−2 and the ratio of primary electrons to protons, e∕p, does not exceed 0.01.
Appendix A Parametrisation of secondary production cross-section
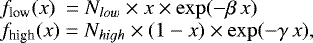
Geant4 simulations show that in the pp → π process the energy distributions for all three π-meson species appear to have a similar shape. We have therefore parametrised them with a universal function as follows:
 (A.1)
(A.1)
Here  with Tπ and
  being the π-meson kinetic energy and its maximum kinetic energy in the laboratory frame. The functional forms of flow and fhigh are
 (A.2)
(A.2)
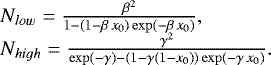
and the normalisation constants Nlow and Nhigh are defined such that the integral of flow from 0 to x0 is one and the integral of fhigh from x0 to 1 is one; these have the form
 (A.3)
(A.3)
The derived functional form of x0, α, β and γ for Tp ≤ 10 GeV are shown below:
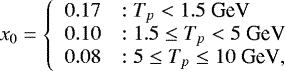 (A.4)
(A.4)
![Mathematical equation: \begin{equation*} \alpha = \left\{ \begin{array}{ll} 0.42 - 0.1\,\theta_{p} & : T_{p} < 1 ~\textrm{GeV} \\ 0.36 & : 1 \leq T_{p} < 1.5 ~\textrm{GeV}\\ 0.288 +\frac{S(18[\theta_{p}-1.85]) + 10\,S(1.7[\theta_{p}-4.1])}{40} & : 1.5 \leq T_{p} \leq 10 ~\textrm{GeV},\\ \end{array} \right. \end{equation*}](/articles/aa/full_html/2018/07/aa30908-17/aa30908-17-eq24.png) (A.5)
(A.5)
![Mathematical equation: \begin{equation*} \beta = \left\{ \begin{array}{ll} 101\,\theta_{p}^3 -230\,\theta_{p}^2 +170\,\theta_{p} -30 & : T_{p} \leq 1~\textrm{GeV} \\ 12.3 & : 1 \leq T_{p} < 1.5~\textrm{GeV}\\ 18.5 + 10\,S(13[\theta_{p}-3.4]) & : 1.5 \leq T_{p} \leq 10~\textrm{GeV},\\ \end{array} \right. \end{equation*}](/articles/aa/full_html/2018/07/aa30908-17/aa30908-17-eq25.png) (A.6)
(A.6)
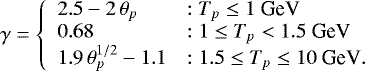 (A.7)
(A.7)
The ![Mathematical equation: $S(x)=\left[1+\exp(-x)\right]^{-1}$](/articles/aa/full_html/2018/07/aa30908-17/aa30908-17-eq27.png) is the sigmoid function and θp = Tp∕mp with Tp and mp are the proton kinetic energy and mass, respectively.
is the sigmoid function and θp = Tp∕mp with Tp and mp are the proton kinetic energy and mass, respectively.
References
- Ackermann, M., Ajello, M., Allafort, A., et al. 2013, Science, 339, 807 [NASA ADS] [CrossRef] [PubMed] [Google Scholar]
- Agostinelli, S., Allison, J., Amako, K., et al. 2003, Nucl. Instr. Meth. Phys. Res. A, 506, 250 [Google Scholar]
- Aguilar, M., Alcaraz, J., Allaby, J., et al. 2010, ApJ, 724, 329 [Google Scholar]
- Aguilar, M., Aisa, D., Alpat, B., et al. 2015, Phys. Rev. Lett., 114, 171103 [CrossRef] [PubMed] [Google Scholar]
- Aharonian, F. A. 2004, Very High Energy Cosmic Gamma Radiation: A Crucial Window on the Extreme Universe (Singapore: World Scientific Publishing Co.) [CrossRef] [Google Scholar]
- Aharonian, F. A., & Atoyan, A. M. 1981, Sov. Astron. Lett., 7, 395 [NASA ADS] [Google Scholar]
- Aharonian, F. A., & Atoyan, A. M. 2000, A&A, 362, 937 [NASA ADS] [Google Scholar]
- Allison, J., Amako, K., Apostolakis, J., et al. 2006, IEEE Trans. Nucl. Sci., 53, 270 [Google Scholar]
- Casandjian, J.-M. 2015, ApJ, 806, 240 [NASA ADS] [CrossRef] [Google Scholar]
- Cassing, W., Metag, V., Mosel, U., & Niita, K. 1990, Phys. Rep., 188, 363 [NASA ADS] [CrossRef] [Google Scholar]
- Cavallo, G., & Gould, R. J. 1971, Nuovo Cimento B Ser., 2, 77 [NASA ADS] [CrossRef] [Google Scholar]
- Dermer, C. D. 1986a, ApJ, 307, 47 [NASA ADS] [CrossRef] [Google Scholar]
- Dermer, C. D. 1986b, A&A, 157, 223 [NASA ADS] [Google Scholar]
- Franco, V., & Glauber, R. J. 1966, Phys. Rev., 142, 1195 [NASA ADS] [CrossRef] [Google Scholar]
- Ginzburg, V. L., & Syrovatskii, S. I. 1964, The Origin of Cosmic Rays (London: Pergamon Press) [Google Scholar]
- Giuliani, A., Tavani, M., Bulgarelli, A., et al. 2010, A&A, 516, L11 [Google Scholar]
- Giuliani, A., Cardillo, M., Tavani, M., et al. 2011, ApJ, 742, L30 [NASA ADS] [CrossRef] [Google Scholar]
- Glauber, R. J. 1955, Phys. Rev., 100, 242 [NASA ADS] [CrossRef] [Google Scholar]
- Glauber, R. J., & Matthiae, G. 1970, Nucl. Phys. B, 21, 135 [NASA ADS] [CrossRef] [Google Scholar]
- Golokhvastov, A. I. 2001, Phys. Atomic Nuclei, 64, 1841 [NASA ADS] [CrossRef] [Google Scholar]
- Gould, R. J. 1972, Physica, 58, 379 [NASA ADS] [CrossRef] [Google Scholar]
- Kafexhiu, E. 2016, Phys. Rev. C, 94, 064603 [NASA ADS] [CrossRef] [Google Scholar]
- Kafexhiu, E., Aharonian, F., Taylor, A. M., & Vila, G. S. 2014, Phys. Rev. D, 90, 123014 [NASA ADS] [CrossRef] [Google Scholar]
- Kamae, T., Karlsson, N., Mizuno, T., Abe, T., & Koi, T. 2006, ApJ, 647, 692 [NASA ADS] [CrossRef] [Google Scholar]
- Kelner, S. R., Aharonian, F. A., & Bugayov, V. V. 2006, Phys. Rev. D, 74, 034018 [NASA ADS] [CrossRef] [Google Scholar]
- Machner, H., & Haidenbauer, J. 1999, J. Phys. G: Nucl. Particle Phys., 25, R231 [CrossRef] [Google Scholar]
- Metag, V. 1993, Nucl. Phys. A, 553, 283 [NASA ADS] [CrossRef] [Google Scholar]
- Mori, M. 2009, Astropart. Phys., 31, 341 [NASA ADS] [CrossRef] [Google Scholar]
- Murphy, R. J., Dermer, C. D., & Ramaty, R. 1987, ApJS, 63, 721 [NASA ADS] [CrossRef] [Google Scholar]
- Murphy, R. J., Kozlovsky, B., Kiener, J., & Share, G. H. 2009, ApJS, 183, 142 [NASA ADS] [CrossRef] [Google Scholar]
- Ohira, Y., Kohri, K., & Kawanaka, N. 2012, MNRAS, 421, L102 [NASA ADS] [CrossRef] [Google Scholar]
- Pfrommer, C.,& Enßlin, T. A. 2004, A&A, 413, 17 [NASA ADS] [CrossRef] [EDP Sciences] [Google Scholar]
- Scanlon, J. H., & Milford, S. N. 1965, ApJ, 141, 718 [NASA ADS] [CrossRef] [Google Scholar]
- Skorodko, T., Bashkanov, M., Bogoslawsky, D., et al. 2009, Phys. Lett. B, 679, 30 [NASA ADS] [CrossRef] [Google Scholar]
- Stecker, F. W. 1971, NASA Spec. Publ., 249 [Google Scholar]
- Stecker, F. W. 1973, ApJ, 185, 499 [NASA ADS] [CrossRef] [Google Scholar]
- Stephens, S. A., & Badhwar, G. D. 1981, Ap&SS, 76, 213 [NASA ADS] [CrossRef] [Google Scholar]
- Tatischeff, V., Tavani, M., von Ballmoos, P., et al. 2016, Proc. SPIE, 9905, 99052N [Google Scholar]
- Tavani, M., Giuliani, A., Chen, A. W., et al. 2010, ApJ, 710, L151 [NASA ADS] [CrossRef] [Google Scholar]
- Taylor, A. M., Gabici, S., & Aharonian, F. 2014, Phys. Rev. D, 89, 103003 [NASA ADS] [CrossRef] [Google Scholar]
- Willingale, R., Bleeker, J. A. M., van der Heyden, K. J., & Kaastra, J. S. 2003, A&A, 398, 1021 [NASA ADS] [CrossRef] [EDP Sciences] [Google Scholar]
- Zirakashvili, V. N., Aharonian, F. A., Yang, R., Oña-Wilhelmi, E., & Tuffs, R. J. 2014, ApJ, 785, 130 [NASA ADS] [CrossRef] [Google Scholar]
We describe here the property of the maximum of SEDs, for differential spectrum the maximum is always at 67.5 MeV.
All Figures
|
Fig. 1 Energy distributions of CR protons at different epochs characterised by the parameter n × T values (in unit cm−3s): 3 × 10¹⁴ (curve 1), 1015 (curve 2), 5 × 10¹⁵ (curve 3), 1016 (curve 4). The left panel is for the proton injection spectrum with an index of 2, and the right panel for the index 2.85 (in momentum). The normalisations are arbitrary. |
| In the text | |
|
Fig. 2 γ-ray emissivities (in the form of SED) for the uncooled and saturated CR protons. The number density of the ambient gas is taken n = 1 cm−3. The proton distributions are normalised in a way that the energy density above T = 1 GeV is equal to 1 eV cm−3. The inserted figures are the zoomed SEDs in the maximum region between 0.1 and 10 GeV. |
| In the text | |
|
Fig. 3 Time evolution of distributions of the secondary electrons (black curves) calculated for different values of n × T (in unit cm−3 s): 1013 (curve 1), 1014 (curve 2), 1015 (curve 3), and 3 × 10¹⁵ (curve 4). The parent proton densities are normalised such that the energy density above 1 GeV is 1 eV cm−3. The saturated spectra for primary electrons (red curves) are also shown. The primary electrons are assumed to have the same spectrum as the parent protons, and the e∕p ratio of 0.01at injection. |
| In the text | |
|
Fig. 4 π-meson production cross-sections as a function of incident proton kinetic energy Tp < 2 GeV. The most important channels for π+-meson production are the pp → pnπ+ (red line) and the pp → Dπ+ (cyan line) channels. The experimental data points are from Machner & Haidenbauer (1999); the black dash line shows the total pp→ π+ cross-section. The cross-sections for the pp → π0 and pp → π− reactions are shown with grey and blue colours, respectively. The parametrisation for the pp → π0 and the respective compiled data are taken from Kafexhiu et al. (2014). The experimental data for pp → π− and the eye-guiding blue dash line are taken from Skorodko et al. (2009). For comparison, the Dermer (1986b) parametrisation for pp → π− cross-section is also shown. This parametrisation describes well the high-energy data, however, below Tp < 1 GeV it deviates significantly from measurements. |
| In the text | |
|
Fig. 5 Energy distribution of secondary positrons for incident proton energies Tp ≈ 0.3 and 0.6 GeV. The histograms are obtained from simulations using the Geant4 tools, while the red lines correspond to parametrisations for π-meson production given by Eq. (A.1) of Appendix A. The grey long dashed line is calculated using the parametrisation of Kamae et al. (2006) for Tp ≈ 0.6 GeV. |
| In the text | |
|
Fig. 6 Normalised differential energy distributions of electrons, positrons, and γ-rays as products of decays of π-mesons for three different energies of the incident protons Tp = 0.3, 0.6, and 1 GeV computed using Geant4. At low energies, the electron production is severely suppressed (the corresponding curves do not appear on the plot), while at Tp = 1 GeV the contributions of electrons and positrons become comparable. The label on the top of each histogram shows the relevant channels. |
| In the text | |
|
Fig. 7 π0 production cross-sections for the p + p, p + 4He, p + 12C and 12C + 12C interactions.The experimental points are shown together with the paramerisations of cross-sections from Kafexhiu (2016). |
| In the text | |
|
Fig. 8 Emissivities of γ-rays from decays of π0-mesons produced in pp interactions.Different line styles are calculated for three distributions of accelerated protons: (1) red dashed: power-law in momentum with αp = 2.0, (2) black dashed: power-law in momentum with αp = 2.85, (3) black solid: power-law in kinetic energy with αp = 2.85, respectively. The proton spectra are normalised in a way that the energy density wp (≥ 1 GeV) = 1 eV cm−3. The density of the hydrogen gas nH = 1 cm−3. |
| In the text | |
|
Fig. 9 Emissivities of γ-rays from decays of π0-mesons produced in pp (solid lines) and 16O16O (cyan dashed lines) interactions for two energy distributions of particles: power-law in kinetic energy, T−α with α = 2 and α = 2.85 (for both p and 16O projectiles). Also plotted is the total γ-rays produced in 16O16O (red dashed lines) interactions, including the hard photon channel. The emissivities of γ-rays are shown in arbitrary units and are normalised at 1 GeV to demonstrate the differences between the spectra of γ-rays from two reactions. |
| In the text | |
|
Fig. 10 Emissivities of γ-rays produced in 16O16O interactions. The three curves correspond to three radiation channels: γ-rays from (1) grey long dashed line: decays of “nominal” π0-mesons, (2) red dash-dotted line: “hard photons”, and (3) grey short dashed line: decays of “subthreshold” π-mesons. The spectrum of non-thermal nuclei 16 is assumed a power low in kinetic energy with αp = 2.85. For the energy spectrum of CRs and the density of gas the following normalisations are used: wp (≥ 1 GeV nuc−1) = 1 eV cm−3; nO = 1 cm−3. |
| In the text | |
|
Fig. 11 Cosmic ray proton spectrum reported by AMS (Aguilar et al. 2015) (experimental points) shown together with two extrapolations (see the text). |
| In the text | |
|
Fig. 12 Emissivities of γ-rays from interactions of Galactic CRs with the interstellar gas. Left panel: the overall γ-ray emissivity is shown by the solid line, while the emissivity due to pp interactions is shown by the dashed line. The red line corresponds to the pp emissivity enhanced by the factor of κ = 1.8 in order to match the overall emissivity at energies above 3 GeV. For composition and the CR proton flux are used the AMS measurements. Right panel: as in the left panel, except for the proton spectrum; it is assumed the same AMS proton spectrum at high energies but extrapolated to low energies as a single power-law with the same power-law index 2.85. |
| In the text | |
|
Fig. 13 γ-ray emissivities in the interstellar medium. The energy spectra of CR electrons and protons are taken from Casandjian (2015). The ambient gas number density is 1 cm−3. The background radiation fields consist of three components: (1) CMB with an energy density of 0.24 eV cm−3 and temperature of 2.7 K; (2) the optical/UV component which is modelled as grey-body radiation with an energy density of 2 eV cm−3 and temperature of 5000 K and (3) IR component which is approximated as a grey-body component with an energy density of 1 eV cm−3 and temperature of 100 K. |
| In the text | |
|
Fig. 14 γ-ray emissivities of secondary electrons and positrons through Bremsstrahlung and annihilation in flight. The electrons spectra are calculated in the saturation regime for two power law distributions of protons in momentum with indices 2.0 and 2.85 normalised to 1 eV cm−3 above 1 GeV. The gas number density is n = 1 cm−3. |
| In the text | |
|
Fig. 15 γ-ray emissivity ofthe secondary electrons and positrons and parent protons at different epochs characterised by the parameter n × T (in unit cm−3 s): 1013 (black curve), 1014 (red curve), 1015 (blue curve).different n × T value. The distribution of the parent protons is assumed saturated with an injection power-law spectrum in momentum with indices Γ = 2 (left panel) and Γ = 2.85 (right panel). The proton density is normalised such that the energy density above 1 GeV is 1 eV cm−3. The gas number density is n = 1 cm−3. |
| In the text | |
|
Fig. 16 γ-ray emissivities of primary protons and electrons in the uncooled regime for two values of the e∕p ratio: 0.1 and 0.01. It is assumed that both electrons and protons have the same power-law distribution in momentum which continues down to a kinetic energy of particles of 10 MeV. The gas number density is n = 1 cm−3. Left panel: Γ = 2; right panel: Γ = 2.85. Also shown as blue curves are the contributions from saturated secondary electrons, which is the maximum possible contributionfrom secondaries. |
| In the text | |
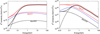 |
Fig. 17 As in Fig. 16 but for the saturated regime. |
| In the text | |
Current usage metrics show cumulative count of Article Views (full-text article views including HTML views, PDF and ePub downloads, according to the available data) and Abstracts Views on Vision4Press platform.
Data correspond to usage on the plateform after 2015. The current usage metrics is available 48-96 hours after online publication and is updated daily on week days.
Initial download of the metrics may take a while.