Fig. 1
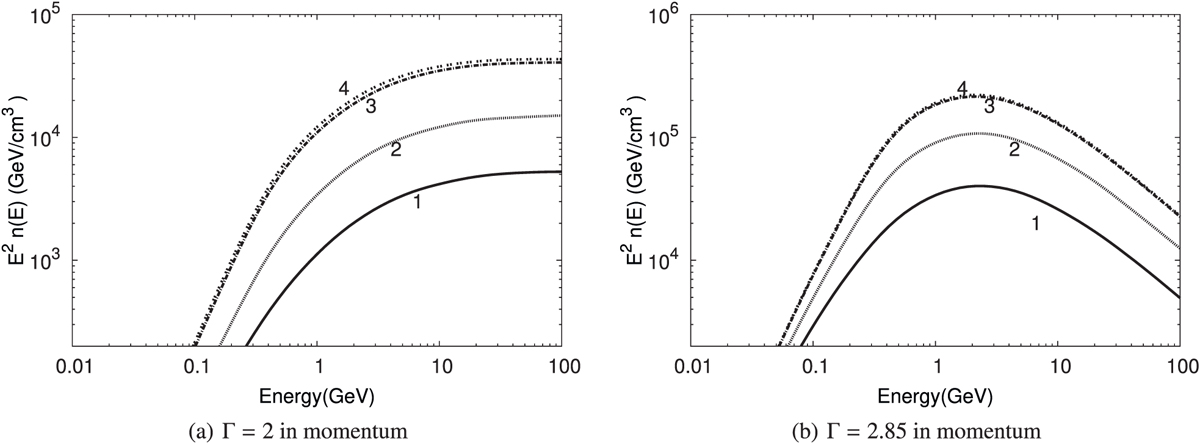
Energy distributions of CR protons at different epochs characterised by the parameter n × T values (in unit cm−3s): 3 × 10¹⁴ (curve 1), 1015 (curve 2), 5 × 10¹⁵ (curve 3), 1016 (curve 4). The left panel is for the proton injection spectrum with an index of 2, and the right panel for the index 2.85 (in momentum). The normalisations are arbitrary.
Current usage metrics show cumulative count of Article Views (full-text article views including HTML views, PDF and ePub downloads, according to the available data) and Abstracts Views on Vision4Press platform.
Data correspond to usage on the plateform after 2015. The current usage metrics is available 48-96 hours after online publication and is updated daily on week days.
Initial download of the metrics may take a while.