Fig. 5
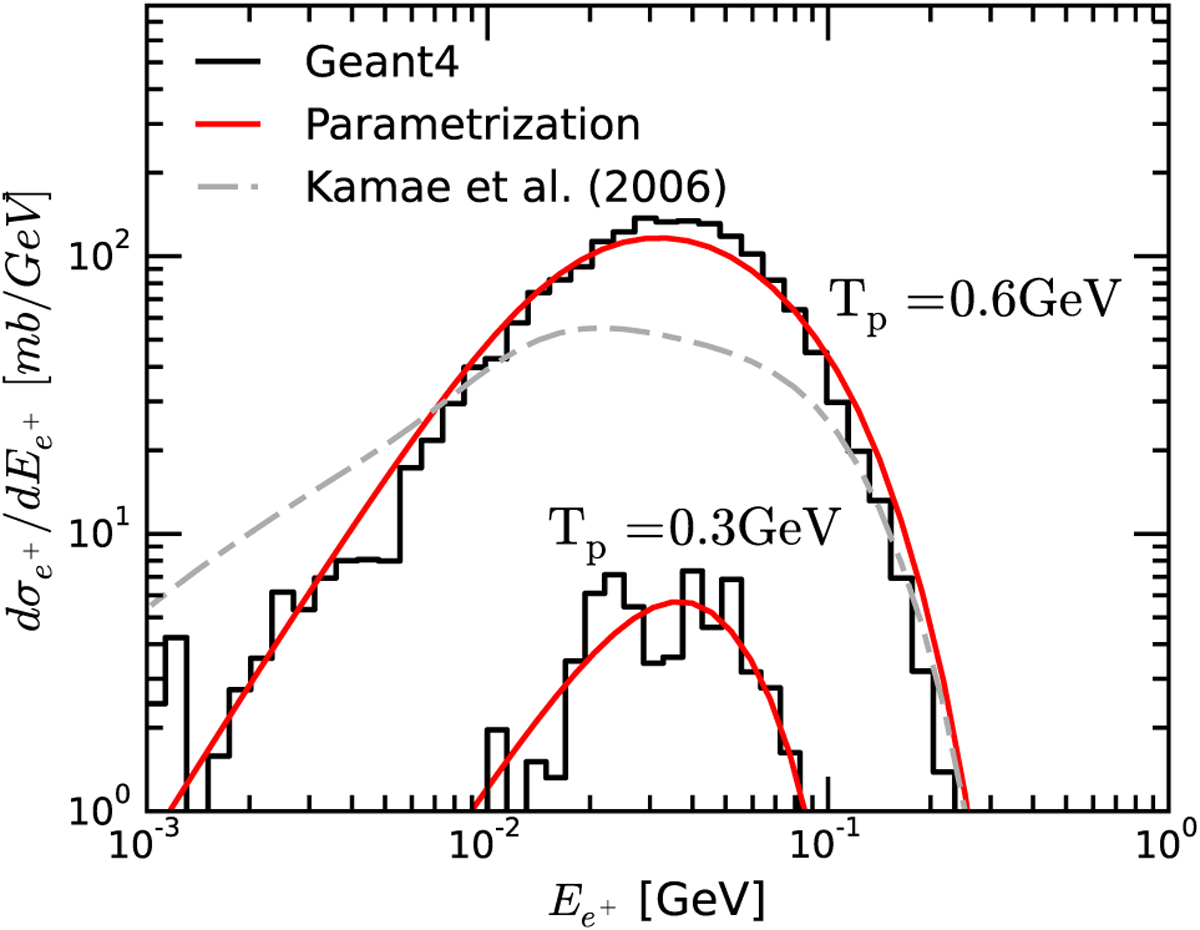
Energy distribution of secondary positrons for incident proton energies Tp ≈ 0.3 and 0.6 GeV. The histograms are obtained from simulations using the Geant4 tools, while the red lines correspond to parametrisations for π-meson production given by Eq. (A.1) of Appendix A. The grey long dashed line is calculated using the parametrisation of Kamae et al. (2006) for Tp ≈ 0.6 GeV.
Current usage metrics show cumulative count of Article Views (full-text article views including HTML views, PDF and ePub downloads, according to the available data) and Abstracts Views on Vision4Press platform.
Data correspond to usage on the plateform after 2015. The current usage metrics is available 48-96 hours after online publication and is updated daily on week days.
Initial download of the metrics may take a while.