Fig. 15
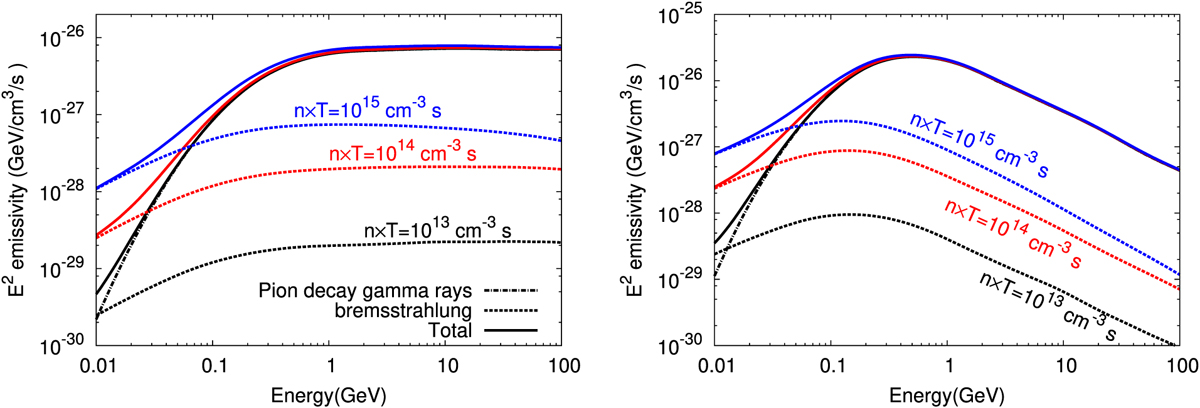
γ-ray emissivity ofthe secondary electrons and positrons and parent protons at different epochs characterised by the parameter n × T (in unit cm−3 s): 1013 (black curve), 1014 (red curve), 1015 (blue curve).different n × T value. The distribution of the parent protons is assumed saturated with an injection power-law spectrum in momentum with indices Γ = 2 (left panel) and Γ = 2.85 (right panel). The proton density is normalised such that the energy density above 1 GeV is 1 eV cm−3. The gas number density is n = 1 cm−3.
Current usage metrics show cumulative count of Article Views (full-text article views including HTML views, PDF and ePub downloads, according to the available data) and Abstracts Views on Vision4Press platform.
Data correspond to usage on the plateform after 2015. The current usage metrics is available 48-96 hours after online publication and is updated daily on week days.
Initial download of the metrics may take a while.