Fig. 8
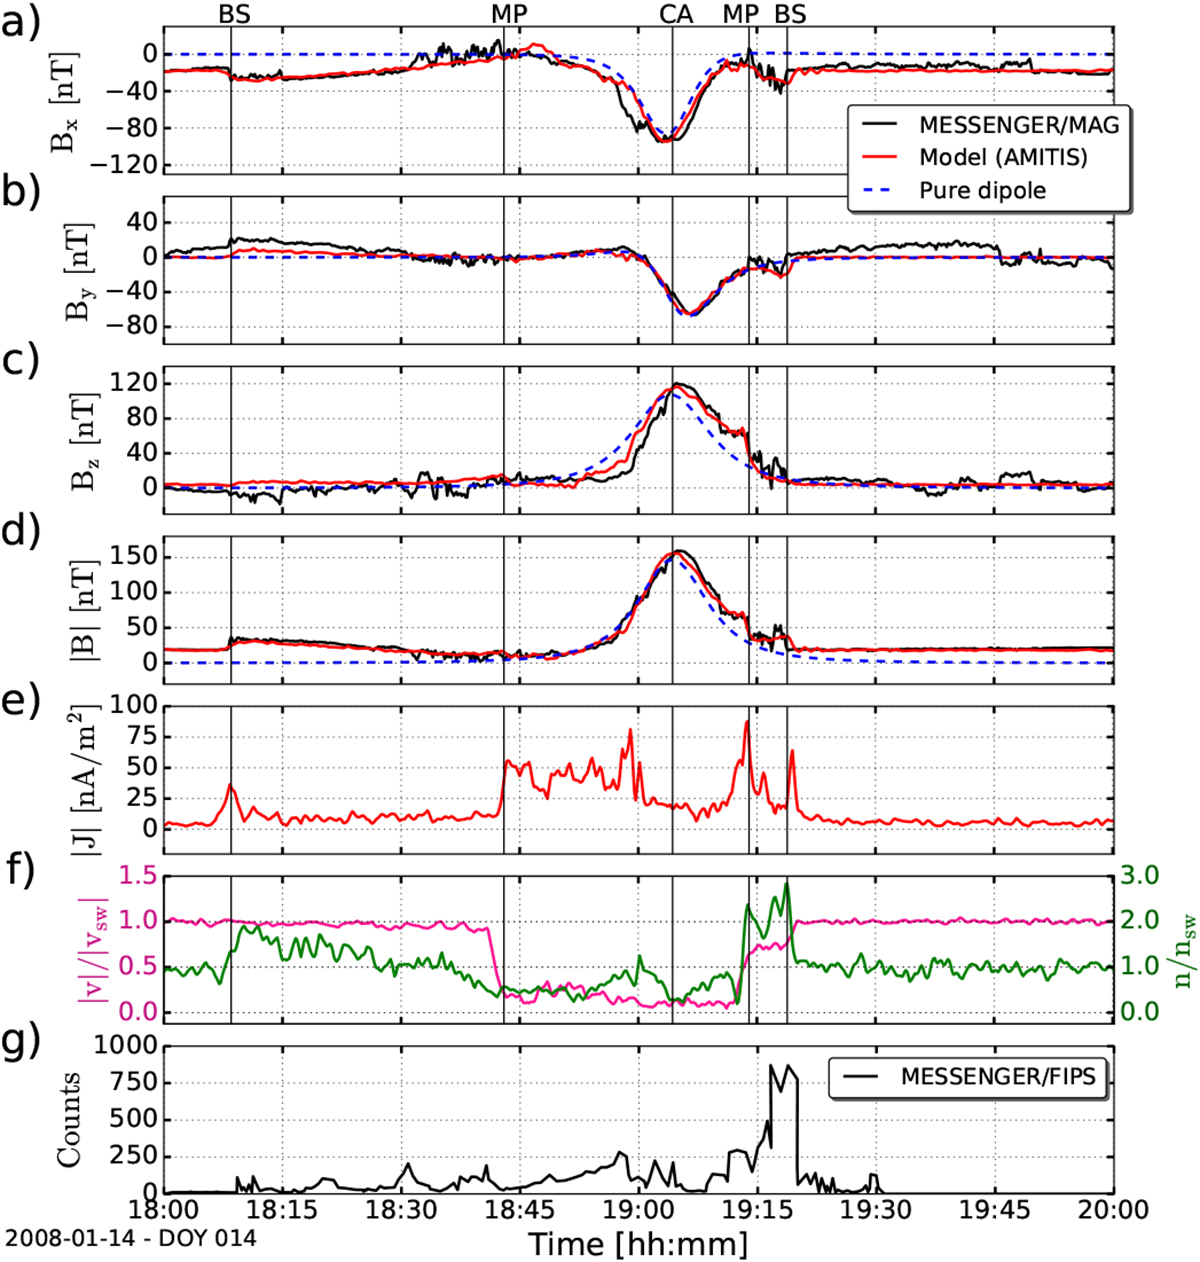
Comparison between our hybrid simulations and MESSENGER observations along the trajectory of MESSENGER on 14 January 2008 during the M1 flyby. The format of the presented results is the same as that shown in Fig. 4. Panel f: upstream solar wind speed |usw | =365 km s−1 and solar wind plasma density nsw = 32 cm−3. Panel g: plasma counts observed during the M1 flyby by the FIPS instrument on MESSENGER, digitized from Fig. 3 in Raines et al. (2011).
Current usage metrics show cumulative count of Article Views (full-text article views including HTML views, PDF and ePub downloads, according to the available data) and Abstracts Views on Vision4Press platform.
Data correspond to usage on the plateform after 2015. The current usage metrics is available 48-96 hours after online publication and is updated daily on week days.
Initial download of the metrics may take a while.