Fig. 4
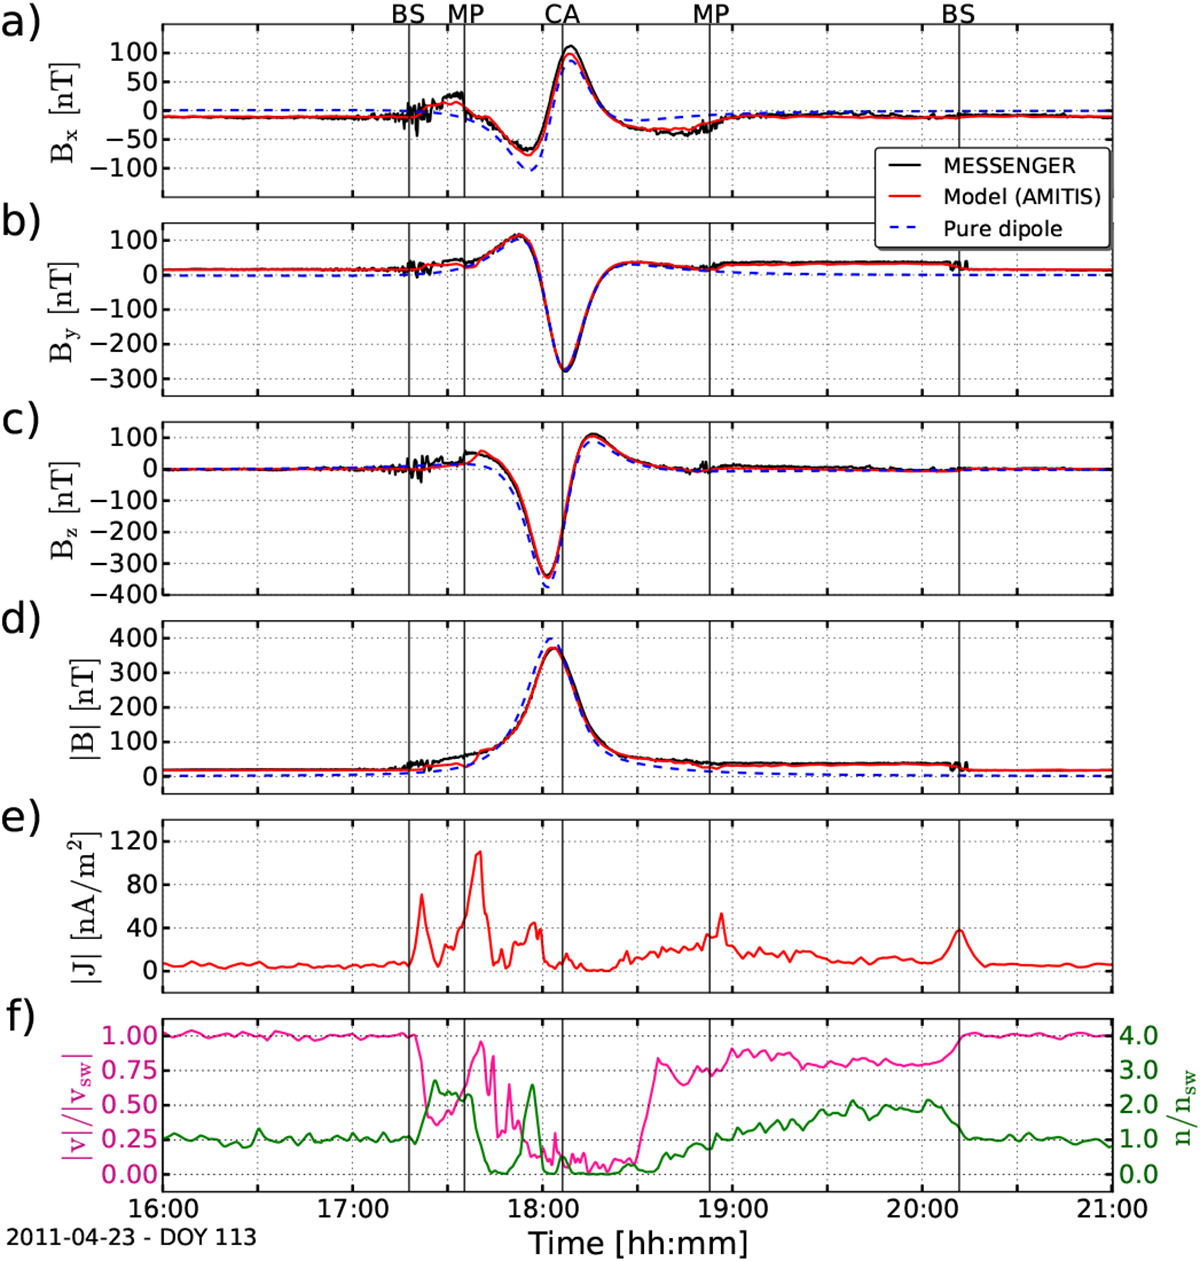
Panels a–d: magnetic field comparison between our hybrid model simulations (red lines), MESSENGER magnetometer observations (black lines), and undisturbed intrinsic magnetic dipole of Mercury (blue dashed lines) along the trajectory of MESSENGER on 23 April 2011 (D113) between 16:00 and 21:00 UTC. Panel e: magnitude of the electric current density calculated from our simulations using the general Ampère’slaw. Panel f: solar wind bulk flow speed normalized to the upstream solar wind speed |usw | = 314 km s−1 (purple line) and solar wind plasma density normalized to the upstream plasma density nsw = 22 cm−3 obtained from our hybrid model simulations along the trajectory of MESSENGER. The mid-point location of the bow shock (BS) and magnetopause (MP) boundaries estimated by Winslow et al. (2013) as well as the closest approach (CA) to the planet are shown by the vertical lines.
Current usage metrics show cumulative count of Article Views (full-text article views including HTML views, PDF and ePub downloads, according to the available data) and Abstracts Views on Vision4Press platform.
Data correspond to usage on the plateform after 2015. The current usage metrics is available 48-96 hours after online publication and is updated daily on week days.
Initial download of the metrics may take a while.