Fig. 3
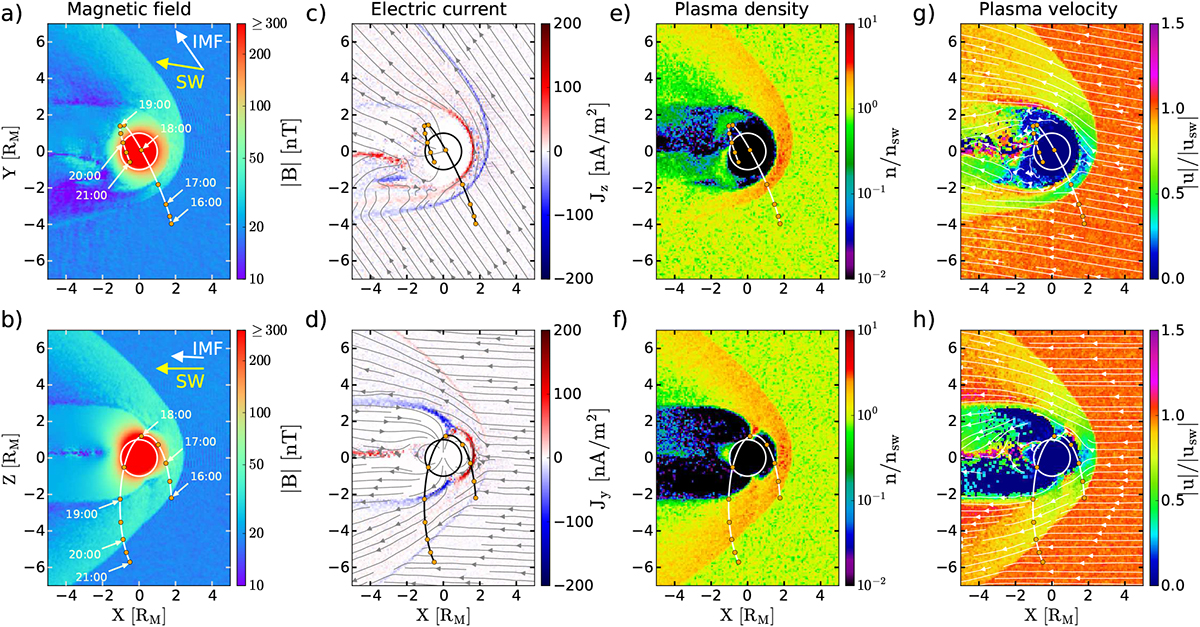
Hybrid simulation results for the magnetospheric transit of MESSENGER on 23 April 2011 between 16:00 and 21:00 (D113) presented in the MSO coordinate system. Panels a and b: magnitude of the magnetic field in logarithmic scale. Panels c and d: electric current density calculated from the general Ampère’s law, flow normal to the presented planes. Panels e and f: plasma density in logarithmic scale and normalized to the upstream solar wind density, nsw = 22 cm−3. Panels g and h: magnitude of the solar wind velocity normalized to the upstream solar wind velocity, |usw | = 314 km s−1. The top panels are cuts in the equatorial plane (xy-plane at z = 0), viewed from Mercury’s north pole, and the bottom panels are cuts in the midnight meridian plane (xz-plane at y = 0), viewed from the orbital motion of Mercury (i.e. the -y axis). Mercury is shown by a circle, centred at the origin of the coordinate system. The direction of the solar wind and the IMF are shown by yellow and white arrows, respectively, in panels a and b. Streamlines in panels c and d show magnetic field line tracing, and in panels g and h show the plasma flow direction. A portion of MESSENGER’s orbit on 23 April 2011 (D113), also shown in Fig. 1, is shown in all panels and the UTC time during the passage is marked by arrows in panels a and b.
Current usage metrics show cumulative count of Article Views (full-text article views including HTML views, PDF and ePub downloads, according to the available data) and Abstracts Views on Vision4Press platform.
Data correspond to usage on the plateform after 2015. The current usage metrics is available 48-96 hours after online publication and is updated daily on week days.
Initial download of the metrics may take a while.