Fig. 2
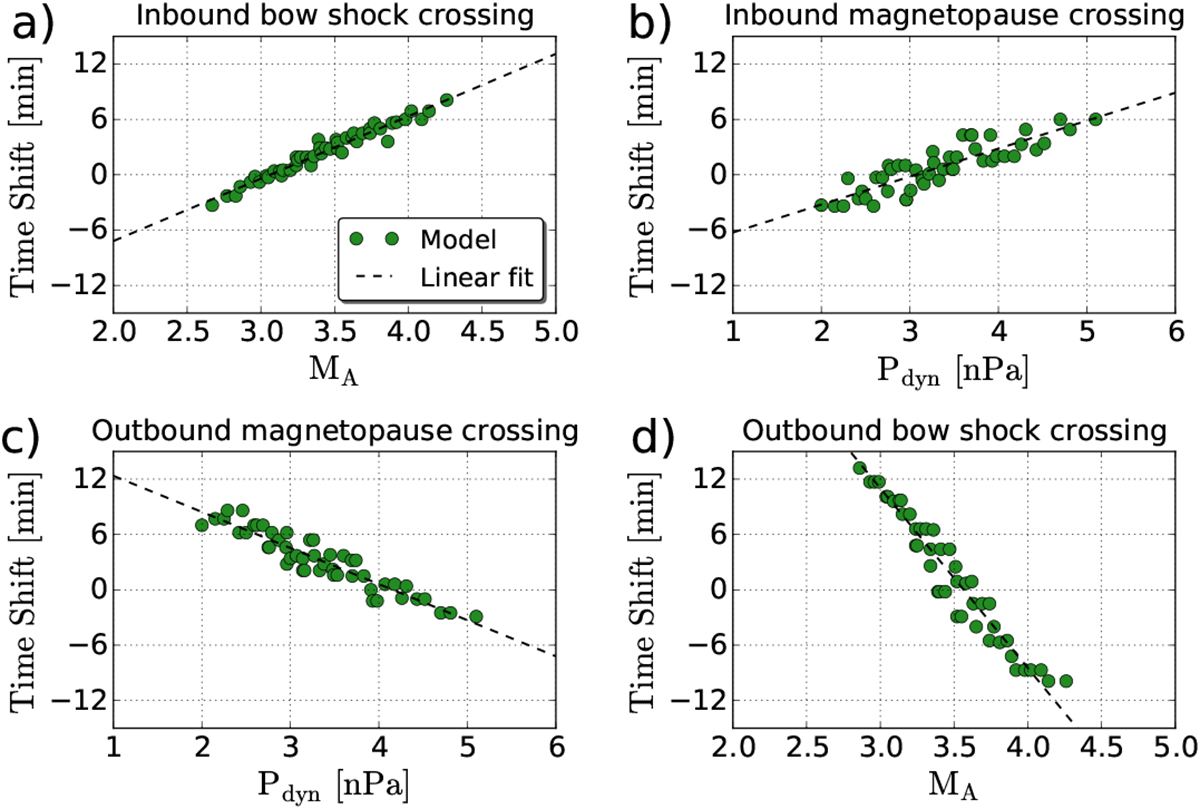
Time difference between our hybrid simulations and the mid-point location of the magnetospheric boundary crossings obtained from MESSENGER magnetic field observations by Winslow et al. (2013). The dashed line is a linear fit of our results using an ordinary least-squares fitting function. Panels a and b: inbound bow shock and magnetopause crossings. Panels c and d: Outbound magnetopause and bow shock crossings for the second magnetospheric transient on 23 April 2011 (D113). Pdyn = ![]() is the solar wind dynamic pressure and MA =
is the solar wind dynamic pressure and MA = ![]() is the Alfvén Mach number.
is the Alfvén Mach number.
Current usage metrics show cumulative count of Article Views (full-text article views including HTML views, PDF and ePub downloads, according to the available data) and Abstracts Views on Vision4Press platform.
Data correspond to usage on the plateform after 2015. The current usage metrics is available 48-96 hours after online publication and is updated daily on week days.
Initial download of the metrics may take a while.