Fig. 12
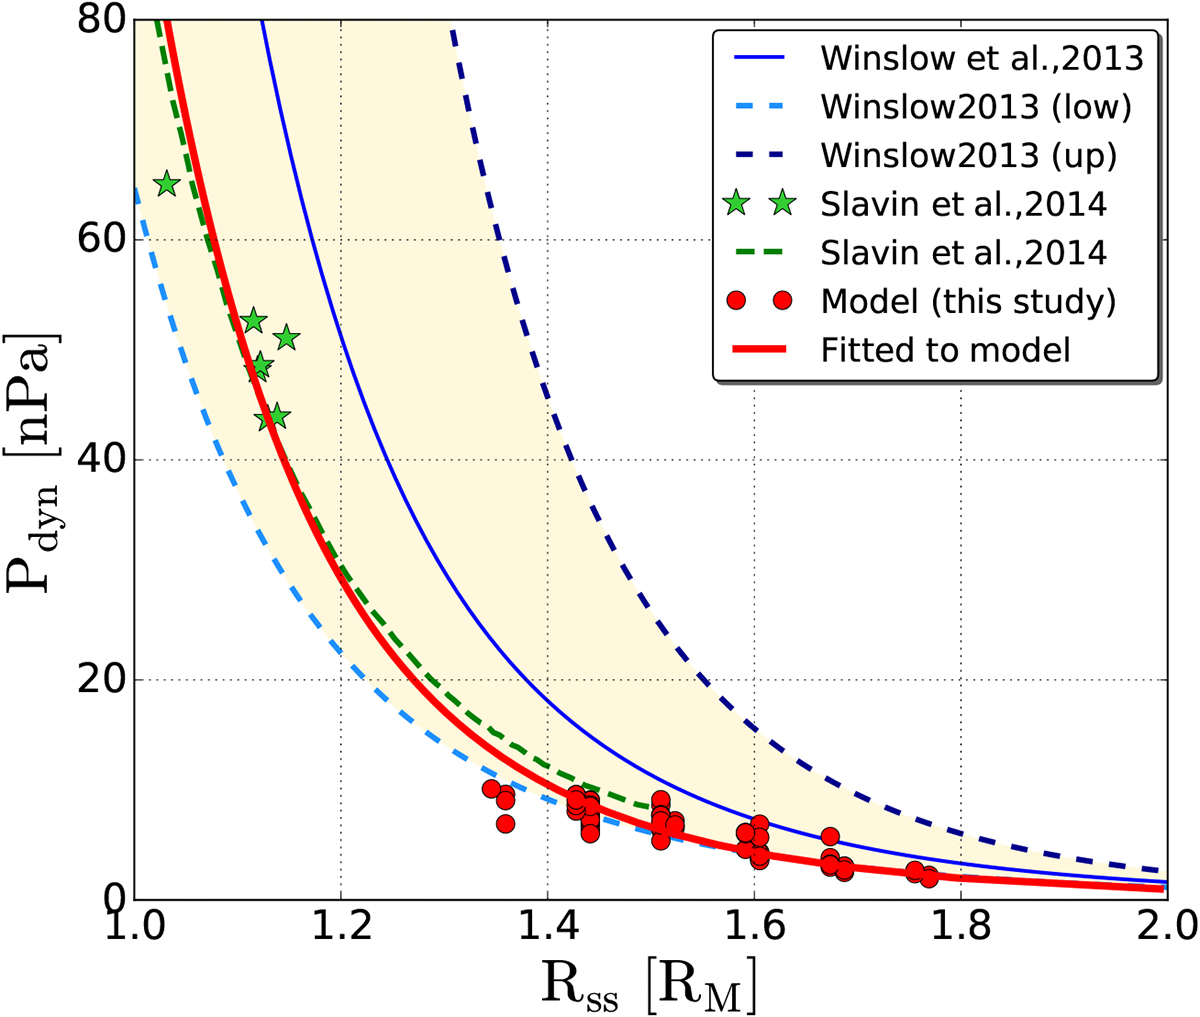
Stand-off distance of the magnetopause, Rss, from the centre of Mercury at the subsolar point in the MSM coordinate system as a function of the solar wind dynamic pressure, Pdyn. The solid blue line is from a MESSENGER empirical model by Winslow et al. (2013) shown in Eq. (1), where the lower limit and upper limit of the model are marked by the light blue and dark blue dashed line, respectively. The acceptance area between the lower and upper limits is in yellow. Taken from Fig. 19 by Slavin et al. (2014), the green asterisks are MESSENGER observations obtained during three extreme solar wind dynamic pressure events (i.e. CMEs and HSS) and the green dashed line is the function fitted to the observations by Slavin et al. (2014). The red circles are from our hybrid simulations and the red solid line is the curve fitted to our simulations, shown in Eq. (2), using a least-squares curve fitting function.
Current usage metrics show cumulative count of Article Views (full-text article views including HTML views, PDF and ePub downloads, according to the available data) and Abstracts Views on Vision4Press platform.
Data correspond to usage on the plateform after 2015. The current usage metrics is available 48-96 hours after online publication and is updated daily on week days.
Initial download of the metrics may take a while.