Fig. 11
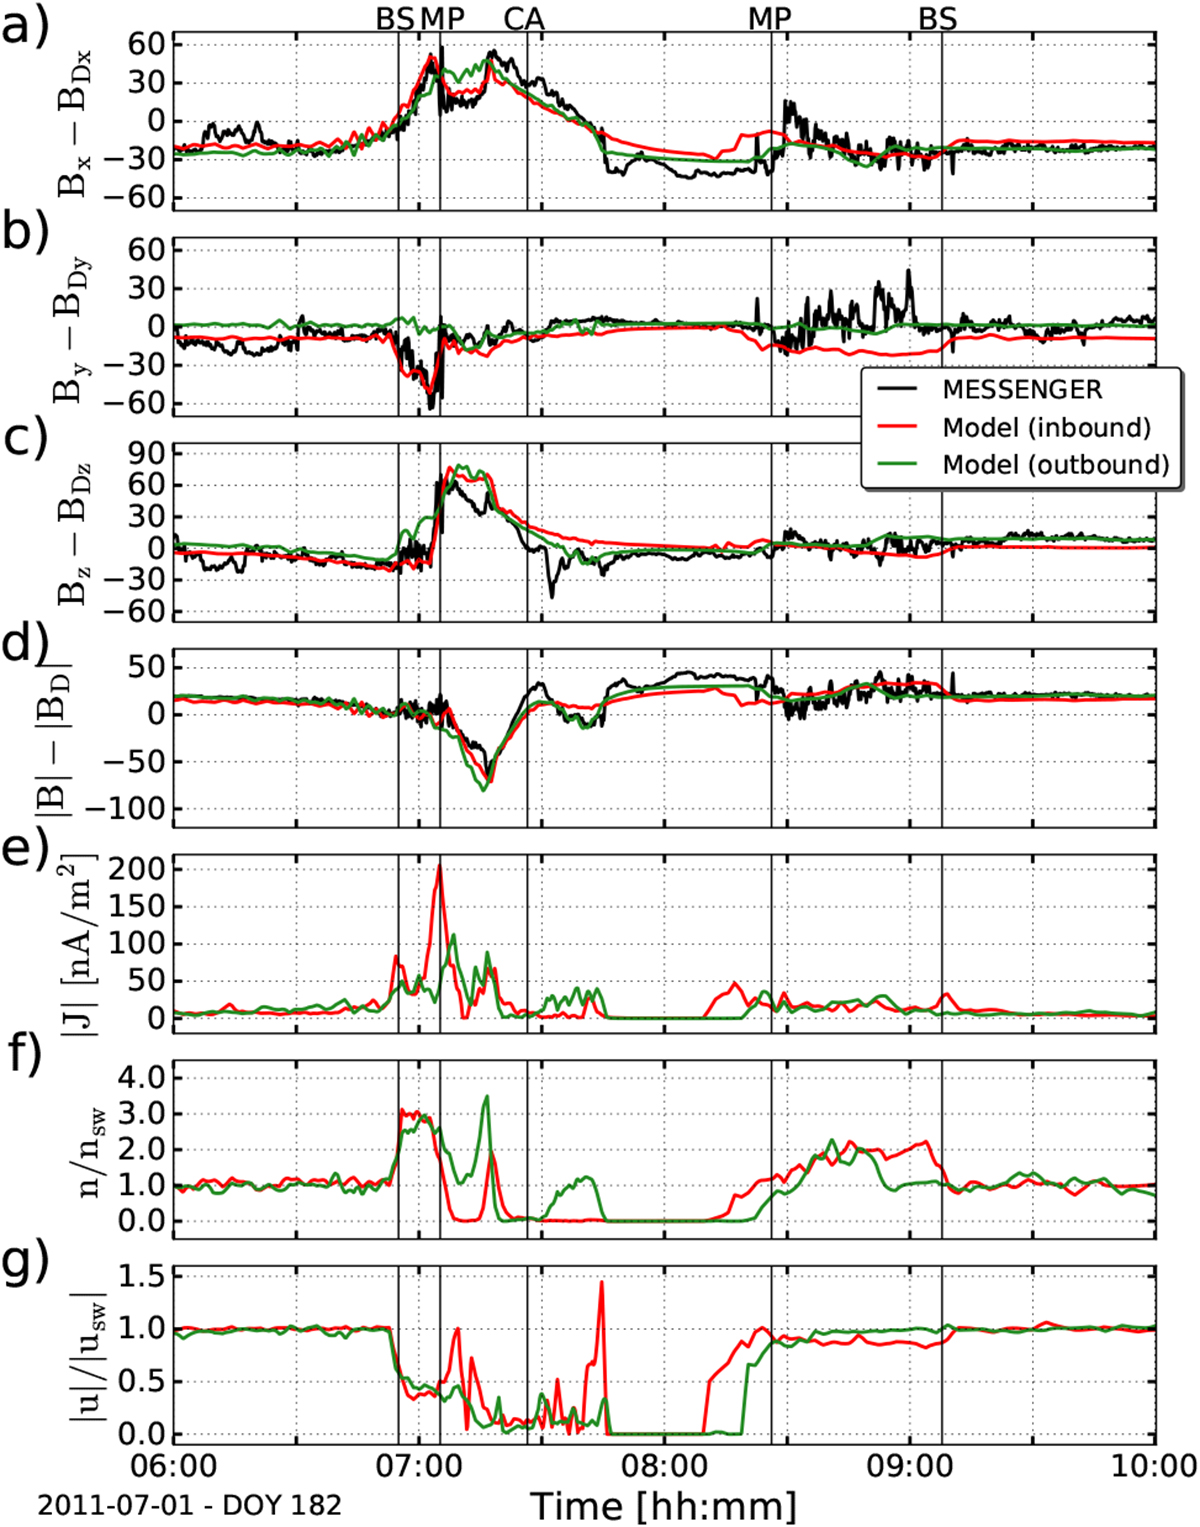
Comparison between our hybrid simulations and MESSENGER observations along the trajectory of MESSENGER on 01 July 2011 between 06:00 and 10:00 UTC (D182). Panels a-d: magnetic field comparisonbetween MESSENGER observations (black lines) and our hybrid simulations for the inbound (red lines) and outbound (green lines) IMF conditions listed in Table 1 along the trajectory of MESSENGER. To provide better visualization, we have subtracted the intrinsic magnetic fields of Mercury, BD, from observations and from simulations. Panel e: electric current density. Panel f: plasma density normalized to the upstream solar wind plasma density nsw = 30 cm−3. Panel g: plasma velocity normalized to the upstream solar wind plasma speed |usw | ≈385 km s−1, obtained from our simulations along the trajectory of MESSENGER. The mid-point location of the bow shock (BS) and magnetopause (MP) boundaries estimated by Winslow et al. (2013) as well as the closest approach (CA) to the planet are shown by the vertical lines.
Current usage metrics show cumulative count of Article Views (full-text article views including HTML views, PDF and ePub downloads, according to the available data) and Abstracts Views on Vision4Press platform.
Data correspond to usage on the plateform after 2015. The current usage metrics is available 48-96 hours after online publication and is updated daily on week days.
Initial download of the metrics may take a while.