| Issue |
A&A
Volume 614, June 2018
|
|
|---|---|---|
| Article Number | A130 | |
| Number of page(s) | 7 | |
| Section | Extragalactic astronomy | |
| DOI | https://doi.org/10.1051/0004-6361/201832705 | |
| Published online | 25 June 2018 | |
Dissecting star formation in the “Atoms-for-Peace” galaxy
UVIT observations of the post-merger galaxy NGC7252★
1
Indian Institute of Astrophysics,
Koramangala II Block,
Bangalore, India
e-mail: This email address is being protected from spambots. You need JavaScript enabled to view it.
2
Department of Physics, Christ University,
Bangalore, India
3
National Research Council of Canada, Herzberg Astronomy and Astrophysics Research Centre,
Victoria, Canada
4
National Centre for Radio Astrophysics,
Pune, India
5
Tata Institute of Fundamental Research,
Mumbai, India
6
University of Calgary,
Calgary, Alberta, Canada
7
ISRO Satellite Centre,
HAL Airport Road,
Bangalore, India
8
Inter-University Center for Astronomy and Astrophysics,
Pune, India
Received:
25
January
2018
Accepted:
23
February
2018
Abstract
Context. The tidal tails of post-merger galaxies exhibit ongoing star formation far from their disks. The study of such systems can be useful for our understanding of gas condensation in diverse environments. Aims. The ongoing star formation in the tidal tails of post-merger galaxies can be directly studied from ultraviolet (UV) imaging observations.
Methods. The post merger galaxy NGC7252 (“Atoms-for-Peace” galaxy) is observed with the Astrosat UV imaging telescope (UVIT) in broadband NUV and FUV filters to isolate the star-forming regions in the tidal tails and study the spatial variation in star formation rates.
Results. Based on ultraviolet imaging observations, we discuss star-forming regions of ages <200 Myr in the tidal tails. We measure star formation rates in these regions and in the main body of the galaxy. The integrated star formation rate (SFR) of NGC7252 (i.e., that in the galaxy and tidal tails combined) without correcting for extinction is found to be 0.81 ± 0.01 M⊙ yr−1. We show that the integrated SFR can change by an order of magnitude if the extinction correction used in SFR derived from other proxies are taken into consideration. The star formation rates in the associated tidal dwarf galaxies (NGC7252E, SFR = 0.02 M⊙ yr−1 and NGC7252NW, SFR = 0.03 M⊙ yr−1) are typical of dwarf galaxies in the local Universe. The spatial resolution of the UV images reveals a gradient in star formation within the tidal dwarf galaxy. The star formation rates show a dependence on the distance from the centre of the galaxy. This can be due to the different initial conditions responsible for the triggering of star formation in the gas reservoir that was expelled during the recent merger in NGC7252.
Key words: galaxies: star formation / galaxies: interactions / galaxies: dwarf / ultraviolet: galaxies
Based on observations made with Ultraviolet imaging telescope onboard ASTROSAT.
© ESO 2018
1 Introduction
Galaxies in the local Universe are often classified morphologically as early-type (E/S0) and late-type galaxies (spirals). In a galaxy colour-magnitude plot, the early-type galaxies fall on a “red sequence” while late-type galaxies populate a “blue cloud” (Visvanathan & Sandage 1977; Baldry et al. 2004). The red sequence galaxy population is observed to grow over cosmic time, as they evolve morphologically (Bell et al. 2004; Faber et al. 2007). Galaxy merging is the most frequent morphological transformation process in low-density environments such as field and galaxy cluster outskirts: i.e., a merger of two gas-rich spiral galaxies that can result in the formation of an elliptical galaxy (Toomre & Toomre 1972). The tidal forces involved can expel copious amounts of molecular gas into the intergalactic medium, which later condenses and triggers star formation (Schweizer 1978). Star formation in the tidal tails of merging galaxies is thus strong observational support for this hypothesis. The study of such star formation in the intergalactic medium may be useful in understanding how star formation proceeds in low-density environments.
The stars in galaxies are normally formed from the dissipative collapse of baryons trapped within dark matter halos (Blumenthal et al. 1984). The tidal tails of merging galaxies on the other hand are presumably devoid of dark matter halos, and hence represent a different environment for star formation. The mass and size of the gas condensations in tidal tails (particularly at their ends) are similar to dwarf galaxies found in the local Universe, and are known as tidal dwarf galaxies (TDGs; Zwicky 1956; Barnes & Hernquist 1992; Duc & Mirabel 1994, 1998; Duc et al. 2000, 2007; Duc 2012; Kaviraj et al. 2012). TDGs, although kinematically detached, are gravitationally bound to their parent galaxy and are observed to host large reservoirs of atomic and molecular gas (Hibbard et al. 1994; Braine et al. 2000, 2001). The triggered star formation from the gas in the TDGs may thus help in understanding the formation of dwarf galaxies at high redshift (Metz & Kroupa 2007; Kroupa et al. 2010).
NGC7252 (“Atoms-for-Peace” galaxy) is an archetypical advanced merger galaxy with a single-nucleus merger remnant; its tidal tails spread in almost opposite directions. NGC7252 is considered to satisfy the “Toomre Sequence” of merging, where the merger remnant will eventually deplete the fuel for star formation and evolve into an elliptical galaxy (Toomre & Toomre 1972; Toomre 1977; Schweizer 1982). Previous studies have demonstrated that NGC7252 is the remnant of an advanced merger between two gas-rich spiral galaxies, with two tidal tails and a main body of the galaxy, exhibiting shells and ripples in optical images (Schweizer 1982; Dupraz et al. 1990; Wang et al. 1992; Fritze-v. Alvensleben & Gerhard 1994; Hibbard et al. 1994). The merger is estimated to have started 600–700 Myr ago and the associated starburst in the galaxy is considered to be the result on that timescale (Hibbard & Mihos 1995; Chien & Barnes 2010). The surface brightness distribution of NGC7252 follows a roughly de Vaucouleurs profile, with optical spectroscopy revealing post-starburst features (Schweizer 1982; Hibbard & Yun 1999). The galaxy also falls on the Faber–Jackson relation and has properties similar to elliptical galaxies located on the Fundamental Plane (Lake & Dressler 1986; Hibbard & Mihos 1995; Genzel et al. 2001; Rothberg & Joseph 2006).
The main body of NGC7252 also contains young star clusters triggered by the merger (Miller et al. 1997; Bastian et al. 2013). Star clustersformed in the tidal tails were studied extensively and the eastern and northwestern tidal tails were found to terminate in concentrations of neutral hydrogen that are coincident with the position of candidate TDGs (Hibbard et al. 1994; Knierman et al. 2003). The luminous blue star clusters in the inner region of NGC7252 were found to have a narrow range in optical colour (V − I ~ 0.65) with ages corresponding to 650–750 Myr, matching the numerical simulation of the time since the start of the merger (Knierman et al. 2003). The tidal tail of NGC7252 had been studied for its HI content, kinematics, Hα kinematics, and gas phase metallicity (Hibbard et al. 1994; Lelli et al. 2015). The neutral hydrogen observations of NGC7252 tidal tails reveal that the HI is spatially extended in width and length compared with the stellar populations in the optical image. The gas phase metallicity in the tidal tail and the TDGs were found to be of solar value with no gradient indicative of star formation in the pre-enriched gas thrown out of the parent galaxy (Lelli et al. 2015).
The ongoing star formation in the tidal tails of NGC7252 is thus of dwarf galaxy size (TDGs) and examining it at high spatial resolution is of interest for studying galaxy formation and evolution in diverse environments. The stellar populations in tidal tails can have old components retained from the pre-merger galaxies along with newly formed stars. The relative contribution (particularly of young stars) is difficult to disentangle from optical observationsalone, but can be done with ultraviolet (UV) imaging. The integrated spectral energy distribution of young stellar populations peaks at UV wavelengths due to the presence of hot OBA stars. The UV flux directly traces the star formation within the past 100–200 Myr (Kennicutt & Evans 2012).
The observations of NGC7252 presented here come from the NUV and FUV channels of the ultraviolet imaging telescope (UVIT) on board ASTROSAT. These have an angular resolution of 1. ′′ 2 in the NUV and 1. ′′ 4 in the FUV. The FUV flux represents the direct tracer of recent and ongoing star formation. In a scenario of continuous star formation, it can thus constrain the star formation rate (SFR) better than Hα observations (which arise from star formation on timescales of <10 Myr)1. We report here deep UV imaging of NGC7252 that reveals star forming regions both in the tidal tail and in the main body of the galaxy, with good spatial resolution.
The paper is arranged as follows. The UV observations and the analysis of tidal features, including an estimate of the SFR, is presented in Sect. 2. We discuss the implications of our observations in Sect. 3 and conclude in Sect. 4. Throughout, we adopt a flat Universe cosmology with Ho = 71 km s-1 Mpc-1, ΩM = 0.27, ΩΛ = 0.73 (Komatsu et al. 2011).
2 Observation, data, and analysis
The post-merger galaxy NGC72522 has a spectroscopic redshift ~0.0159, and is thus located at a luminosity distance3 ~68 Mpc (Rothberg & Joseph 2006). The angular scale of 1′′ corresponds to 0.32 kpc at the distance of the galaxy. NGC7252 was observed in FUV and NUV wavelengths with UVIT on board the Indian multi-wavelength astronomy satellite ASTROSAT (Agrawal 2006). UVIT consists of twin telescopes, a FUV (130–180 nm) telescope and a NUV (200–300 nm)/VIS (320–550 nm) telescope. The primary mirror is of 37.5 cm in diameter and generates circular images with a 28′ diameter simultaneously in all three channels (Kumar et al. 2012).
There are narrow and broad band filters in each channel, of which we used the NUV N242W (λmean = 241.8 nm, δλ = 50 nm) and FUV F148W (λmean = 148.1 nm, δλ = 78.5 nm) for observations (Subramaniam et al. 2016; Tandon et al. 2017a). The detectors of UVIT operate in photon counting mode, using a 512 × 512 CMOS detector. The centroid positions are corrected for spacecraft drift and yield a resolution of ~1. ′′2 for the NUV and ~1. ′′4 for the FUVchannels. The NUV and FUV images are flat fielded and corrected for distortion (Girish et al. 2017) using the software package CCDLAB (Postma & Leahy 2017). The images from multiple orbits are co-added to create final images with total integration times: FUV = 8138 s, and NUV = 7915 s. The astrometric calibration is performed using the astrometry.net package where solutions are performed using the USNO-B catalogue (Lang et al. 2010). The photometric calibration is done using the zeropoint values generated from calibration stars (Tandon et al. 2017b).
The optical B-band image of NGC7252 taken with the CTIO 4-m telescope at a spatial resolution of 1. ′′ 2 is used for comparing with UV images (data from Hibbard et al. 1994). We note that GALEX observations of NGC7252 exist, but with a relatively shallow depth (FUV net in tegration time = 560 s, NUV net integration time = 1600 s). Our UVIT imaging data for NGC7252 is deeper and at a higher spatial resolution (GALEX resolution ~4–5 arcsec).4 The foreground extinction from the Milky Way Galaxy in the direction of NGC7252 is AV = 0.10 (Schlegel et al. 1998) which we scale to the FUV and NUV λmean values usingthe Cardelli et al. (1989) extinction law.
Star-forming regions may contain significant amounts of dust which can further attenuate the flux at UV wavelengths. As we do not have a measurement of the rest-frame extinction along the tidal tails and main body of NGC7252, we caution that our estimates for the star formation rates based on these FUV observations should be treated as lower limits to the actual values.
2.1 Optical and UV analysis
The optical B-band image used in this analysis has a resolution that matches the NUV image, so it is possible to make a comparative study between the optical and NUV data. The NUV image is Gaussian-smoothed using a kernel of three pixels (1. ′′ 2) in width to suppress noise. The NUV image of NGC7252 is shown in Fig. 1. The contours from the optical B-band image are overlaid on the NUV image to highlight common features and identify possible missing features. We note that all features are visible in both images along tidal tails and the main body of the galaxy. The underlying stellar population in tidal tails can then be considered as young (<1 Gyr) and due to the triggered star formation since the onset of merger, as is evident from the NUV and optical imaging data.
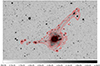 |
Fig. 1 NUV image of NGC7252 with intensity values in inverted grey colour-scale. The eastern and northwest tidal tails extending from the main body of the galaxy are clearly seen. The potential star-forming regions are clearly visible in the tidal tails. The optical B-band contour is overlaid on the NUV image in red. The NUV emission along the tidal tails is confined to narrow regions within optical image. The image is of size ~12.0′ × 8.0′ and the grey-scale is in units of counts per sec. |
2.2 Star-formation regions in the UV image
The sites of ongoing and recent star formation in NGC7252 can be identified from the UV images, resolving features at 0.38 Kpc (1. ′′2) in the NUV and at 0.45 Kpc (1. ′′4) in the FUV.The NUV spatial resolution is best suited to the identification of star-forming regions in NGC7252 and we use it to mark the sites of ongoing star formation in the tidal tails of NGC7252. Figure 2 displays the NUV image with the contrast level chosen to highlight low-surface-brightness features in the tidal tails. The known tidal features are marked and the colour scaling is shown in counts per second. It is to be noted that the size of a few of the star forming regions in the tidal tails are similar to nearby dwarf galaxies. The known TDG candidates (NGC7252 E and NGC7252 W) are located at the ends of the eastern and north western tidal tails. The candidate star-forming regions in tidal tails of NGC7252 are highlighted by boxes in Fig. 3. The scaling is changed for each box to enhance the contrast which, in turn, shows the NUV flux changes within the star-forming region. Contours are used to isolate obvious features.
We see the following details in Fig. 3: (A) a possible star-forming region associated with NGC7252; (B) the candidate TDG (NGC7252E) (Lelli et al. 2015) – the star forming region is elongated with intense NUV emission from the eastern edge; (C) a feature with intense NUV emission from a ring and a different morphology in the optical B-band image; (E) a feature consisting of three regions with different sizes – the features are just detached from the main body of the galaxy; (F and G) candidate star forming clumps demonstrating small-scale star formation in regions along the tidal tails; and (H) a candidate TDG (NGC7252NW) (Lelli et al. 2015) – the intense NUV emission is seen from the southern region of NGC7252NW. The north-western tidal tail may have material falling back to the galaxy (Hibbard & Mihos 1995). We note that NGC7252NW has a gradient in flux towards the main body of the galaxy that could be due to star formation in the tidal material falling back towards the main galaxy.
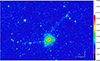 |
Fig. 2 NUV image of NGC7252 with a contrast level chosen to highlight the low-surface-brightness level features in the tidal tails. The tidal features are marked, and the colour scaling is shown in counts per second. |
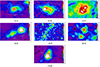 |
Fig. 3 Star-forming regions in the tidal tails of NGC7252 from the NUV image is shown in the boxes from subfigures (1)–(7) (corresponding to (A)–(H) in Fig. 2, excluding the central region (D) of galaxy). The scaling is chosen for each box to enhance the contrast to show the flux changes within the star forming regions. A colour bar is shown with scaling in counts per second. |
2.3 Star formation rates
The FUV flux from the star-forming regions in galaxies is a direct tracer of current star formation. The FUV flux can be used to compute the SFR of star-forming regions assuming a constant SFR over the past 108 yr. Recent simulations suggests that the derived SFR using estimators other than Lyman continuum can suffer from instantaneous changes over small (~10 Myr) timescales (see Boquien et al. 2014). The SFR along the tidal tails and the main body of NGC7252 is computed for a Salpeter initial mass function from the FUV luminosity (LFUV) (Kennicutt 1998). We used the following form of equation as described in Iglesias-Páramo et al. (2006) and adopted in Cortese et al. (2008).
![Mathematical equation: \begin{equation*} \textrm{SFR}_{FUV} [M_{\odot}\,\textrm{yr}^{-1}] = \frac{L_{FUV}[\textrm{erg\,sec}^{-1}]}{3.83 \times 10^{33}} \times {10^{-9.51}} \end{equation*}](/articles/aa/full_html/2018/06/aa32705-18/aa32705-18-eq1.png) (1)
(1)
The region of the FUV image that corresponds to the tidal tails and main body of NGC7252 was isolated using the background counts from the whole image to set the threshold. Pixels with values above the 3σ of the threshold were selected to isolate the region of interest. The counts in the selected pixels were background subtracted, integration time weighted and converted to flux units using the unit conversion (UC) (see Table 4 of Tandon et al. 2017b for the UC). The FUV flux of the selected region is converted to luminosity and is used to calculate the SFR. The spatial map of SFR along the tidal tail and the galaxy is shown in Fig. 4. The integrated SFR for NGC7252 in its entirety is found to be 0.81 ± 0.01 M⊙ yr−1. We note that the integrated SFR estimated from far infrared flux is 8.1 M⊙ yr−1 (O’Sullivan et al. 2015). But see also Table 14 of Boquien et al. (2009) where the integrated star formation rates derived from GALEX FUV flux of a few selected regions in the tidal tail is found to be 0.08 ± 0.01. The extinction-free estimate of the SFR measured from 1.4 GHz radio continuum observation of the central nucleus region of NGC7252 is found to be 6.3 ± 0.2 M⊙ yr−1. The SFR from integrated Hα luminosity corrected forinternal extinction (Av = 1.75 ± 0.25 mag) is found to be 5.6 ± 1.1 M⊙ yr−1 (Schweizer et al. 2013). The star-forming regions thus measured, without any extinction correction, in the tidal tails and main body of the galaxy are shown in Fig. 4 and also magnified in boxes. We note that each point in Fig. 4 corresponds to 1 pixel in the FUV image and the integrated star formation rates are marked on the top of the boxes in the figure.
The integrated SFR of the tidal features and area of the star-forming regions marked in Fig. 4 is given in Table 1. The regions marked “B” and “H” in Fig. 4 are the candidate TDGs (NGC7252E, NGC7252NW) in NGC7252. The main body of the galaxy (the merger remnant) shows higher star formation rates (0.66 ± 0.01 M⊙ yr−1) and shows spiral-like features emanating from the centre region. This is clearly seen in optical from HST observations of the central region of NGC7252 (Whitmore et al. 1997; Miller et al. 1997; Laine et al. 2003; Rossa et al. 2007). There will be FUV emission from any AGN at the centre of the merger remnant which would overestimate our SFR estimation (Schweizer et al. 2013). The star forming regions (marked B, E and H in Fig. 4) show knots of intense star formation. If star formation arises in gas expelled during the merger, there can be a dependence of star formation rates on distance from the main body of the galaxy. In Fig. 5, we confirm this variation in star formation rate surface density (SFR normalized to surface area) with distance from the centre of NGC7252. The most distant regions from this post-merger galaxy clearly show higher star formation rates.
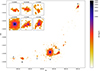 |
Fig. 4 Star formation rate for NGC7252. The spatial variation of star formation in tidal tails and the main body of the galaxy is seen in the magnified regions within the boxes. The features are marked with labels for identification and the SFR of eachfeature is noted at the top of the box. |
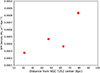 |
Fig. 5 Distance dependence on the integrated star formation rate density (star formation rate per unit area) of star forming regions on the tidal tail from the centre of NGC7252. |
3 Discussion
We have studied recent star formation in the post-merger galaxy NGC7252. The galaxy, a merger remnant, is understood to have formed froma major merger between two gas-rich galaxies. Major and minor mergers of galaxies are known to trigger star formation even in non-star-forming elliptical galaxies (George & Zingade 2015; George 2017). Galaxy mergers are known to produce intense star formation episodes in the remnant as well as their tidal tails. Since star formation in normal galaxies happens primarily in their disks, such tidal tails provide an opportunity to study star formation in low-density environments. The tidal tails are composed of stellar populations with gas and dust content similar to the galaxy disk.
The SFR measured from the observed FUV flux for the main body of the galaxy is much smaller (SFR: 0.66 M⊙ yr−1) compared to the values obtained from Far-IR/1.4 GHz/Hα luminosities (SFR:8.1/6.3/5.6 M⊙ yr−1 Schweizer etal. 2013). The central star-forming regions of NGC7252 could contain a significant amount of dust that could attenuate the flux at UV wavelengths. The FUV flux we measured is not corrected for extinction and could be the reason for a discrepancy (of approx. an order of magnitude) in SFR derived using FUV and other proxies. We try to compute the extinction in FUV (AFUV) for the main body of the galaxy by considering the Hα derived SFR for the central region of the galaxy as the ideal one. We found that the corresponding value of AFUV is equal to 2.33 mag. This implies that the observed FUV flux can be attenuated by a factor of approximately 8.5. If we consider a Cardelli et al. (1989) extinction law this corresponds to AV = 0.90 mag.
Multi-wavelength observations of the post-merger galaxy NGC7252 have been carried out from radio to X-rays in studies of its gas content, dynamics and star formation properties (Schweizer 1982; Dupraz et al. 1990; Borne & Richstone 1991; Richter et al. 1994; Hibbard & Mihos 1995; Read & Ponman 1998). The present study has, for the first time, directly derived the star formation properties of this galaxy from wide-field UV images. The ongoing star formation in the tidal tails of NGC7252 is directly observed using the FUV/NUV images from UVIT. The features along tidal tails are hosting intense star formation with a rate density showing a mild dependence on distance from the central galaxy. We note that the observed trend is based on four star-forming regions along the tidal tails and given the uncertainties from projection effects, should be taken with caution. The intense star formation in the tails could be due to gravitational perturbations or recent shocks in the gas ejected during the merger (Elmegreen & Efremov 1996; Struck 1997; Smith et al. 2008; Boquien et al. 2009). An obvious question is, if intrinsically true, what drives the distance dependence on star formation rate density along the tidal tails? Different initial conditions could be responsible for the condensation of molecular gas that triggered star formation in the intergalactic medium. The gas along the tidal tails may have been expelled at different times during the merger process, or, alternately, as clumps of differing mass. These initial conditions might have been imprinted on the star formation rates by the distance dependence of star formation surface density. Pre-merger disk galaxies with different velocity components are shown to later become the post-merger galaxy NGC7252 (Hibbard & Mihos 1995). The gas expelled during the merger process can have the memory of the kinematics from the parent galaxies with different gas condensation time scales. The observed star formation rate density dependence with distance in the tidal tails of NGC7252 can then be explained by gas expelled at different times during the merging of two disk galaxies.
The candidate TDGs found along the tidal tail of NGC7252 show intense star formation. Their star formation rates are comparable with those of typical dwarf galaxies in the local Universe. The SFR distribution of a sample of 44 dwarf galaxies (dwarf irregular, blue compact dwarf, and Sm galaxies) measured from integrated GALEX FUV flux is shown in Fig. 6 (in grey) along with the SFR of the star-forming regions in the tidal tail (in red local Universe dwarf galaxy SFR from Hunter et al. 2010). One may question whether the TDGs are newly formed galaxies in the tidal tail or simply dwarf galaxies that happen to be in the field. The TDGs on the tidal tail are observed to have solar gas phase metallicity (12 + log (O/H) = 8.6). This is strong evidence supporting the formation of a dwarf galaxy from the pre-enriched gas on the tidal tails (Lelli et al. 2015). We also note that there is spatial gradient in SFR within the TDGs. This could be due to the clumpy nature of triggered star formation happening due to gas condensation within the pre-enriched gas thrown out of the galaxies during the merger process. The progenitors of at least a few (if not all) dwarf elliptical galaxies in the local Universe are proposed to be TDGs at higher redshifts (Dabringhausen & Kroupa 2013).
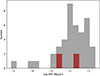 |
Fig. 6 Star formation rates of the star-forming regions in the tidal tail of NGC7252 are shown in red. The SFR distributions for dwarf galaxies in the local Universe from Hunter et al. (2010) are shown in grey. |
4 Summary
We have examined the spatially resolved star-formation properties of the post-merger galaxy NGC7252 using UV images acquired with the UVIT instrument onboard Astrosat. We identified recent star formation activity in NUV and FUV images, and derived star formation rates along the tidal tails and main body of NGC7252. The integrated SFR of NGC7252 computed without extinction correction is found to be 0.81 ± 0.01 M⊙ yr−1. The extinction in the central region of the galaxy assuming similar intrinsic SFR for the FUV and H α proxies is found to be ~2.33 mag. Significant star formation was detected in the TDG candidates (NGC7252E, SFR=0.02 M⊙ yr−1 and NGC7252NW, SFR = 0.03 M⊙ yr−1) which is comparable to the integrated star formation rates observed in dwarf galaxies in the local Universe. The star formation rate density of star forming regions in tidal tails seems to show a dependence on distance from the galaxy centre. This trend may be due to the difference in initial conditions responsible for the triggering of star formation in the molecular gas that was expelled during the recent merger in NGC7252.
Acknowledgements
We thank the referee for his/her comments that improved the scientific content of the paper. KG thank Smitha Subramanian for carefully reading the manuscript and providing comments. This publication uses the data from the AstroSat mission of the Indian Space Research Organisation (ISRO), archived at the Indian Space Science Data Centre (ISSDC). UVIT project is a result of collaboration between IIA, Bengaluru, IUCAA, Pune, TIFR, Mumbai, several centres of ISRO, and CSA. Indian Institutions and the Canadian Space Agency have contributed to the work presented in this paper. Several groups from ISAC (ISRO), Bengaluru, and IISU (ISRO), Trivandrum have contributed to the design, fabrication, and testing of the payload. The Mission Group (ISAC), ISTRAC (ISAC), UVIT-POC (IIA) continue to provide support in making observations with, and reception and initial processing of the data. We gratefully thank all the individuals involved in the various teams for providing their support to the project from the early stages of the design to launch and observations with it in the orbit.
References
- Agrawal, P. C. 2006, Adv. Space Res., 38, 2989 [NASA ADS] [CrossRef] [Google Scholar]
- Baldry, I. K., Glazebrook, K., Brinkmann, J., et al. 2004, ApJ, 600, 681 [NASA ADS] [CrossRef] [Google Scholar]
- Barnes, J. E., & Hernquist, L. 1992, Nature, 360, 715 [NASA ADS] [CrossRef] [Google Scholar]
- Bastian, N., Schweizer, F., Goudfrooij, P., Larsen, S. S., & Kissler-Patig, M. 2013, MNRAS, 431, 1252 [NASA ADS] [CrossRef] [MathSciNet] [Google Scholar]
- Bell, E. F., Wolf, C., Meisenheimer, K., et al. 2004, ApJ, 608, 752 [NASA ADS] [CrossRef] [Google Scholar]
- Blumenthal, G. R., Faber, S. M., Primack, J. R., & Rees, M. J. 1984, Nature, 311, 517 [NASA ADS] [CrossRef] [Google Scholar]
- Boquien, M., Duc, P.-A., Wu, Y., et al. 2009, AJ, 137, 4561 [NASA ADS] [CrossRef] [Google Scholar]
- Boquien, M., Buat, V., & Perret, V. 2014, A&A, 571, A72 [NASA ADS] [CrossRef] [EDP Sciences] [Google Scholar]
- Borne, K. D., & Richstone, D. O. 1991, ApJ, 369, 111 [NASA ADS] [CrossRef] [Google Scholar]
- Braine, J., Lisenfeld, U., Due, P.-A., & Leon, S. 2000, Nature, 403, 867 [NASA ADS] [CrossRef] [PubMed] [Google Scholar]
- Braine, J., Duc, P.-A., Lisenfeld, U., et al. 2001, A&A, 378, 51 [NASA ADS] [CrossRef] [EDP Sciences] [Google Scholar]
- Cardelli, J. A., Clayton, G. C., & Mathis, J. S. 1989, ApJ, 345, 245 [NASA ADS] [CrossRef] [Google Scholar]
- Chien, L.-H., & Barnes, J. E. 2010, MNRAS, 407, 43 [NASA ADS] [CrossRef] [MathSciNet] [Google Scholar]
- Cortese, L., Gavazzi, G., & Boselli, A. 2008, MNRAS, 390, 1282 [NASA ADS] [CrossRef] [Google Scholar]
- Dabringhausen, J., & Kroupa, P. 2013, MNRAS, 429, 1858 [NASA ADS] [CrossRef] [Google Scholar]
- Duc, P.-A. 2012, Astrophys. Space Sci. Proc. 28, 305 [NASA ADS] [CrossRef] [Google Scholar]
- Duc, P.-A., & Mirabel, I. F. 1994, A&A, 289, 83 [NASA ADS] [Google Scholar]
- Duc, P.-A., & Mirabel, I. F. 1998, A&A, 333, 813 [NASA ADS] [Google Scholar]
- Duc, P.-A., Brinks, E., Springel, V., et al. 2000, AJ, 120, 1238 [NASA ADS] [CrossRef] [Google Scholar]
- Duc, P.-A., Braine, J., Lisenfeld, U., Brinks, E., & Boquien, M. 2007, A&A, 475, 187 [NASA ADS] [CrossRef] [EDP Sciences] [Google Scholar]
- Dupraz, C., Casoli, F., Combes, F., & Kazes, I. 1990, A&A, 228, L5 [NASA ADS] [Google Scholar]
- Elmegreen, B. G., & Efremov, Y. N. 1996, ApJ, 466, 802 [NASA ADS] [CrossRef] [Google Scholar]
- Faber, S. M., Willmer, C. N. A., Wolf, C., et al. 2007, ApJ, 665, 265 [NASA ADS] [CrossRef] [Google Scholar]
- Fritze-v., Alvensleben, U., & Gerhard, O. E. 1994, A&A, 285, 751 [NASA ADS] [Google Scholar]
- Genzel, R., Tacconi, L. J., Rigopoulou, D., Lutz, D., & Tecza, M. 2001, ApJ, 563, 527 [NASA ADS] [CrossRef] [Google Scholar]
- George, K. 2017, A&A, 598, A45 [NASA ADS] [CrossRef] [EDP Sciences] [Google Scholar]
- George, K., & Zingade, K. 2015, A&A, 583, A103 [NASA ADS] [CrossRef] [EDP Sciences] [Google Scholar]
- Girish, V., Tandon, S. N., Sriram, S., Kumar, A., & Postma, J. 2017, Exp. Astron., 43, 59 [NASA ADS] [CrossRef] [Google Scholar]
- Hibbard, J. E., & Mihos, J. C. 1995, AJ, 110, 140 [NASA ADS] [CrossRef] [Google Scholar]
- Hibbard, J. E., & Yun, M. S. 1999, ApJ, 522, L93 [NASA ADS] [CrossRef] [Google Scholar]
- Hibbard, J. E., Guhathakurta, P., van Gorkom, J. H., & Schweizer, F. 1994, AJ, 107, 67 [NASA ADS] [CrossRef] [Google Scholar]
- Hunter, D. A., Elmegreen, B. G., & Ludka, B. C. 2010, AJ, 139, 447 [NASA ADS] [CrossRef] [Google Scholar]
- Iglesias-Páramo, J., Buat, V., Takeuchi, T. T., et al. 2006, ApJS, 164, 38 [NASA ADS] [CrossRef] [Google Scholar]
- Kaviraj, S., Darg, D., Lintott, C., Schawinski, K., & Silk, J. 2012, MNRAS, 419, 70 [NASA ADS] [CrossRef] [Google Scholar]
- Kennicutt, R. C., Jr. 1998, ApJ, 498, 541 [NASA ADS] [CrossRef] [Google Scholar]
- Kennicutt, R. C., & Evans, N. J. 2012, ARA&A, 50, 531 [NASA ADS] [CrossRef] [Google Scholar]
- Knierman, K. A., Gallagher, S. C., Charlton, J. C., et al. 2003, AJ, 126, 1227 [NASA ADS] [CrossRef] [Google Scholar]
- Komatsu, E., Smith, K. M., Dunkley, J., et al. 2011, ApJS, 192, 18 [NASA ADS] [CrossRef] [Google Scholar]
- Kroupa, P., Famaey, B., de Boer, K. S., et al. 2010, A&A, 523, A32 [NASA ADS] [CrossRef] [EDP Sciences] [Google Scholar]
- Kumar, A., Ghosh, S. K., Hutchings, J., et al. 2012, Proc. SPIE, 8443, 84431N [CrossRef] [Google Scholar]
- Lake, G., & Dressler, A. 1986, ApJ, 310, 605 [NASA ADS] [CrossRef] [Google Scholar]
- Laine, S., van der Marel, R. P., Rossa, J., et al. 2003, AJ, 126, 2717 [NASA ADS] [CrossRef] [Google Scholar]
- Lang, D., Hogg, D. W., Mierle, K., Blanton, M., & Roweis, S. 2010, AJ, 139, 1782 [Google Scholar]
- Lelli, F., Duc, P.-A., Brinks, E., et al. 2015, A&A, 584, A113 [NASA ADS] [CrossRef] [EDP Sciences] [Google Scholar]
- Metz, M., & Kroupa, P. 2007, MNRAS, 376, 387 [NASA ADS] [CrossRef] [Google Scholar]
- Miller, B. W., Whitmore, B. C., Schweizer, F., & Fall, S. M. 1997, AJ, 114, 2381 [NASA ADS] [CrossRef] [Google Scholar]
- O’Sullivan, E., Combes, F., Hamer, S., et al. 2015, A&A, 573, A111 [NASA ADS] [CrossRef] [EDP Sciences] [Google Scholar]
- Postma, J. E., & Leahy, D. 2017, PASP, 129, 115002 [NASA ADS] [CrossRef] [Google Scholar]
- Read, A. M., & Ponman, T. J. 1998, MNRAS, 297, 143 [NASA ADS] [CrossRef] [Google Scholar]
- Richter, O.-G., Sackett, P. D., & Sparke, L. S. 1994, AJ, 107, 99 [Google Scholar]
- Rossa, J., Laine, S., van der Marel, R. P., et al. 2007, AJ, 134, 2124 [NASA ADS] [CrossRef] [Google Scholar]
- Rothberg, B., & Joseph, R. D. 2006, AJ, 131, 185 [NASA ADS] [CrossRef] [Google Scholar]
- Schlegel, D. J., Finkbeiner, D. P., & Davis, M. 1998, ApJ, 500, 525 [NASA ADS] [CrossRef] [Google Scholar]
- Schweizer, F. 1978, Structure and Properties of Nearby Galaxies (Dordrecht: D. Reidel Publishing Co) IAU Symp., 77, 279 [NASA ADS] [CrossRef] [Google Scholar]
- Schweizer, F. 1982, ApJ, 252, 455 [NASA ADS] [CrossRef] [Google Scholar]
- Schweizer, F., Seitzer, P., Kelson, D. D., Villanueva, E. V., & Walth, G. L. 2013, ApJ, 773, 148 [NASA ADS] [CrossRef] [Google Scholar]
- Smith, B. J., Struck, C., Hancock, M., et al. 2008, AJ, 135, 2406 [NASA ADS] [CrossRef] [Google Scholar]
- Struck, C. 1997, ApJS, 113, 269 [NASA ADS] [CrossRef] [Google Scholar]
- Subramaniam,A., Tandon, S. N., Hutchings, J., et al. 2016, Proc. SPIE, 9905, 99051F [Google Scholar]
- Tandon, S. N., Hutchings, J. B., Ghosh, S. K., et al. 2017a, JApA, 38, 28 [NASA ADS] [Google Scholar]
- Tandon, S. N., Subramaniam, A., Girish, V., et al. 2017b, AJ, 154, 128 [NASA ADS] [CrossRef] [Google Scholar]
- Toomre, A. 1977, in Evolution of Galaxies and Stellar Populations, eds. B. M. Tinsley, & R. B. Larson (New Haven: Yale University Observatory), 401 [Google Scholar]
- Toomre, A., & Toomre, J. 1972, ApJ, 178, 623 [NASA ADS] [CrossRef] [Google Scholar]
- Visvanathan, N., & Sandage, A. 1977, ApJ, 216, 214 [NASA ADS] [CrossRef] [Google Scholar]
- Wang, Z., Schweizer, F., & Scoville, N. Z. 1992, ApJ, 396, 510 [NASA ADS] [CrossRef] [Google Scholar]
- Whitmore, B. C., Miller, B. W., Schweizer, F., & Fall, S. M. 1997, AJ, 114, 1797 [NASA ADS] [CrossRef] [Google Scholar]
- Zwicky, F. 1956, Erg. Exakt. Naturewiss., 29, 344 [Google Scholar]
The presence of dust can however attenuate the emitted Hα and FUV flux from the star-forming regions.
α(J2000) = 22h 20m 44.7s and δ(J2000) = 24d 40m 42s according to https://ned.ipac.caltech.edu/.
UVIT NUV N242W and FUV F148W filters have similar bandpass to GALEX NUV and FUV filters.
All Tables
All Figures
|
Fig. 1 NUV image of NGC7252 with intensity values in inverted grey colour-scale. The eastern and northwest tidal tails extending from the main body of the galaxy are clearly seen. The potential star-forming regions are clearly visible in the tidal tails. The optical B-band contour is overlaid on the NUV image in red. The NUV emission along the tidal tails is confined to narrow regions within optical image. The image is of size ~12.0′ × 8.0′ and the grey-scale is in units of counts per sec. |
| In the text | |
|
Fig. 2 NUV image of NGC7252 with a contrast level chosen to highlight the low-surface-brightness level features in the tidal tails. The tidal features are marked, and the colour scaling is shown in counts per second. |
| In the text | |
|
Fig. 3 Star-forming regions in the tidal tails of NGC7252 from the NUV image is shown in the boxes from subfigures (1)–(7) (corresponding to (A)–(H) in Fig. 2, excluding the central region (D) of galaxy). The scaling is chosen for each box to enhance the contrast to show the flux changes within the star forming regions. A colour bar is shown with scaling in counts per second. |
| In the text | |
|
Fig. 4 Star formation rate for NGC7252. The spatial variation of star formation in tidal tails and the main body of the galaxy is seen in the magnified regions within the boxes. The features are marked with labels for identification and the SFR of eachfeature is noted at the top of the box. |
| In the text | |
|
Fig. 5 Distance dependence on the integrated star formation rate density (star formation rate per unit area) of star forming regions on the tidal tail from the centre of NGC7252. |
| In the text | |
|
Fig. 6 Star formation rates of the star-forming regions in the tidal tail of NGC7252 are shown in red. The SFR distributions for dwarf galaxies in the local Universe from Hunter et al. (2010) are shown in grey. |
| In the text | |
Current usage metrics show cumulative count of Article Views (full-text article views including HTML views, PDF and ePub downloads, according to the available data) and Abstracts Views on Vision4Press platform.
Data correspond to usage on the plateform after 2015. The current usage metrics is available 48-96 hours after online publication and is updated daily on week days.
Initial download of the metrics may take a while.