Fig. 3
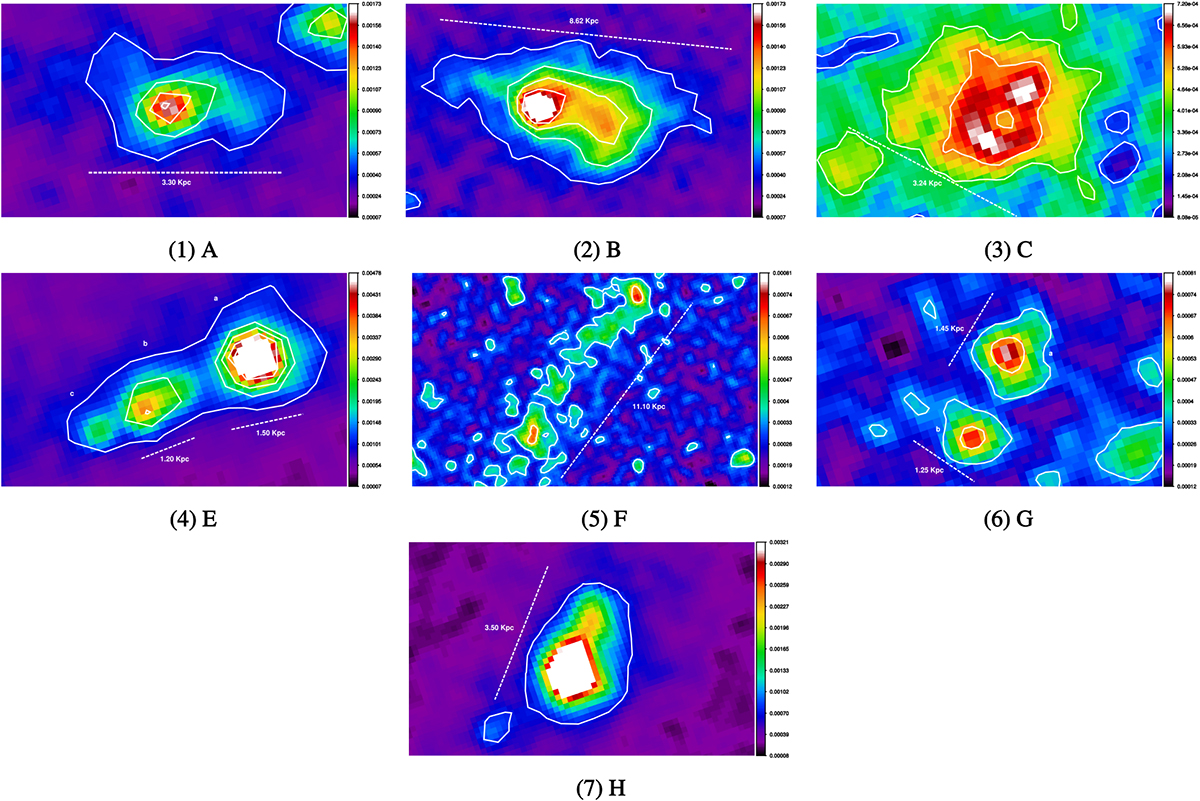
Star-forming regions in the tidal tails of NGC7252 from the NUV image is shown in the boxes from subfigures (1)–(7) (corresponding to (A)–(H) in Fig. 2, excluding the central region (D) of galaxy). The scaling is chosen for each box to enhance the contrast to show the flux changes within the star forming regions. A colour bar is shown with scaling in counts per second.
Current usage metrics show cumulative count of Article Views (full-text article views including HTML views, PDF and ePub downloads, according to the available data) and Abstracts Views on Vision4Press platform.
Data correspond to usage on the plateform after 2015. The current usage metrics is available 48-96 hours after online publication and is updated daily on week days.
Initial download of the metrics may take a while.