| Issue |
A&A
Volume 614, June 2018
|
|
|---|---|---|
| Article Number | A109 | |
| Number of page(s) | 13 | |
| Section | Galactic structure, stellar clusters and populations | |
| DOI | https://doi.org/10.1051/0004-6361/201832660 | |
| Published online | 21 June 2018 | |
Observing multiple populations in globular clusters with the ESO archive: NGC 6388 reloaded★
INAF - Osservatorio di Astrofisica e Scienza dello Spazio di Bologna,
Via Gobetti 93/3,
40129
Bologna,
Italy
e-mail: This email address is being protected from spambots. You need JavaScript enabled to view it.
Received:
18
January
2018
Accepted:
16
February
2018
Abstract
The metal-rich and old bulge globular cluster (GC) NGC 6388 is one of the most massive Galactic GCs (M ~ 106 M⊙). However, the spectroscopic properties of its multiple stellar populations rested only on 32 red giants (only 7 of which observed with UVES, the others with GIRAFFE), given the difficulties in observing a rather distant cluster, heavily contaminated by bulge and disc field stars. We bypassed the problem using the resources of the largest telescope facility ever: the European Southern Observatory (ESO) archive. By selecting member stars identified by other programmes, we derive atmospheric parameters and the full set of abundances for 15 species from high-resolution UVES spectra of another 17 red giant branch stars in NGC 6388. We confirm that no metallicity dispersion is detectable in this GC. About 30% of the stars show the primordial composition of first-generation stars, about 20% present an extremely modified second-generation composition, and 50% have an intermediate composition. The stars are clearly distributed in the Al–O and Na–O planes in three discrete groups. We find substantial hints that more than a single class of polluters is required to reproduce the composition of the intermediate component in NGC 6388. In the heavily polluted component the sum Mg+Al increases as Al increases. The sum Mg+Al+Si is constant, and is the fossil record of hot H-burning at temperatures higher than about 70 MK in the first-generation polluters that contributed to form multiple populations in this cluster.
Key words: stars: abundances / stars: atmospheres / stars: Population II / globular clusters: general / globular clusters: individual: NGC 6388
Based on observations collected at ESO telescopes under programmes 073.D-0211 (propr ietary), and 073.D-0760, 381.D-0329, 095.D-0834 (archival).
© ESO 2018
1 Introduction
Almost all Galactic globular clusters (GCs) are composed of multiple stellar populations (see e.g. Gratton et al. 2012, and Bastian and Lardo, 2017 for overviews, and Bragaglia et al. 2017 for an updated census). The multiple populations are both a challenge to any model of GC formation, and an important opportunity to understand the early evolution of GCs. The general outline of the first phases of the GCs lifetime currently seems to be clear (although there are some differing views, such as the presence of a single generation, e.g. Bastian et al. 2013). First, a stellar generation is formed of gas whose composition is dictated by type II supernovae nucleosynthesis (overabundance of α elements including oxygen, underabundance of other light elements such as Na, Al). The most massive stars in this first burst of star formation then evolve and contribute nuclearly processed matter (rich in elements from proton-capture reactions) to the gas pool from which a second stellar generation is formed with a mix of enriched ejecta and pristine gas. The ubiquitous anticorrelations C-N, Na–O, and Mg-Al found in GCs (e.g. Smith 1987; Carretta et al. 2009a,b; Mészáros et al. 2015) leave no doubts that this is the basic sequence of events at the GC birth time. What we still do not know is the exact nature of the first-generation polluters (e.g. intermediate-mass asymptotic giant branch AGB stars: Cottrell & Da Costa 1981; Ventura et al. 2001; fast rotating massive stars: Decressin et al. 2007; massive binaries: de Mink et al. 2009), and the sequence and duration of the feedback-regulated secondary star formation.
In this framework, each GC seems to have a different star formation history and the metal-rich ([Fe/H] = –0.44, Carretta et al. 2007a), massive (MV = −9.41 mag, Harris 1996, 2010 edition) bulge cluster NGC 6388 certainly deserves attention due to its peculiar features: (a) in addition to the red horizontal branch (HB) typical of old metal-rich GCs, NGC 6388 shows an extended blue HB, i.e. we see the second parameter at work within the same cluster. The He enrichment in the second-generation stars, as suggested by D’Antona, & Caloi (2004), is likely the explanation, as shown by NGC 6388 participating in the strong correlation between extension of the Na–O anticorrelation and maximum temperature on the HB (discovered by Carretta et al. 2007b); (b) NGC 6388 is a local counterpart of old, metal-rich populations found in distant elliptical galaxies, and its relevant population of hot HB stars is a likely contributor to the UV-upturn phenomenon (e.g. Yi et al. 1998); (c) NGC 6388 is a pivotal cluster that confirmed the existence of intermediate-mass black holes (IMBH 103−104 M⊙) whose evidence in this GC is controversial (Lanzoni et al. 2013, hereafter L13; Lutzgendorf et al. 2015).
The main observational problem in studying the composite stellar populations in NGC 6388 comes from the strong contamination by disc and bulge stars. In our FLAMES survey to study the Na–O anticorrelation in a large sample of GCs (see Carretta et al. 2006) we were the first to obtain high-resolution spectra of many stars in NGC 6388, using FLAMES (Carretta et al. 2007a, 2009b), but without previous information on membership about one-half of the stars had to be discarded. We were only able to measure O and Na in 32 member stars along the red giant branch (RGB), 7 of which with UVES, almost the lowest number in our FLAMES GC survey. The other two GCs with a comparably low numbers of stars measured with respect to their total mass were the bulge GC NGC 6441 (a twin of NGC 6388 also in this regard) and the very metal-poor M 15 (NGC 7078).
Despite this limitation, in NGC 6388 we were able to find a conspicuous fraction (19%) of second-generation stars with extremely modified composition, rich in Na (and likely He) and poor in O. These extreme stars are not found in all GCs; their fraction is second only to M 54 and is similar to the very peculiar GC NGC 2808 (Carretta 2015). Clearly, thisshould be corroborated by more robust statistics. Larger samples would also be useful to establish beyond any doubt that NGC 6388 does not belong to the increasing class of the iron-complex GCs (see Johnson et al. 2015; Marino et al. 2015 and references therein), characterized by consistent metallicity dispersion and correlated [Fe/H]1 and s-process element enhancements. All GCs in this class are among the most massive in the Milky Way, hence NGC 6388 classifies as a good candidate, even if no such signature was found in our first analysis (Carretta et al. 2007a, 2009b).
To improve the pool of member stars in NGC 6388 we took advantage of the huge potential of the ESO archive, where more than 300 stars, observed mostly with the FLAMES high-resolution GIRAFFE set-up HR21, are available for this cluster. While these data were originally acquired to explore the velocity dispersion (L13), part of the spectra can be also exploited to derive abundances. In the present work we started by analysing the high-resolution UVES spectra taken within different programmes for 17 new RGB stars in NGC 6388. The large spectral coverage of UVES ensures a large number of transitions for a variety of species. Hence, we can provide abundances of elements from proton-captures to improve the chemical characterization of multiple populations in NGC 6388, and possibly to investigate the existence of discrete components. The [Fe/H] distribution of the enlarged sample may confirm (or disprove) the conclusion that no intrinsic metallicity dispersion is present in this cluster. The elements from α-captures and those belonging to the Fe-peak can be compared to those of disc and bulge stars.
We have organized the paper as follows. The adopted datasets from the ESO archive are described in Sect. 2, and the analysis and the error budget are discussed in Sects. 3 and 4, respectively. Section 5 is devoted to the results regarding multiple populations in NGC 6388 and Sect. 6 to a brief description of the other elements derived in the analysis. Finally, in Sect. 7 we summarise our findings and illustrate future prospects.
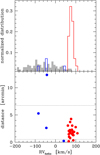 |
Fig. 1 Upper panel: distribution of heliocentric RVs for our sample (open histogram) and the tile closest to the position of NGC 6388 in Zoccali et al. (2017, grey histogram), both normalized to the total numbers in each sample (28 and 437 stars, respectively). Bottom panel: radial velocities in NGC 6388 as a function of the distance from the cluster centre (red: classified members, blue: non-members). The half-mass and tidal radii are indicated by the horizontal lines. |
2 Adopted datasets
Our present sample was assembled from our private data (Carretta et al. 2007a, 2009b) and the ESO archival spectra of three programmes: 381.D-0329(B), PI Lanzoni; 073.D-0760(A), PI Catelan; and 095.D-0834(A), PI Henault-Brunet (hereafter L13, CAT, and H-B, respectively). The first was only devoted to searching for kinematical signatures of IMBH in NGC 6388, and the results were published in L13. The aims of the other two programmes included exploring the chemistry of this GC.
We consider here only the UVES spectra. UVES observation from L13 include four fibre configurations, one of them repeated twice, for a total of eight stars, one of which is a non-member based on its radial velocity (RV; see below). The H-B UVES sample includes six stars, repeated ten times, two of which are non-members. Finally, the CAT data consists of three exposures, only two of which are usable, with two fibre configurations and a total of 14 observed stars, including one non-member.
We considered as good candidate member stars of NGC 6388 all the objects with heliocentric RV between 60 and 110 km s−1. In addition to being in agreement with the limits adopted by the extensive work by L13 (their Fig. 4 and Sect. 3.1), this interval shows a clear peak in the RV distribution (Fig. 1, upper panel). As a comparison, we show the distribution of bulge stars from Zoccali et al. (2017), selecting only the stars closer in latitude and longitude to NGC 6388. The two normalized distributions indicate that our choice of candidate member stars is robust. Twenty-four out of 28 stars are probable members and we show their RV as function of the distance from the cluster centre in the bottom panel of Fig. 1. One of the non-members is outside the cluster tidal radius, while the majority of observed stars lie between the half-mass and tidal radii (both values from Harris 1996). Larger samples, especially those close to the centre (as in L13) would describe the radial properties more accurately.
Neglecting stars whose spectra have a S/N that is too low for a reliable abundance analysis (S∕N ~ 10 in the combined spectrum), we finally considered 11 stars from CAT, 5 from L13, and only 1 from H-B, for a total of 17 RGB stars. The final S/N per pixel is between ~20 and ~50, enough for relatively cool stars in a metal-rich GC. The relevant information (star ID, sample, original star names, coordinates, magnitudes, and heliocentric RVs) are given in Table 1. Since different naming conventions are used in the original samples, for the sake of simplicity we adopt here a new homogeneous convention called “Ann”: A for archive and nn for a number from 1 to 17. Table 1 also lists the original star names and those of the photometry source.
For sake of homogeneity with our previous work, we used our BV I photometry obtained with the Wide Field Imager (WFI) at the 2.2 m ESO/MPI telescope in La Silla (ESO Programme 69.D-0582). The detailed reduction and calibration procedures for photometry and astrometry are provided in Carretta et al. (2007a). Optical photometry was complemented with near-IR K magnitudes from 2MASS (Skrutskie et al. 2006), mandatory to have the atmospheric parameters in our homogeneous scale (see below). Stars A10 and A14 have no identifications in our WFI photometry;V magnitudes from these objects were assigned using a V versus K calibration derived from 47 other stars in NGC 6388 (Carretta et al. 2007a, 2009b) when both sets of data were available. The new sample and the previously analysed datasets are shown on the V, B − V colour-magnitude diagram (CMD) in Fig. 2.
The UVES Red arm spectra (obtained with the 580 nm set-up, spectral range ~ 4800−6800 Å, resolution ~ 47 000) were reduced with the ESO pipeline using Reflex v2.8.5. The de-biased, flat-fielded spectra, which were extracted to 1D and wavelength calibrated, were sky subtracted and shifted to zero radial velocity using IRAF2. We measured RVs for each spectrum using about 80 atomic lines with the IRAF package RVIDLINES. The resulting heliocentric RVs and the relative errors are shown in the last columns of Table 1. From our sample of 17 stars we found an average RV of 77.7 ± 2.9, σ = 11.8 km s−1, in good agreement with the values derived in Carretta et al. (2007a) from seven stars only (79.1 ± 1.0 σ = 3.0 km s−1) and in the literature (81.2 ± 1.2 km s−1, Harris 1996, and 82.0 ± 0.5 σ = 7.7 km s−1 from 240 stars in L13). The spectra were then shifted to zero radial velocity and co-added for each star.
Information on stars analysed in NGC 6388.
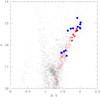 |
Fig. 2 V, B − V colour-magnitude diagram for NGC 6388 using WFI photometry (small grey points). Large blue filled circles indicate the stars in our new sample with UVES spectra. Filled red triangles are giants with UVES spectra analysed in Carretta et al. (2007a) and empty red circles are stars with GIRAFFE spectra studied in Carretta et al. (2009b). |
3 Analysis, atmospheric parameters, and metallicity
The steps for the derivation of the atmospheric parameters were the same adopted in all our FLAMES survey, and in particular for the analysis of the seven giants with UVES spectra in NGC 6388 (Carretta et al. 2007a). Effective temperatures are obtained from a calibration between K magnitudes and Teff from dereddened V − K (using the Alonso et al. 1999, 2001 relation). The calibration as a function of K magnitudes was derived from 33 member stars in NGC 6388 (Carretta et al. 2009b). Derived temperatures were used with apparent magnitudes, a distance modulus  , and bolometric corrections from Alonso et al. (1999) to derive surface gravities (adopting masses) of 0.90 M⊙ and Mbol,⊙ = 4.75. The distance modulus and the adopted reddening E(B − V) = 0.37 are from (Harris 1996). We used the relations E(V − K) = 2.75E(B − V), AV = 3.1E(B − V), and AK = 0.353E(B − V) from Cardelli et al. (1989).
Our analysis is based on equivalent widths (EWs) measured with the ROSA package (Gratton 1988) following the procedure described in Bragaglia et al. (2001). The line list and solar reference abundances used throughout our FLAMES survey are described in Gratton et al. (2003). Values of the microturbulent velocity vt were derived by minimizing the slope of the relation between abundances of Fe I and expected line strength (see Magain 1984). Finally, the model atmosphere with appropriated parameters is chosen from the Kurucz (1993) grid by selecting the model with abundance equal to the average abundance from Fe I lines. Derived atmospheric parameters and Fe abundances for individual stars are listed in Table 2, whereas mean abundances for the new sample, the previous analysis by Carretta et al. (2007a), and the combined sample are shown in Table 3.
Adopted atmospheric parameters and derived iron abundances in NGC 6388.
4 Error analysis and derived metallicity
The procedure used here to estimate star-to-star errors due to uncertainties in the adopted atmospheric parameters and in the EW measurements closely follows that used in Carretta et al. (2007a), so we will not describe it here. The results are summarized in Table 4 where we show the adopted variation and estimated errors in the atmospheric parameters (first three lines), the sensitivities of abundances to changes in atmospheric parameters (body of the table, Cols. 3 and 4) and to errors in EWs (Col. 6), and the estimated star-to-star and systematic errors (last two columns). The main difference with the treatment of errors as described in Carretta et al. (2007a) is that sensitivities are derived not from a single star in the middle of the temperature range, but instead using averages from all stars in the sample. Other differences in the adopted uncertainties are those related to quantities that vary in the two analyses: number of lines (affecting the internal error in EW measurements), the slope of the relation abundance-expected line strength (affecting the internal error in vt), the mean dereddened V − K colour (which enters the systematic error in Teff), and so on.
On the abundance scale defined in our FLAMES survey, the metallicity of NGC 6388 from the present sample with UVES spectra is [Fe/H] = −0.475 ± 0.009 ± 0.018 dex, σ = 0.038 dex (17 stars), where the first and the second are statistical and systematic errors, respectively. We do not find evidence of intrinsic scatter in the metal abundance for NGC 6388 since the observed scatter of 0.038 ± 0.009 dex closely agrees with the scatter of 0.045 ± 0.011 expected by the uncertainties in the analysis (see Table 4). This conclusion is strengthened by the combined sample with UVES spectra; when we add the seven stars analysed in a homogeneous way in Carretta et al. (2007a), we obtain a mean metallicity [Fe/H] = −0.465 ± 0.008 dex, with σ = 0.041 dex (24 stars), excluding any intrinsic dispersion in Fe in this cluster.
Abundances of Fe from neutral and singly ionized lines are shown as a function of the effective temperatures in Fig. 3 (upper and lower panels, respectively), where we compare the results from the UVES spectra (current and previous work, filled squares and triangles) to those obtained from the GIRAFFE spectra (Carretta et al. 2009b, open circles). The difference [Fe/H] II–[Fe/H] I is plotted in the lower panel. As in Carretta et al. (2007a), the mean value from singly ionized Fe lines is slighly higher: [Fe/H] = −0.378 ± 0.014 dex, σ =0.059 dex (17 stars). On average, the difference is scarcely significant: 0.097 ± 0.011 dex, σ = 0.046 dex for the present sample (0.090 ± 0.014 dex, σ = 0.066 dex for the combined sample of 24 stars with UVES spectra). This offset is most likely related to uncertainties in the measurement of relatively weak lines on spectra of moderate S/N. We can exclude deviations from the local thermodynamic equilibrium (LTE) since we do not observe any trend as a function of temperature. If the difference were due to departures from LTE, we would expect larger effects in lower gravity (lower Teff) stars, where the thermalizing effect of collisions is not pronounced (Gratton et al. 1999), which is not the case (lower panel in Fig. 3).
Abundances for proton-capture, α−capture, and iron-peak elements in individual RGB stars of NGC 6388 from the present analysis are listed in Table 5–7, respectively. Average values are in Table 3. Finally, in Table 8 we report abundances of Zn obtained from the UVES spectra of the seven stars analysed in Carretta et al. (2007a), since this species was not derived in that work.
Mean abundances from UVES for the present and previous samples and their combination.
Sensitivities of abundance ratios to variations in the atmospheric parameters and to errors in the equivalent widths, and errors in abundances for stars of NGC 6388 observed with UVES.
5 Multiple stellar populations
5.1 Proton-capture elements in NGC 6388
We derived the abundances of O, Na, Mg, and Al, which are light elements involved in the network of proton-capture reactions in hot H-burning, for all 17 stars in the present sample.
The forbidden line [O I] 6300 Å was measured on the spectra after cleaning from contamination by telluric lines. Using the coolest star in our sample, we checked that the blending of the weak high-excitation Ni I line at 6300.336 Å is expected to contribute about 4.4 mÅ to the EW of the [O I] line, using the line parameters by Johansson et al. (2003). This corresponds to correcting the O abundances about 0.031 dex downward. On the other hand, this effect is almost compensated by the underestimate of O abundances due to neglecting CO formation; we thus followed the approach used by Gratton et al. (2006) in the analysis of NGC 6441, a twin GC of NGC 6388 in several features, and we did not apply any corrections for the above-mentioned small effects. Na abundances are corrected for effects of departures from the LTE assumption using prescriptions by Gratton et al. (1999) as was done homogeneously in our group’s FLAMES survey.
The run of abundance ratios for O, Na, Mg, Al, and Si as a function of effective temperatures is shown in Fig. 4, whereas in Figs. 5 and 6 we summarize the relations among these light elements. In the present work we more than tripled the number of stars (from 7 to 24) with proton-capture elements derived from high-resolution UVES spectra. Moreover, in the Na–O plane we also added stars with abundances obtained with homogeneous methods from GIRAFFE spectra, with a total of 49 stars with both Na and O in NGC 6388, more in line with our results for other GCs in our survey.
The interquartile range of the [O/Na] ratio, IQR[O/Na], defines the extension of the Na–O anticorrelation and is a good proxy for the extent of the nuclear processing altering the composition of second-generation stars (Carretta 2006; Carretta et al. 2010). The value IQR[O/Na] = 0.644 from the combined sample of 49 stars places NGC 6388 in the region of the IQR-MV plane populated by GCs that seem to have Na–O anticorrelation that is too short when compared to their high mass (total absolute magnitude): NGC 6441, M 15, and 47 Tuc (see Fig. 7). However, when the modulation to the mass-IQR relation given by the cluster concentration c is also takeninto account (as suggested in Carretta et al. 2014, see their Figs. 7 and 14), the scatter is much reduced and all these outliers, including NGC 6388, are found on the same linear relation.
According to the definition given in Carretta et al. (2009b), we confirm that NGC 6388 hosts a large population of stars with extremely modified composition (E fraction = 20 ± 6%, comparable to that of NGC 2808), whereas in about a third of stars (31 ± 8%) the primordial composition of typical halo stars is still preserved. The remaining stars (49 ± 10%) show an intermediate chemical pattern.
The variation of Mg is not large. The anticorrelation of Mg with Si would indicate a leakage from the MgAl cycle on 28Si (Karakas & Lattanzio 2003), which becomes dominant only when the interior temperature T6 ≳ 65 K (Arnould et al. 1999). Apparently, the significance of this anticorrelation in NGC 6388 only rests on the star with the highest [Mg/Fe] and does not seem mirrored by the expected Si–Al correlation (see Fig. 6).
However, from the upper panel in Fig. 8 we see that as the ratio [Al/Fe] increases, the sum Mg+Al stays approximatively constant only up to [Al/Fe] ≃ 0.5 − 0.6 dex, i.e. up to typical values of the stars in the extreme component. Afterward, the sum is no longer constant, and a clear trend is visible. This trend is completely erased when Si abundances are also taken into account, as in the lower panel in Fig. 8. The ratio [(Mg+Al+Si)/Fe] is constant (average value 0.299 dex, with σ =0.037 dex, and indicates that a certain amount of 28Si was produced by the the 27Al(p,γ)28Si reaction in the polluters that were active in FG stars of NGC 6388 despite the absence of clear Al–Si correlation and Mg-Al anticorrelation.
We also observed well-defined (anti) correlations between Al and O and Na, respectively (Fig. 6). Stars do not seem uniformly distributed in NGC 6388, in particular along the Al–O anticorrelation, as shown in Fig. 9. From the primordial to the most extreme composition the groups are populated by 9, 12, and 3 stars, respectively, so that the PIE fractions match those derived from the classical definition (using O, Na) within the associated Poisson errors.
We combined the [O/Al] ratios for the subsamples P+I (21 stars) and I+E (15 stars) and used Hartigans’ dip test implemented in the R package to evaluate the unimodality/multimodality of their respective distributions. In both cases the alternative hypothesis that the distribution is non-unimodal, i.e. that it is at least bimodal, is favoured.
A further confirmation is given by Ashman’s D statistics (Ashman et al. 1994), a measure of how well differentiated two distributions are. For a clean separation, D > 2 is required, and we obtained D = 4.01 and D = 4.21 for the combination I+E and I+P, respectively. The same test applied to the PIE distribution in the Na–O plane returns values of D = 3.13 and D = 3.42 when the combined sample GIRAFFE+UVES is used, and D = 2.79 and D = 2.87 when only the sample with UVES spectra is adopted. In other words, this is equivalent to saying that the separation between thethree groups is much larger than the dispersion within each component; the same argument was recently used by Johnson et al. (2017) to decompose the multiple populations in NGC 5986 into 4 or 5 discrete components.
Light element abundances.
Abundances of α elements.
Iron-peak abundances.
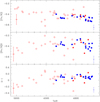 |
Fig. 3 Iron abundances from neutral and singly ionized lines (upper and middle panels, respectively) and their differences (lower panel) as a function of the effective temperatures. Filled symbols are stars with UVES spectra (blue circles: this work, red triangles: Carretta et al. 2007a), whereas open circles are stars with GIRAFFE spectra (Carretta et al. 2009b). Star-to-star error bars for GIRAFFE and UVES are indicated on the left and right side, respectively. |
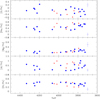 |
Fig. 4 Abundance ratios for proton-capture elements O, Na, Mg, Al, and Si (from top to bottom) from UVES spectra as a function of the effective temperatures in NGC 6388. Red triangles: RGB stars from Carretta et al. (2007a); blue circles: new sample from the present work, with internal errors plotted in each panel. |
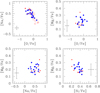 |
Fig. 5 Relations among the abundance ratios of O, Na, Mg, and Si. Symbols are as in Fig. 4. In the top left panel, open circles are stars of NGC 6388 with abundances derived from GIRAFFE spectra in Carretta et al. (2009b). |
Abundances of Zn and Nd for stars in Carretta et al. (2007a).
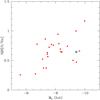 |
Fig. 7 Interquartile range of the [O/Na] ratio vs total absolute magnitude for GCs in our FLAMES survey, with the updated value derived in the present work for NGC 6388 (cyan star simbol). |
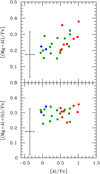 |
Fig. 8 Upper and lower panels: Mg+Al and Mg+Al+Si, respectively, as a function of the [Al/Fe] abundance. Blue, green, and red circles respectively indicate stars of the P, I, and E components, according to the definition by Carretta et al. (2009b). |
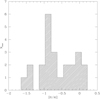 |
Fig. 9 Histogram of the distribution of stars along the Al–O anticorrelation. |
5.2 How many classes of polluters?
The temperature range pointed out by the leakage from the MgAl cycle on 28Si (the constant Mg+Al+Si sum) does not help us much to efficiently discriminate among the putative candidate polluters, as none individually seems to be free from drawbacks strictly related to nucleosynthetic considerations (see Bastian et al. 2015; Prantzos et al. 2017).However, our data may at least help to constrain how many classes of polluters are required to reproduce the observed anticorrelations of proton-capture elements in NGC 6388.
In the middle and right panels of Fig. 10 we show simple dilution models (see e.g. Carretta et al. 2009b) obtained by mixing the composition of the E component with different amounts of pristine gas, i.e. with the same composition of stars in the primordial P component. By construction, the models are then anchored to the average values of the stellar populations (large black filled circles: Al–O in the upper panels and Na–O in the lower panels). For Al–O we show the results using the division in P, I, and E components derived both from the Al–O anticorrelation, where the separation into discrete groups is more easily seen, and from the Na–O anticorrelation. The latter is the one usually used to separate these components following the classical definition in Carretta et al. (2009a). For the Na–O anticorrelation we used both the combined GIRAFFE+UVES sample and the UVES data only, as derived in the present work.
In the Na–O plane, the model passes through each average value quite well and within the associated rms scatters. This would indicate that the intermediate I componentcan be obtained by mixing the pure ejecta from a single class of polluters (group E) with primordial gas with the same composition of the P group. Had we used all the set of stars with GIRAFFE and UVES spectra (49 objects), the dilution model would have reproduced the I group even better. However, this enlarged sample would not be entirely consistent with the upper panels, where only the 24 stars from UVES spectra are available for this exercise.
When Al is also considered, as in the upper panels, the I component seems to be only marginally consistent with a single dilution model when the classification from the Al–O combination is used (middle panel) and it seems even less adequate if the usual classification from the Na–O combination is adopted.
We can better quantify this finding using the same approach followed by Carretta et al. (2012) for NGC 6752. Let a population with intermediate composition be obtained by mixing a fraction dil of matter with E-like composition together with a fraction (1-dil) of pristine gas (P composition). Then, in the case of a single class of polluters the value of dil must be the same forall elements
![Mathematical equation: \begin{equation*} dil = { {[A(\textrm{Mg})_I-A(\textrm{Mg})_P]} \over {[A(\textrm{Mg})_E-A(\textrm{Mg})_P]} } = { {[A(\textrm{O})_I-A(\textrm{O})_P]} \over {[A(\textrm{O})_E-A(\textrm{O})_P]} } ,\end{equation*}](/articles/aa/full_html/2018/06/aa32660-18/aa32660-18-eq2.png) (1)
(1)
where A(el) are the abundances in number of atoms.
The results from different sample combinations and species are summarised in Table 9 and in Fig. 11, where we plot the dil values as a function of the atomic number of the considered element. Average values from all species are represented by a solid line, together with ± 1σ values.
What conclusions can we draw from this exercise? First, we note that for Na and O the dil value seems to be the same in all cases, within the uncertainties, although when the UVES sample is split according to the Al–O anticorrelation the similarity is marginal (see also the middle upper panel in Fig. 10). However, these elements are both probes of polluters with a moderate inner temperature (> 40 × 106 K, ON and NeNa cycles), and so moderate masses.
As an indicator of higher mass polluters we can use the MgAl cycle occurring at higher temperatures (> 70 × 106 K, e.g. Denisenkov & Denisenkova 1989; Langer et al. 1993). Values of dil for Mg are not plotted in Fig. 11 because of the large associated errors (see Table 9), which are due to the limited size of the sample and to the small range of variation of Mg (see e.g. Fig. 6). However, the other element involved in this cycle, Al, provides the indication that the composition of the I group is still compatible (but just barely) with a single class of polluters. Also taking into account the contribution of Si (Fig. 8 and middle panel of Fig. 11), there is a substantial hint that more than a single class of polluters may be required to reproduce the chemical pattern of the stellar population with intermediate composition in NGC 6388.
It should be noted that the largest available sample (GIRAFFE+UVES) only has Na and O derived for proton-capture elements, and lacks Al abundances. On the other hand, for stars with derived Al abundances, only two stars are in the P group (separation with Na, O) and only three in the E group (separation with Al, O) and this may make it difficult to obtain clear results. A larger sample of stars with Al abundances determined together with O, Na, and Mg would be highly desirable.
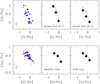 |
Fig. 10 Simple dilution models for the Al–O and Na–O anticorrelations. Upper left panel: observed Al–O data. Upper middle panel: dilution model anchored to the mean values of the P and E components (large black points). Error bars here are rms scatter values and the separation into the P, I, and E components is made according to the Al–O data. Upper right panel: same, but following the classical P, I, E classification from the Na–O anticorrelation. Lower panels: same as upper panels, but for the Na–O data. The middle panel refers to the combined GIRAFFE+UVES sample, and the right panel to the UVES data alone. |
Dilution fractions from the GIRAFFE and UVES samples.
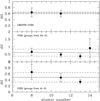 |
Fig. 11 Dilution values for different species (indicated by atomic number). The reference samples are labelled in each panel. Solid and dashed lines represent the average value of dil and ± 1σ, respectively. |
5.3 Radial distribution
The main scenarios for the origin of multiple populations in GCs predict that SG stars are expected to be formed more radially concentrated as a consequence either of a cooling flow collecting gas at the cluster centre (e.g. D’Ercole et al. 2010) or of the gas from equatorial discs of rotating massive stars gathering in the cluster central regions (Decressin et al. 2010). Both photometric and spectroscopic observations generally support this prediction, although counter-examples do exist (up to date references can be found in Johnson et al. 2017).
A further complication is that dynamical simulations like those by Vesperini et al. (2013) show that spatial mixing may begin when a considerable fraction of the cluster mass (90% or more) is lost. However, the memory of the initial conditions may be saved, even if the half-mass relaxation time is rather short for NGC 6388 (0.79 Gyr, Harris 1996, on line edition 2010).
The comparison between the cumulative radial distribution of FG (P composition) and SG stars (I or E composition) is shown in Fig. 12 using the usual classification from Na and O. The SG stars are more concentrated than FG stars; however, only for groups P and E does a Kolmogorov–Smirnov test provide evidence to safely reject the null hypothesis that the two components are extracted from the same parent population. The comparison between P and I, and I and E, on the other hand, does not return a statistically significant evidence.
Unfortunately, the currently available data cannot tell us more. Vesperini et al. (2013) also showed that the radial coverage of the samples is crucial, and they indicate that the local ratio SG/FG is equivalent to the global value only in the cluster region around 1–2 half-mass radii. In our sample we only have one star in the P group and one in the I component within 1 arcmin from the centre, i.e. about two times the half-mass radius (rh = 0.52 arcmin) of NGC 6388. The present sample is not well tailored to properly address this issue, and unfortunately the radial distribution of multiple stellar populations in NGC 6388 has not yet been studied using photometry. We hope it will be done, combining the central regions best observed with the HST and the external regions easily accessible from the ground.
Samples for comparison of elements in NGC 6388 and in field stars.
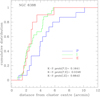 |
Fig. 12 Cumulative radial distribution of first- and second-generation stars in NGC 6388. The results of the Kolmogorov–Smirnov test between the distribution of FG and SG stars are labelled. |
6 Other elements
The main aim of the present work is to expand the sample useful for studying multiple stellar populations in NGC 6388; however, looking at the set of other elements derived in the present analysis may also be interesting. To better put this cluster in the context of Galactic populations we compared its proton- and α-capture elements, aswell as those of the Fe-group, with different samples whose metallicity is close to that of NGC 6388. The adopted comparison samples are listed in Table 10, along with the symbols used in the respective figures. All the datasets are shifted to our system of solar reference abundances using values quoted in the original papers3. However, other offsets due to the different approaches (scales of adopted atmospheric parameters, line lists, model atmospheres, etc.) may obviously be present.
In Fig. 13 we fully appreciate the chemical signature of a globular cluster from the clear departure of the proton-capture elements O, Na, Mg, and Al from the patterm defined by the field stellar populations. The O depletion and Na enhancement clearly set the stars of NGC 6388 apart from any Galactic component at [Fe/H] ~ −0.5 dex, either disc or bulge stars. The average abundance of Mg in NGC 6388 is at the lower edge of any distribution, being much lower than the typical level of bulge stars.
Regarding other α elements (Fig. 14), we see that the level of [Si/Fe] is higher than in field stars, confirming the relevance of the contributionfrom high-temperature H-burning to the chemical pattern of stars in NGC 6388. The [Ca/Fe] values are, on average, slightly lower than for field disc and bulge stars. The reasonably good agreement of the average abundances of Ti from neutral and ionized transitions, within the errors, supports the reliability of the adopted atmospheric parameters. They are also similar to those of field stars even if, unfortunately, we did not find samples of bulge stars for comparison to [Ti/Fe] II (or [Sc/Fe] II, Fig. 15).
The scatter of Sc seems to be comparable to that of field stars (Fig. 15). The [Mn/Fe] ratios agree more closelywith the lower values found in disc stars than in bulge stars, while Ni is indistinguishable among the various stellar populations. The Zn abundances show a large scatter, but they rest only on a single line (see Table 7). The mean Zn abundance in NGC 6388 seems to be in agreement with the mean trend in field stars.
We conclude with a reminder that Casetti-Dinescu et al. (2010) found NGC 6388 to be part of a kinematic system hotter than the thick disc, and centred on the Galactic bulge. Furthermore, from similarities with the twin globular cluster NGC 6441, they considered the possibility that the two GCs could have been formedin the same dwarf galaxy, and later accreted by the Milky Way. Our data and the differences with respect to the bulge samples, could perhaps be interpreted in this framework, although a more homogeneous analysis would be required concerning field stars.
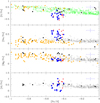 |
Fig. 13 Comparison of abundances of O, Na, Mg, and Al in NGC 6388 with different samples of field stars. Blue circles and red filled triangles are stars in NGC 6388. The samples, references, and symbols for the field stars are in Table 10. The internal error bars displayed refer to the sample analysed in the present work. |
7 Summary and conclusions
We analysed high-resolution UVES spectra of 17 RGB member stars of the massive and metal-rich globular cluster NGC 6388. These stars were observed mainly to derive radial velocities, but they can be also used to derive abundances of several elements. We obtained abundances of proton-capture (O, Na, Mg, Al, Si) elements, α elements (Ca, Ti), and iron-group elements (Sc, V, Cr, Mn, Co, Ni, Zn) for the present new sample, to be added to the similar analysis of other 7 giants in Carretta et al. (2007a), for a total of 24 stars with homogeneous abundances from high-resolution spectra.
We confirm that this cluster hosts one of the largest fractions (20%) of stars with extremely modified composition, according to the usual classification by Carretta et al. (2009b). About a third of the stars (31%) still have the primordial composition of FG stars; this value is typical of what was found for other GCs in our FLAMES survey (e.g. Carretta et al. 2009a,b). The other half of the stars shows an intermediate composition.
The distribution of stars in the Al–O plane presents three distinct groups. Statistical tests strongly support the idea that these are discrete components, as also confirmed by the star distribution along the Na–O anticorrelation.
Thorough examination of simple dilution models for all the available light elements provides substantial hints that more than asingle class of FG polluters is required to account for the chemical composition of the intermediate component. By simply tripling the sample of stars with all proton-capture elements derived homogeneously, we have already highlighted that two kinds of polluters of different masses were probably at work: one for ordinary Na–O processing at moderate temperature, the other reaching higher temperatures necessary to generate the Mg depletion and even some leakage on Si. This conclusion is strongly supported by the fact that the sum Mg+Al stops being constant for the stars in the extreme SG component. For this E fraction, it is the sum Mg+Al+Si that is constant.
A more clear-cut solution of this issue is hampered by the lack of a larger sample of stars where the full set of the key elements characterizing multiple populations in GC is simultaneously available. This can be obtained using intermediate resolution GIRAFFE spectra; NGC 6388 is quite metal-rich and precise enough abundances of Na, O, Mg and Al can be obtained from GIRAFFE spectra with the HR13 and HR21 set-ups, respectively. We were granted time at ESO VLT-UT2 to observe about 60–70 secure member stars. When all proton-capture elements are derived for all stars from proprietary and archival spectra, it will be possible to apply a statistical cluster analysis to confirm or reject the existence of discrete populations and their compositions with more precise insights on the nature and number of classes of FG polluters in this cluster.
Acknowledgements
We wish to thank the anonymous referee for the constructive suggestions that helped to improve the paper. We gratefully acknowledge the use of the ESO Science Archive Facility. This publication makes use of data products from the Two Micron All Sky Survey, which is a joint project of the University of Massachusetts and the Infrared Processing and Analysis Center/California Institute of Technology, funded by the National Aeronautics and Space Administration and the National Science Foundation. This research has made use of the SIMBAD database (in particular Vizier) operated at CDS, Strasbourg, France, of the NASA Astrophysical Data System, of TOPCAT (http://www.starlink.ac.uk/topcat/), and of R: A language and environment for statistical computing, R Foundation for Statistical Computing, Vienna, Austria. ISBN 3-900051-07-0, URL http://www.R-project.org.
References
- Alonso, A., Arribas, S., & Martinez-Roger, C. 1999, A&AS, 140, 261 [NASA ADS] [CrossRef] [EDP Sciences] [Google Scholar]
- Alonso, A., Arribas, S., & Martinez-Roger, C. 2001, A&A, 376, 1039 [NASA ADS] [CrossRef] [EDP Sciences] [Google Scholar]
- Alves-Brito, A., Meléndez, J., Asplund, M., Ramírez, I., & Yong, D. 2010, A&A, 513, A35 [NASA ADS] [CrossRef] [EDP Sciences] [Google Scholar]
- Arnould, M., Goriely, S., & Jorissen, A. 1999, A&A, 347, 572 [NASA ADS] [Google Scholar]
- Ashman, K., Bird, C., & Zepf, S. 1994, AJ, 108, 2348 [NASA ADS] [CrossRef] [Google Scholar]
- Barbuy, B., Hill, V., Zoccali, M. et al. 2013, A&A, 559, A61 [NASA ADS] [CrossRef] [EDP Sciences] [Google Scholar]
- Bastian, N., & Lardo, C. 2017, ARA&A, in press [arXiv: 1712.01286] [Google Scholar]
- Bastian, N., Lamers, H. J. G. L. M., de Mink, S. E., et al. 2013, MNRAS, 436, 2398 [NASA ADS] [CrossRef] [MathSciNet] [Google Scholar]
- Bastian, N., Cabrera-Ziri, I., & Salaris, M. 2015, MNRAS, 449, 3333 [NASA ADS] [CrossRef] [Google Scholar]
- Bensby, T., Feltzing, S., Lundström, I., & Ilyin, I. 2005, A&A, 433, 185 [NASA ADS] [CrossRef] [EDP Sciences] [Google Scholar]
- Bensby, T., Feltzing, S., & Oey, M. S. 2014, A&A, 562, A71 [NASA ADS] [CrossRef] [EDP Sciences] [Google Scholar]
- Bensby, T., Feltzing, S., Gould, A. et al. 2017, A&A, 605, A89 [NASA ADS] [CrossRef] [EDP Sciences] [Google Scholar]
- Bragaglia, A., Carretta, E., Gratton, R. G. et al. 2001, AJ, 121, 327 [NASA ADS] [CrossRef] [Google Scholar]
- Bragaglia, A., Carretta, E., D’Orazi, V., et al. 2017, A&A, 607, A44 [NASA ADS] [CrossRef] [EDP Sciences] [Google Scholar]
- Cardelli, J. A., Clayton, G. C., & Mathis, J. S. 1989, ApJ, 345, 245 [NASA ADS] [CrossRef] [Google Scholar]
- Carretta, E. 2006, AJ, 131, 1766 [NASA ADS] [CrossRef] [Google Scholar]
- Carretta, E. 2015, ApJ, 810, 148 [NASA ADS] [CrossRef] [Google Scholar]
- Carretta, E., Bragaglia, A., Gratton R. G., et al. 2006, A&A, 450, 523 [NASA ADS] [CrossRef] [EDP Sciences] [Google Scholar]
- Carretta, E., Bragaglia, A., Gratton, R. G. et al. 2007a, A&A, 464, 967 [NASA ADS] [CrossRef] [EDP Sciences] [Google Scholar]
- Carretta, E., Recio-Blanco, A., Gratton, R. G., Piotto, G., & Bragaglia, A. 2007b, ApJ, 671, L125 [NASA ADS] [CrossRef] [Google Scholar]
- Carretta, E., Bragaglia, A., Gratton, R. G., & Lucatello, S. 2009a, A&A, 505, 139 [NASA ADS] [CrossRef] [EDP Sciences] [Google Scholar]
- Carretta, E., Bragaglia, A., Gratton, R. G. et al. 2009b, A&A, 505, 117 [NASA ADS] [CrossRef] [EDP Sciences] [Google Scholar]
- Carretta, E., Bragaglia, A., Gratton, R. G., et al. 2010, A&A, 516, 55 [NASA ADS] [CrossRef] [EDP Sciences] [Google Scholar]
- Carretta, E., Bragaglia, A., Gratton, R.G., Lucatello, S., & D’Orazi, V. 2012, ApJ, 750, L14 [NASA ADS] [CrossRef] [Google Scholar]
- Carretta, E., Bragaglia, A., Gratton, R. G. et al. 2014, A&A, 564, A60 [NASA ADS] [CrossRef] [EDP Sciences] [Google Scholar]
- Casetti-Dinescu, D. I., Girard, T. M., Korchagin, V. I., van Altena, W. F., & López, C. E. 2010, AJ, 140, 1282 [NASA ADS] [CrossRef] [Google Scholar]
- Cottrell, P. L., & Da Costa, G. S. 1981, ApJ, 245, L79 [NASA ADS] [CrossRef] [Google Scholar]
- D’Antona, F., & Caloi, V. 2004, ApJ, 611, 871 [NASA ADS] [CrossRef] [Google Scholar]
- Decressin, T., Meynet, G., Charbonnel C., Prantzos, N., & Ekstrom, S. 2007, A&A, 464, 1029 [NASA ADS] [CrossRef] [EDP Sciences] [Google Scholar]
- Decressin, T., Baumgardt, H., Charbonnel, C., & Kroupa, P. 2010, A&A, 516, A73 [NASA ADS] [CrossRef] [EDP Sciences] [Google Scholar]
- de Mink, S. E., Pols, O. R., Langer, N., & Izzard, R. G. 2009, A&A, 507, L1 [NASA ADS] [CrossRef] [EDP Sciences] [Google Scholar]
- Denisenkov, P. A., & Denisenkova, S. N. 1989, A. Tsir., 1538, 11 [NASA ADS] [Google Scholar]
- D’Ercole, A., D’Antona, F., Ventura, P., Vesperini, E., & McMillan, S. L. W. 2010, MNRAS, 407, 854 [NASA ADS] [CrossRef] [MathSciNet] [Google Scholar]
- Gratton, R. G. 1988, Rome Obs., Preprint Ser., 29 [Google Scholar]
- Gratton, R. G., Carretta, E., Eriksson, K., & Gustafsson, B. 1999, A&A, 350, 955 [NASA ADS] [Google Scholar]
- Gratton, R. G., Carretta, E., Claudi, R., Lucatello, S., & Barbieri, M. 2003, A&A, 404, 187 [NASA ADS] [CrossRef] [EDP Sciences] [Google Scholar]
- Gratton, R. G., Lucatello, S., Bragaglia, A., et al. 2006, A&A, 455, 271 [NASA ADS] [CrossRef] [EDP Sciences] [Google Scholar]
- Gratton, R. G., Carretta, E., & Bragaglia, A. 2012, A&ARv, 20, 50 [CrossRef] [Google Scholar]
- Harris, W. E. 1996, AJ, 112, 1487 [NASA ADS] [CrossRef] [Google Scholar]
- Johansson, S., Litzén, U., Lundberg, H., & Zhang, Z. 2003, ApJ, 584, L107 [NASA ADS] [CrossRef] [Google Scholar]
- Johnson, C. I., Rich, M. R., Pilachowski, C. A., et al. 2015, AJ, 150, 63 [NASA ADS] [CrossRef] [Google Scholar]
- Johnson, C. I., Caldwell, N., Rich, M. R., et al. 2017, ApJ, 842, 24 [NASA ADS] [CrossRef] [Google Scholar]
- Karakas, A. I., & Lattanzio, J. C. 2003, PASA, 20, 279 [NASA ADS] [CrossRef] [MathSciNet] [Google Scholar]
- Kurucz, R. L. 1993, ATLAS9 Stellar Atmosphere Programs and 2 km/s grid, CD-ROM 13 (Cambridge, MA: Smithsonian Astrophysical Observatory) [Google Scholar]
- Langer, G. E., Hoffman, R., & Sneden, C. 1993, PASP, 105, 301 [NASA ADS] [CrossRef] [Google Scholar]
- Lanzoni, B., Mucciarelli, A., Origlia, L. et al. 2013, ApJ, 769, 107 (L13) [NASA ADS] [CrossRef] [Google Scholar]
- Lutzgendorf, N., Gebhardt, K., Baumgardt, H., et al. 2015, A&A, 581, A1 [NASA ADS] [CrossRef] [EDP Sciences] [Google Scholar]
- Magain, P. 1984, A&A, 134, 189 [NASA ADS] [Google Scholar]
- Marino, A. F., Milone, A. P., Karakas, A. I. et al. 2015, MNRAS, 450, 815 [NASA ADS] [CrossRef] [Google Scholar]
- Mészáros, S., Martell, S. L., & Shetrone, M. et al. 2015, AJ, 149, 153 [NASA ADS] [CrossRef] [Google Scholar]
- Neves, V., Santos, N. C., Sousa, S. G., Correia, A. C. M., & Israelian, G. 2009, A&A, 497, 563 [NASA ADS] [CrossRef] [EDP Sciences] [Google Scholar]
- Prantzos, N., Charbonnel, C., & Iliadis, C. 2017, A&A, 608, A28 [NASA ADS] [CrossRef] [EDP Sciences] [Google Scholar]
- Skrutskie, M. F. et al. 2006, AJ, 131, 1163 [NASA ADS] [CrossRef] [Google Scholar]
- Smith, G. H. 1987, PASP, 99, 67 [NASA ADS] [CrossRef] [Google Scholar]
- Ventura, P., D’Antona, F., Mazzitelli, I., & Gratton, R. 2001, ApJ, 550, L65 [NASA ADS] [CrossRef] [Google Scholar]
- Vesperini, E., McMillan, S. L. W., D’Antona, F., & D’Ercole, A. 2013, MNRAS, 429, 1913 [NASA ADS] [CrossRef] [Google Scholar]
- Yi, S., Demarque, P., & Oemler, A. Jr. 1998, ApJ, 492, 480 [NASA ADS] [CrossRef] [Google Scholar]
- Zoccali, M., Vasquez, S., Gonzalez, O. A., et al. 2017, A&A, 599, A12 [NASA ADS] [CrossRef] [EDP Sciences] [Google Scholar]
We adopt the usual spectroscopic notation, i.e. [X] = log(X)star− log(X)⊙ for any abundance quantity X, and log ϵ(X) = log (NX /NH) + 12.0 for absolute number density abundances.
IRAF is the Image Reduction and Analysis Facility, a general purpose software system for the reduction and analysis of astronomical data. IRAF is written and supported by the IRAF programming group at the National Optical Astronomy Observatories (NOAO) in Tucson, Arizona. NOAO is operated by the Association of Universities for Research in Astronomy (AURA), Inc. under cooperative agreement with the National Science Foundation.
Alternatively, they come from the site https://github.com/NuGrid/NuPyCEE/tree/master/stellab_data.
All Tables
Mean abundances from UVES for the present and previous samples and their combination.
Sensitivities of abundance ratios to variations in the atmospheric parameters and to errors in the equivalent widths, and errors in abundances for stars of NGC 6388 observed with UVES.
All Figures
|
Fig. 1 Upper panel: distribution of heliocentric RVs for our sample (open histogram) and the tile closest to the position of NGC 6388 in Zoccali et al. (2017, grey histogram), both normalized to the total numbers in each sample (28 and 437 stars, respectively). Bottom panel: radial velocities in NGC 6388 as a function of the distance from the cluster centre (red: classified members, blue: non-members). The half-mass and tidal radii are indicated by the horizontal lines. |
| In the text | |
|
Fig. 2 V, B − V colour-magnitude diagram for NGC 6388 using WFI photometry (small grey points). Large blue filled circles indicate the stars in our new sample with UVES spectra. Filled red triangles are giants with UVES spectra analysed in Carretta et al. (2007a) and empty red circles are stars with GIRAFFE spectra studied in Carretta et al. (2009b). |
| In the text | |
|
Fig. 3 Iron abundances from neutral and singly ionized lines (upper and middle panels, respectively) and their differences (lower panel) as a function of the effective temperatures. Filled symbols are stars with UVES spectra (blue circles: this work, red triangles: Carretta et al. 2007a), whereas open circles are stars with GIRAFFE spectra (Carretta et al. 2009b). Star-to-star error bars for GIRAFFE and UVES are indicated on the left and right side, respectively. |
| In the text | |
|
Fig. 4 Abundance ratios for proton-capture elements O, Na, Mg, Al, and Si (from top to bottom) from UVES spectra as a function of the effective temperatures in NGC 6388. Red triangles: RGB stars from Carretta et al. (2007a); blue circles: new sample from the present work, with internal errors plotted in each panel. |
| In the text | |
|
Fig. 5 Relations among the abundance ratios of O, Na, Mg, and Si. Symbols are as in Fig. 4. In the top left panel, open circles are stars of NGC 6388 with abundances derived from GIRAFFE spectra in Carretta et al. (2009b). |
| In the text | |
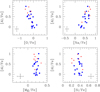 |
Fig. 6 [Al/Fe] as a function of O, Na, Mg, and Si. Symbols are as in Fig. 4. |
| In the text | |
|
Fig. 7 Interquartile range of the [O/Na] ratio vs total absolute magnitude for GCs in our FLAMES survey, with the updated value derived in the present work for NGC 6388 (cyan star simbol). |
| In the text | |
|
Fig. 8 Upper and lower panels: Mg+Al and Mg+Al+Si, respectively, as a function of the [Al/Fe] abundance. Blue, green, and red circles respectively indicate stars of the P, I, and E components, according to the definition by Carretta et al. (2009b). |
| In the text | |
|
Fig. 9 Histogram of the distribution of stars along the Al–O anticorrelation. |
| In the text | |
|
Fig. 10 Simple dilution models for the Al–O and Na–O anticorrelations. Upper left panel: observed Al–O data. Upper middle panel: dilution model anchored to the mean values of the P and E components (large black points). Error bars here are rms scatter values and the separation into the P, I, and E components is made according to the Al–O data. Upper right panel: same, but following the classical P, I, E classification from the Na–O anticorrelation. Lower panels: same as upper panels, but for the Na–O data. The middle panel refers to the combined GIRAFFE+UVES sample, and the right panel to the UVES data alone. |
| In the text | |
|
Fig. 11 Dilution values for different species (indicated by atomic number). The reference samples are labelled in each panel. Solid and dashed lines represent the average value of dil and ± 1σ, respectively. |
| In the text | |
|
Fig. 12 Cumulative radial distribution of first- and second-generation stars in NGC 6388. The results of the Kolmogorov–Smirnov test between the distribution of FG and SG stars are labelled. |
| In the text | |
|
Fig. 13 Comparison of abundances of O, Na, Mg, and Al in NGC 6388 with different samples of field stars. Blue circles and red filled triangles are stars in NGC 6388. The samples, references, and symbols for the field stars are in Table 10. The internal error bars displayed refer to the sample analysed in the present work. |
| In the text | |
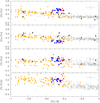 |
Fig. 14 As in Fig. 13, but for Si, Ca, Ti I, and Ti II. |
| In the text | |
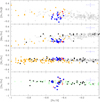 |
Fig. 15 As in Fig. 13, but for Sc II, Mn, Ni, and Zn. |
| In the text | |
Current usage metrics show cumulative count of Article Views (full-text article views including HTML views, PDF and ePub downloads, according to the available data) and Abstracts Views on Vision4Press platform.
Data correspond to usage on the plateform after 2015. The current usage metrics is available 48-96 hours after online publication and is updated daily on week days.
Initial download of the metrics may take a while.