Fig. 1
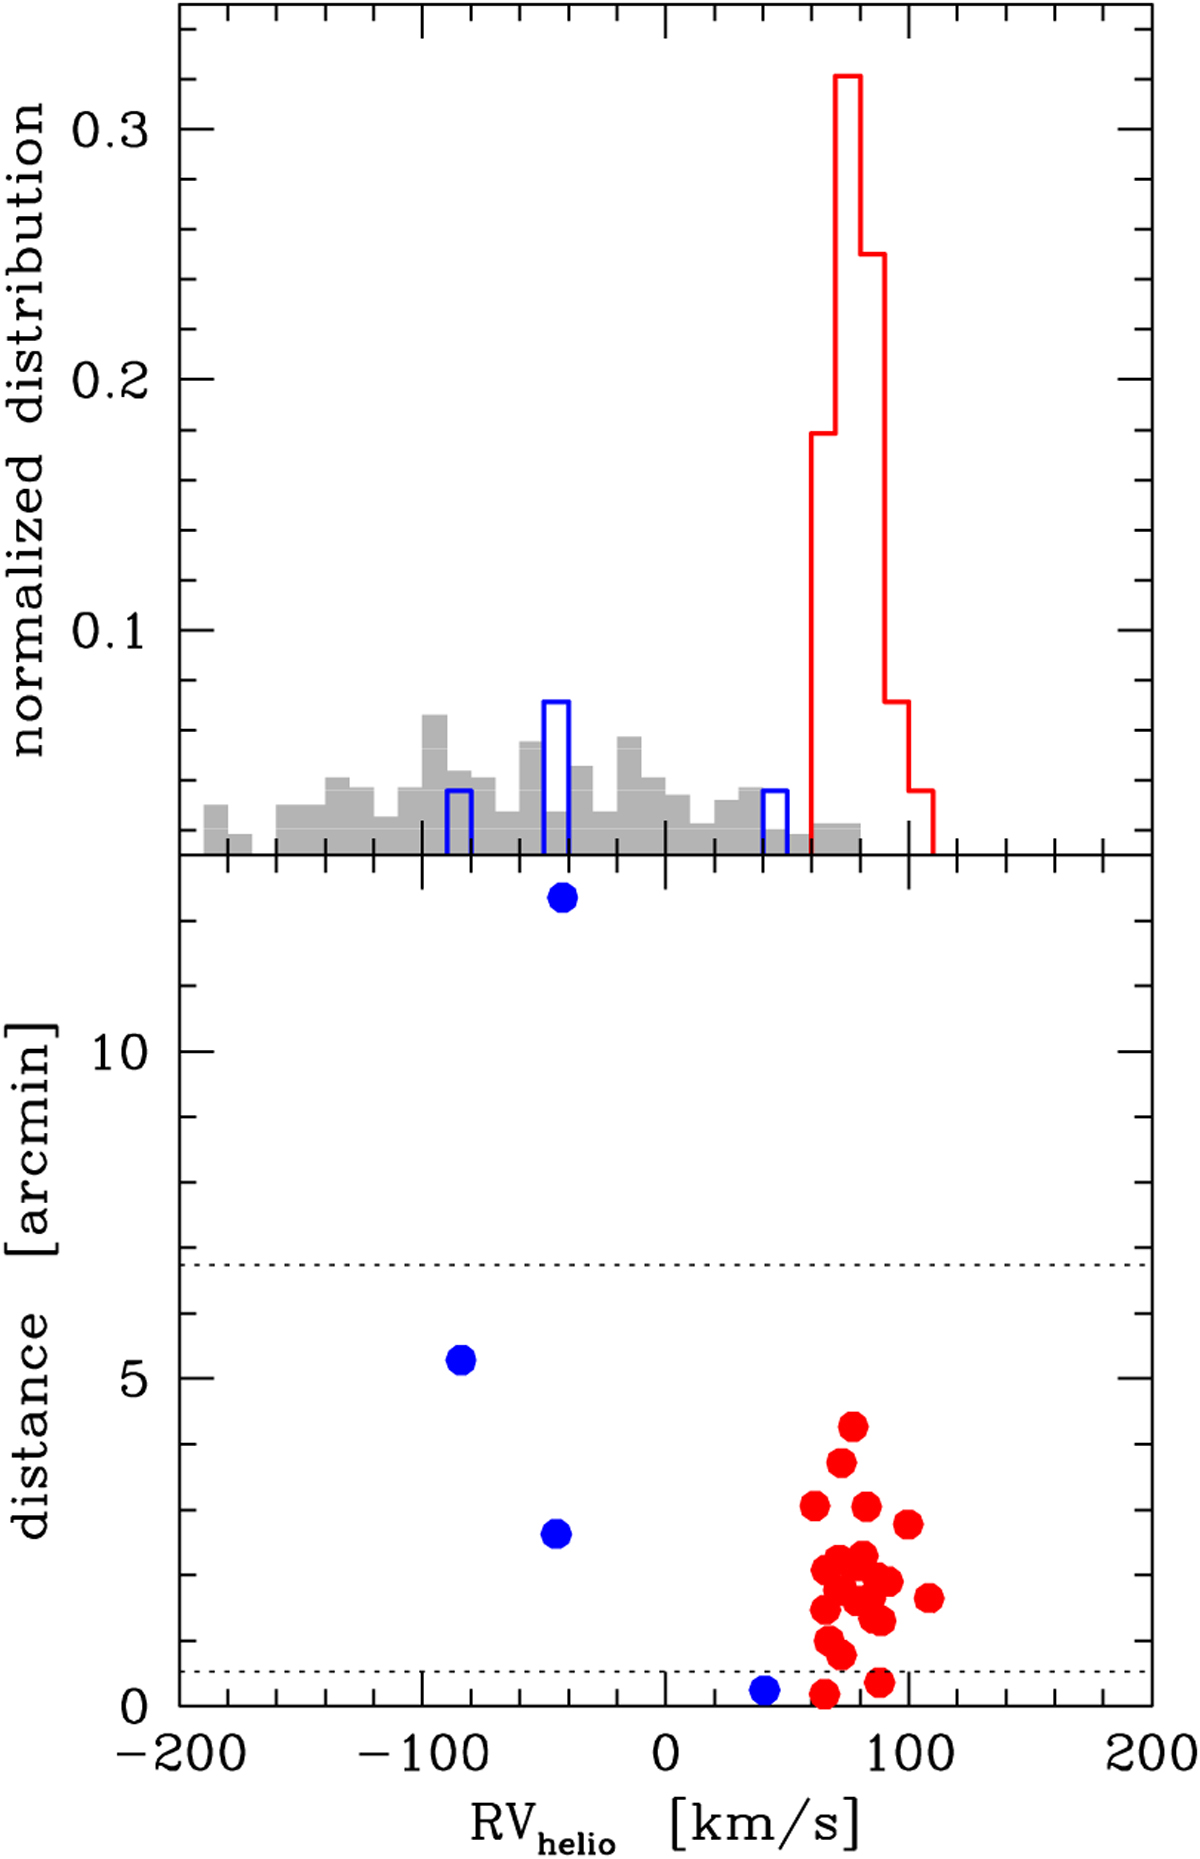
Upper panel: distribution of heliocentric RVs for our sample (open histogram) and the tile closest to the position of NGC 6388 in Zoccali et al. (2017, grey histogram), both normalized to the total numbers in each sample (28 and 437 stars, respectively). Bottom panel: radial velocities in NGC 6388 as a function of the distance from the cluster centre (red: classified members, blue: non-members). The half-mass and tidal radii are indicated by the horizontal lines.
Current usage metrics show cumulative count of Article Views (full-text article views including HTML views, PDF and ePub downloads, according to the available data) and Abstracts Views on Vision4Press platform.
Data correspond to usage on the plateform after 2015. The current usage metrics is available 48-96 hours after online publication and is updated daily on week days.
Initial download of the metrics may take a while.