Fig. 10
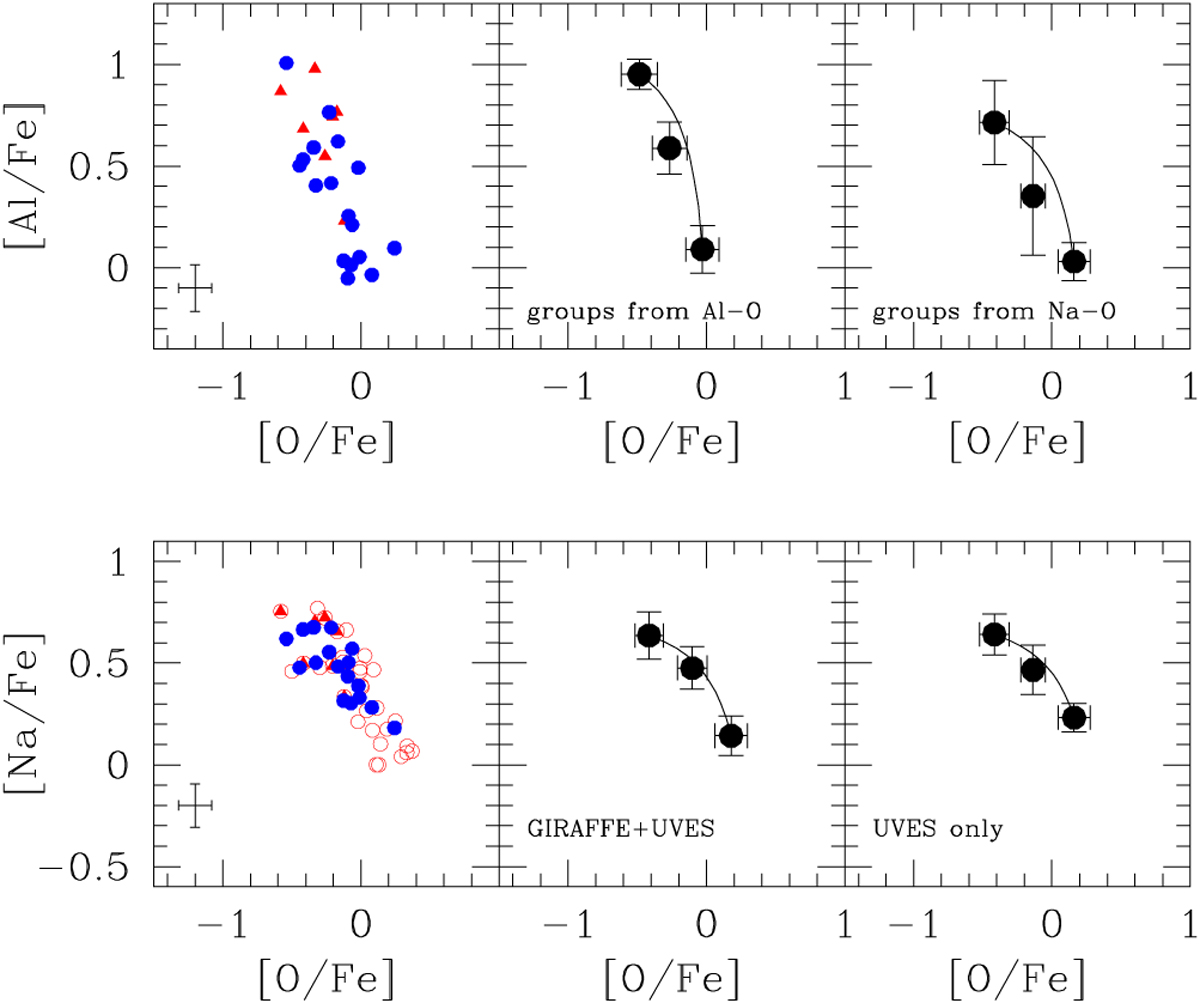
Simple dilution models for the Al–O and Na–O anticorrelations. Upper left panel: observed Al–O data. Upper middle panel: dilution model anchored to the mean values of the P and E components (large black points). Error bars here are rms scatter values and the separation into the P, I, and E components is made according to the Al–O data. Upper right panel: same, but following the classical P, I, E classification from the Na–O anticorrelation. Lower panels: same as upper panels, but for the Na–O data. The middle panel refers to the combined GIRAFFE+UVES sample, and the right panel to the UVES data alone.
Current usage metrics show cumulative count of Article Views (full-text article views including HTML views, PDF and ePub downloads, according to the available data) and Abstracts Views on Vision4Press platform.
Data correspond to usage on the plateform after 2015. The current usage metrics is available 48-96 hours after online publication and is updated daily on week days.
Initial download of the metrics may take a while.