Fig. 8
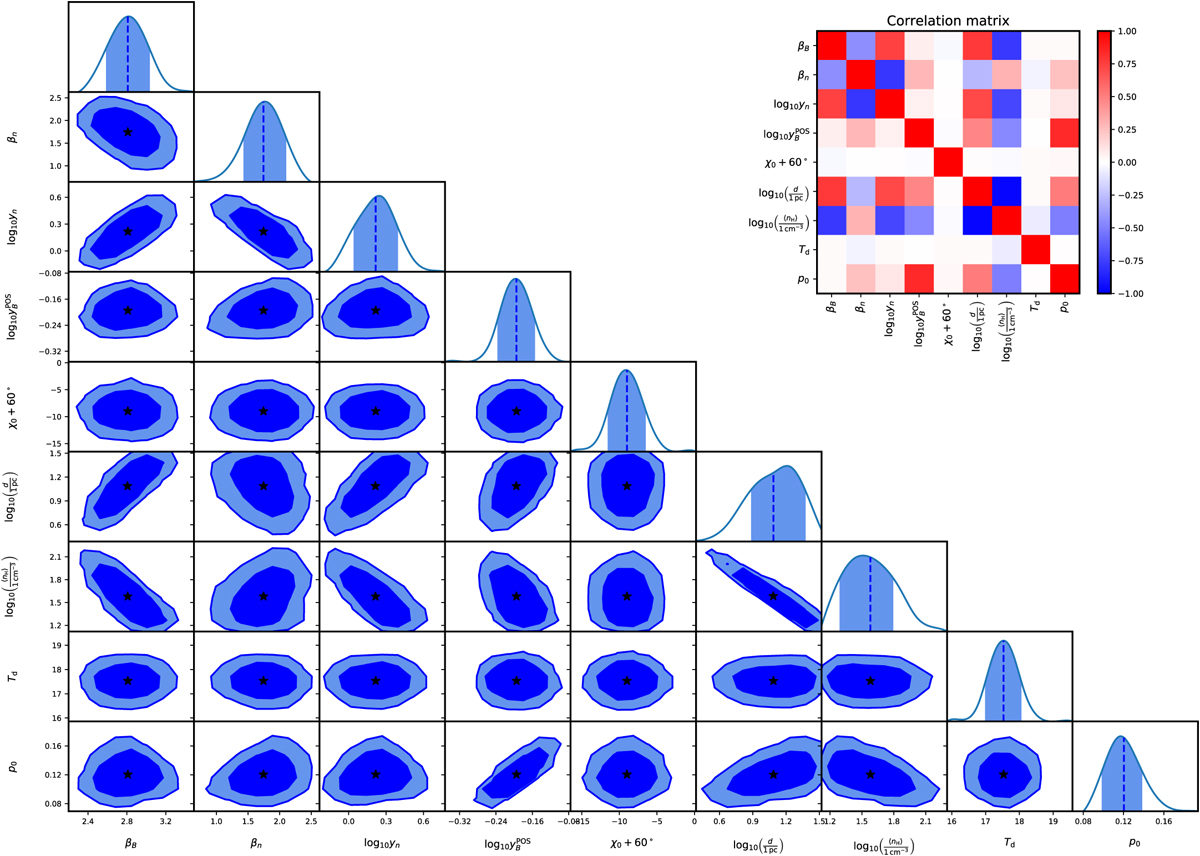
Constraints (posterior probability contours and marginalized PDFs) on the statistical properties of the dust density and magnetic field for the Planck maps of the Polaris Flare. On the posterior probability contours, the filled dark and light blue regions respectively enclose 68.3% and 95.4% of the probability, and the black stars indicate the averages over the two-dimensional posterior PDFs. In the plots showing the marginalized posterior PDFs, the light blue regions enclose 68.3% of the probability, and the dashed blue lines indicate the averages over the posterior PDFs. The upper right plot displays the correlation matrix between the fitted parameters.
Current usage metrics show cumulative count of Article Views (full-text article views including HTML views, PDF and ePub downloads, according to the available data) and Abstracts Views on Vision4Press platform.
Data correspond to usage on the plateform after 2015. The current usage metrics is available 48-96 hours after online publication and is updated daily on week days.
Initial download of the metrics may take a while.