Fig. 7
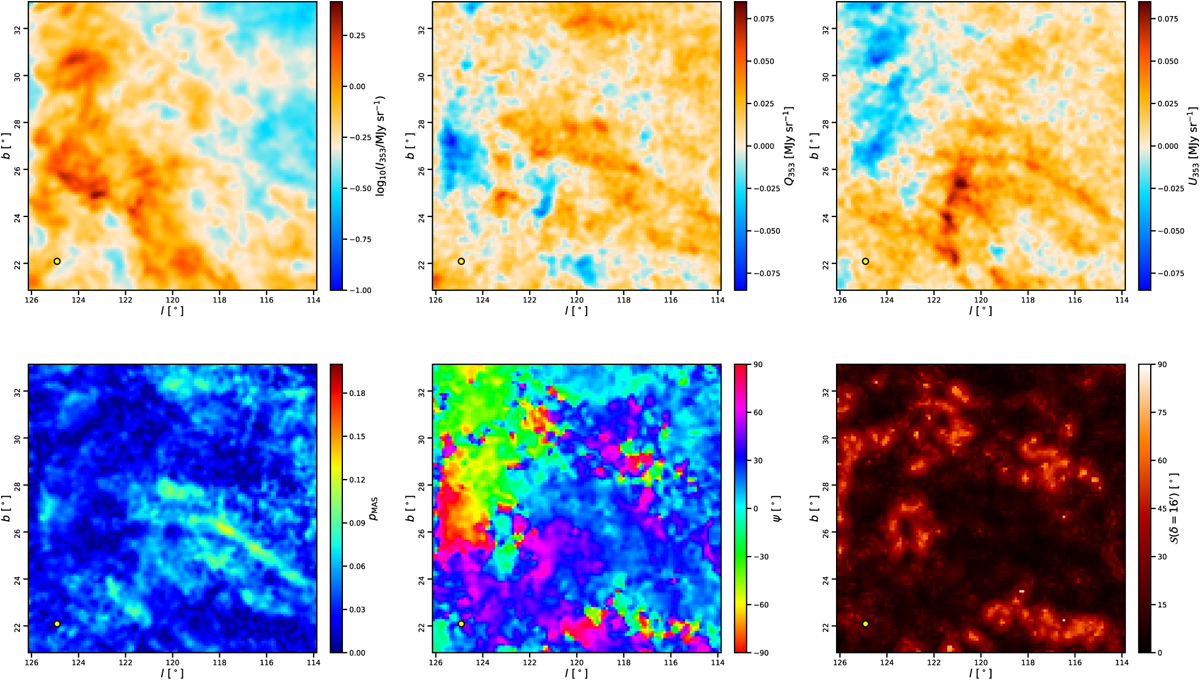
Planck 353 GHz maps of the Polaris Flare molecular cloud. The top row shows, from left to right, the total intensity I353 on a logarithmic scale, the Stokes Q353 map and the Stokes U353 map, while the bottom row shows the polarization fraction pMAS, the polarization angle ψ, and the polarization angle dispersion function ![]() . The τ353 and Tobs maps have the same aspects as the I353 map but with their own scales.
. The τ353 and Tobs maps have the same aspects as the I353 map but with their own scales.
Current usage metrics show cumulative count of Article Views (full-text article views including HTML views, PDF and ePub downloads, according to the available data) and Abstracts Views on Vision4Press platform.
Data correspond to usage on the plateform after 2015. The current usage metrics is available 48-96 hours after online publication and is updated daily on week days.
Initial download of the metrics may take a while.