Fig. 5
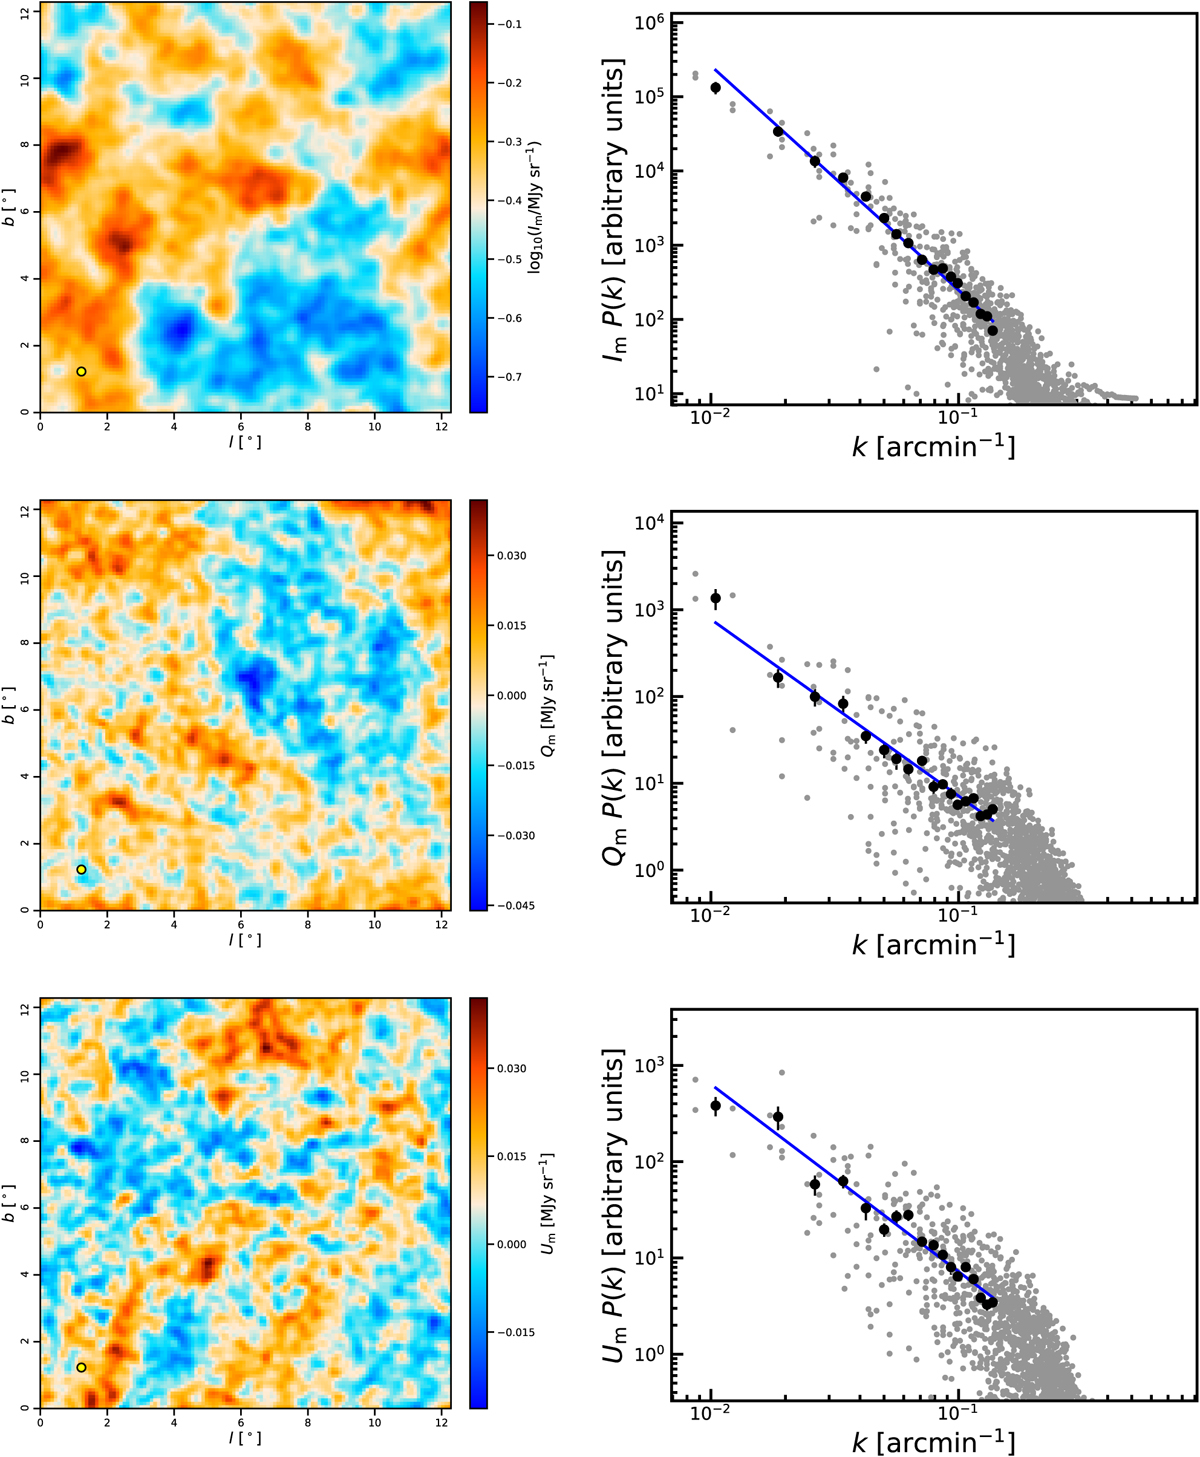
Left column row: example maps (from top to bottom: total intensity Im on a logarithmic scale, Stokes Qm, and Stokes Um) from simulation A (see Sect. 5 and Table 3). Right column: corresponding power spectra. The grey points represent the two-dimensional power spectra, while the black dots represent the azimuthal averages in Fourier space in a set of wavenumber bins, and the blue line is a power-law fit to the black points.
Current usage metrics show cumulative count of Article Views (full-text article views including HTML views, PDF and ePub downloads, according to the available data) and Abstracts Views on Vision4Press platform.
Data correspond to usage on the plateform after 2015. The current usage metrics is available 48-96 hours after online publication and is updated daily on week days.
Initial download of the metrics may take a while.